The 2021 census has been released and that means it is time to dive right into some population trends. Canadian population numbers have changed substantially between 2016 and 2021 and this post will go into more detail about British Columbia. You can also read more about the population changes in Nova Scotia, New Brunswick, Newfoundland, PEI, Quebec, Ontario, Manitoba, Saskatchewan, and Alberta.

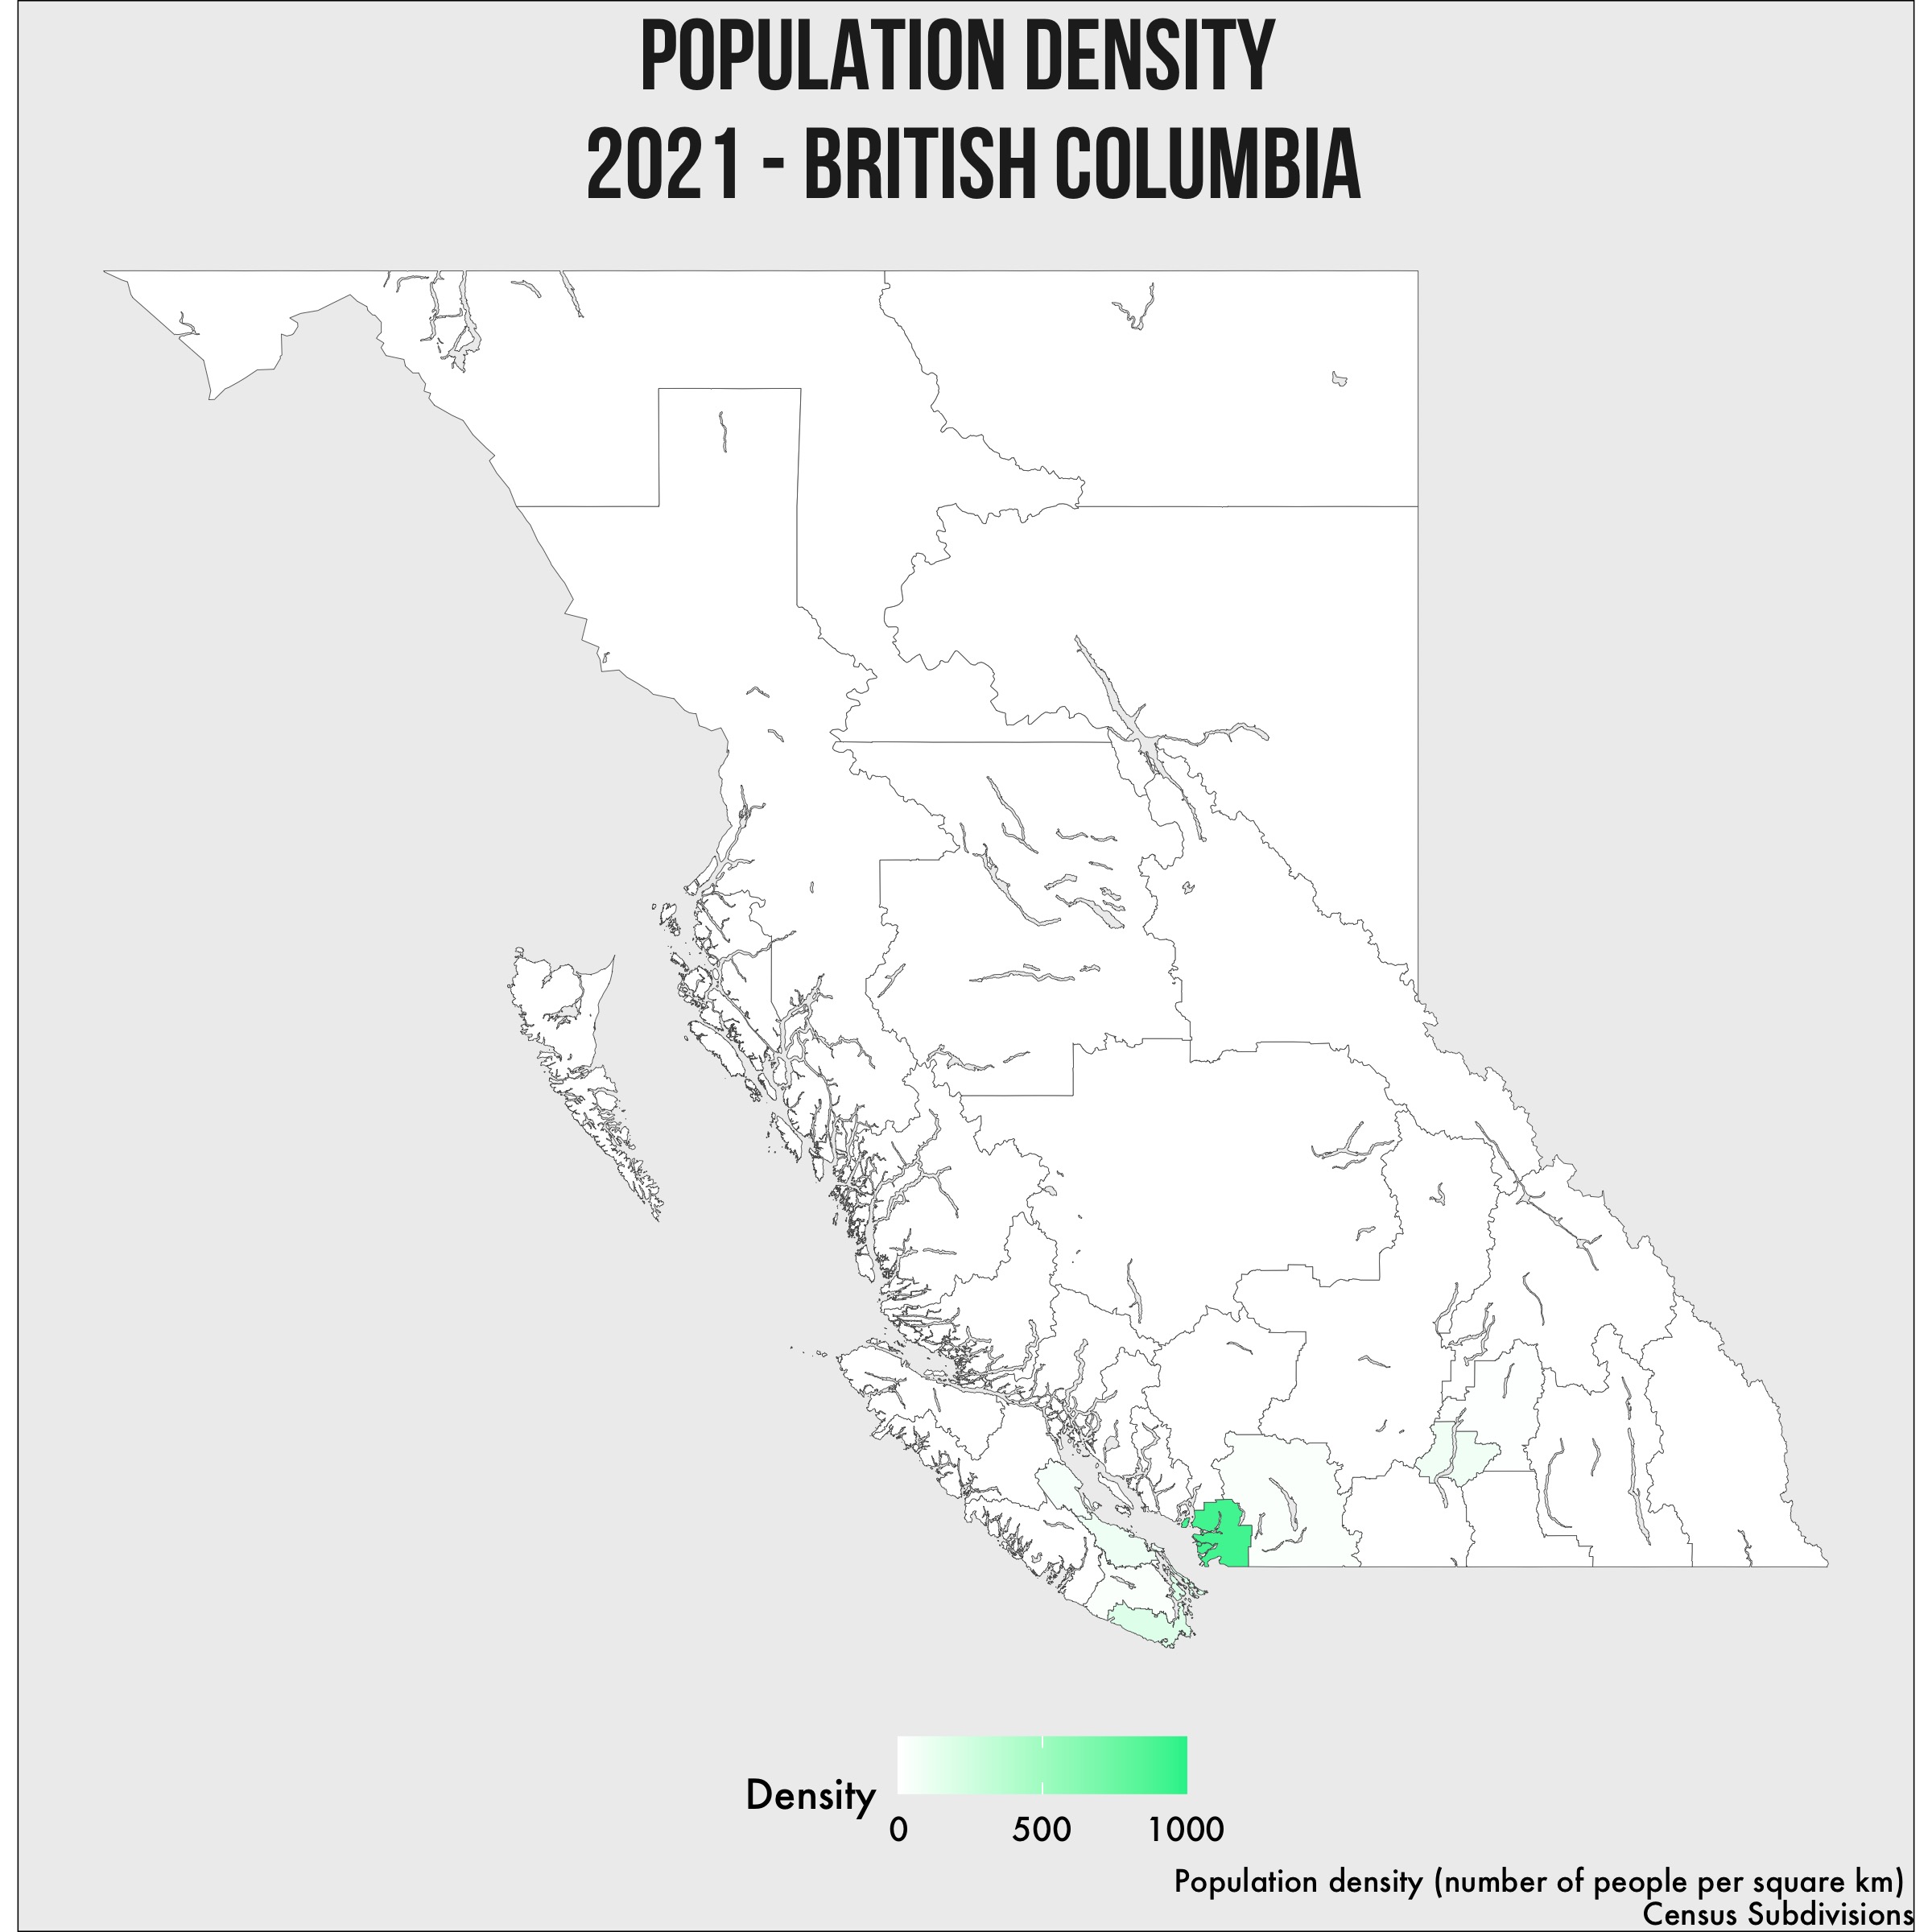
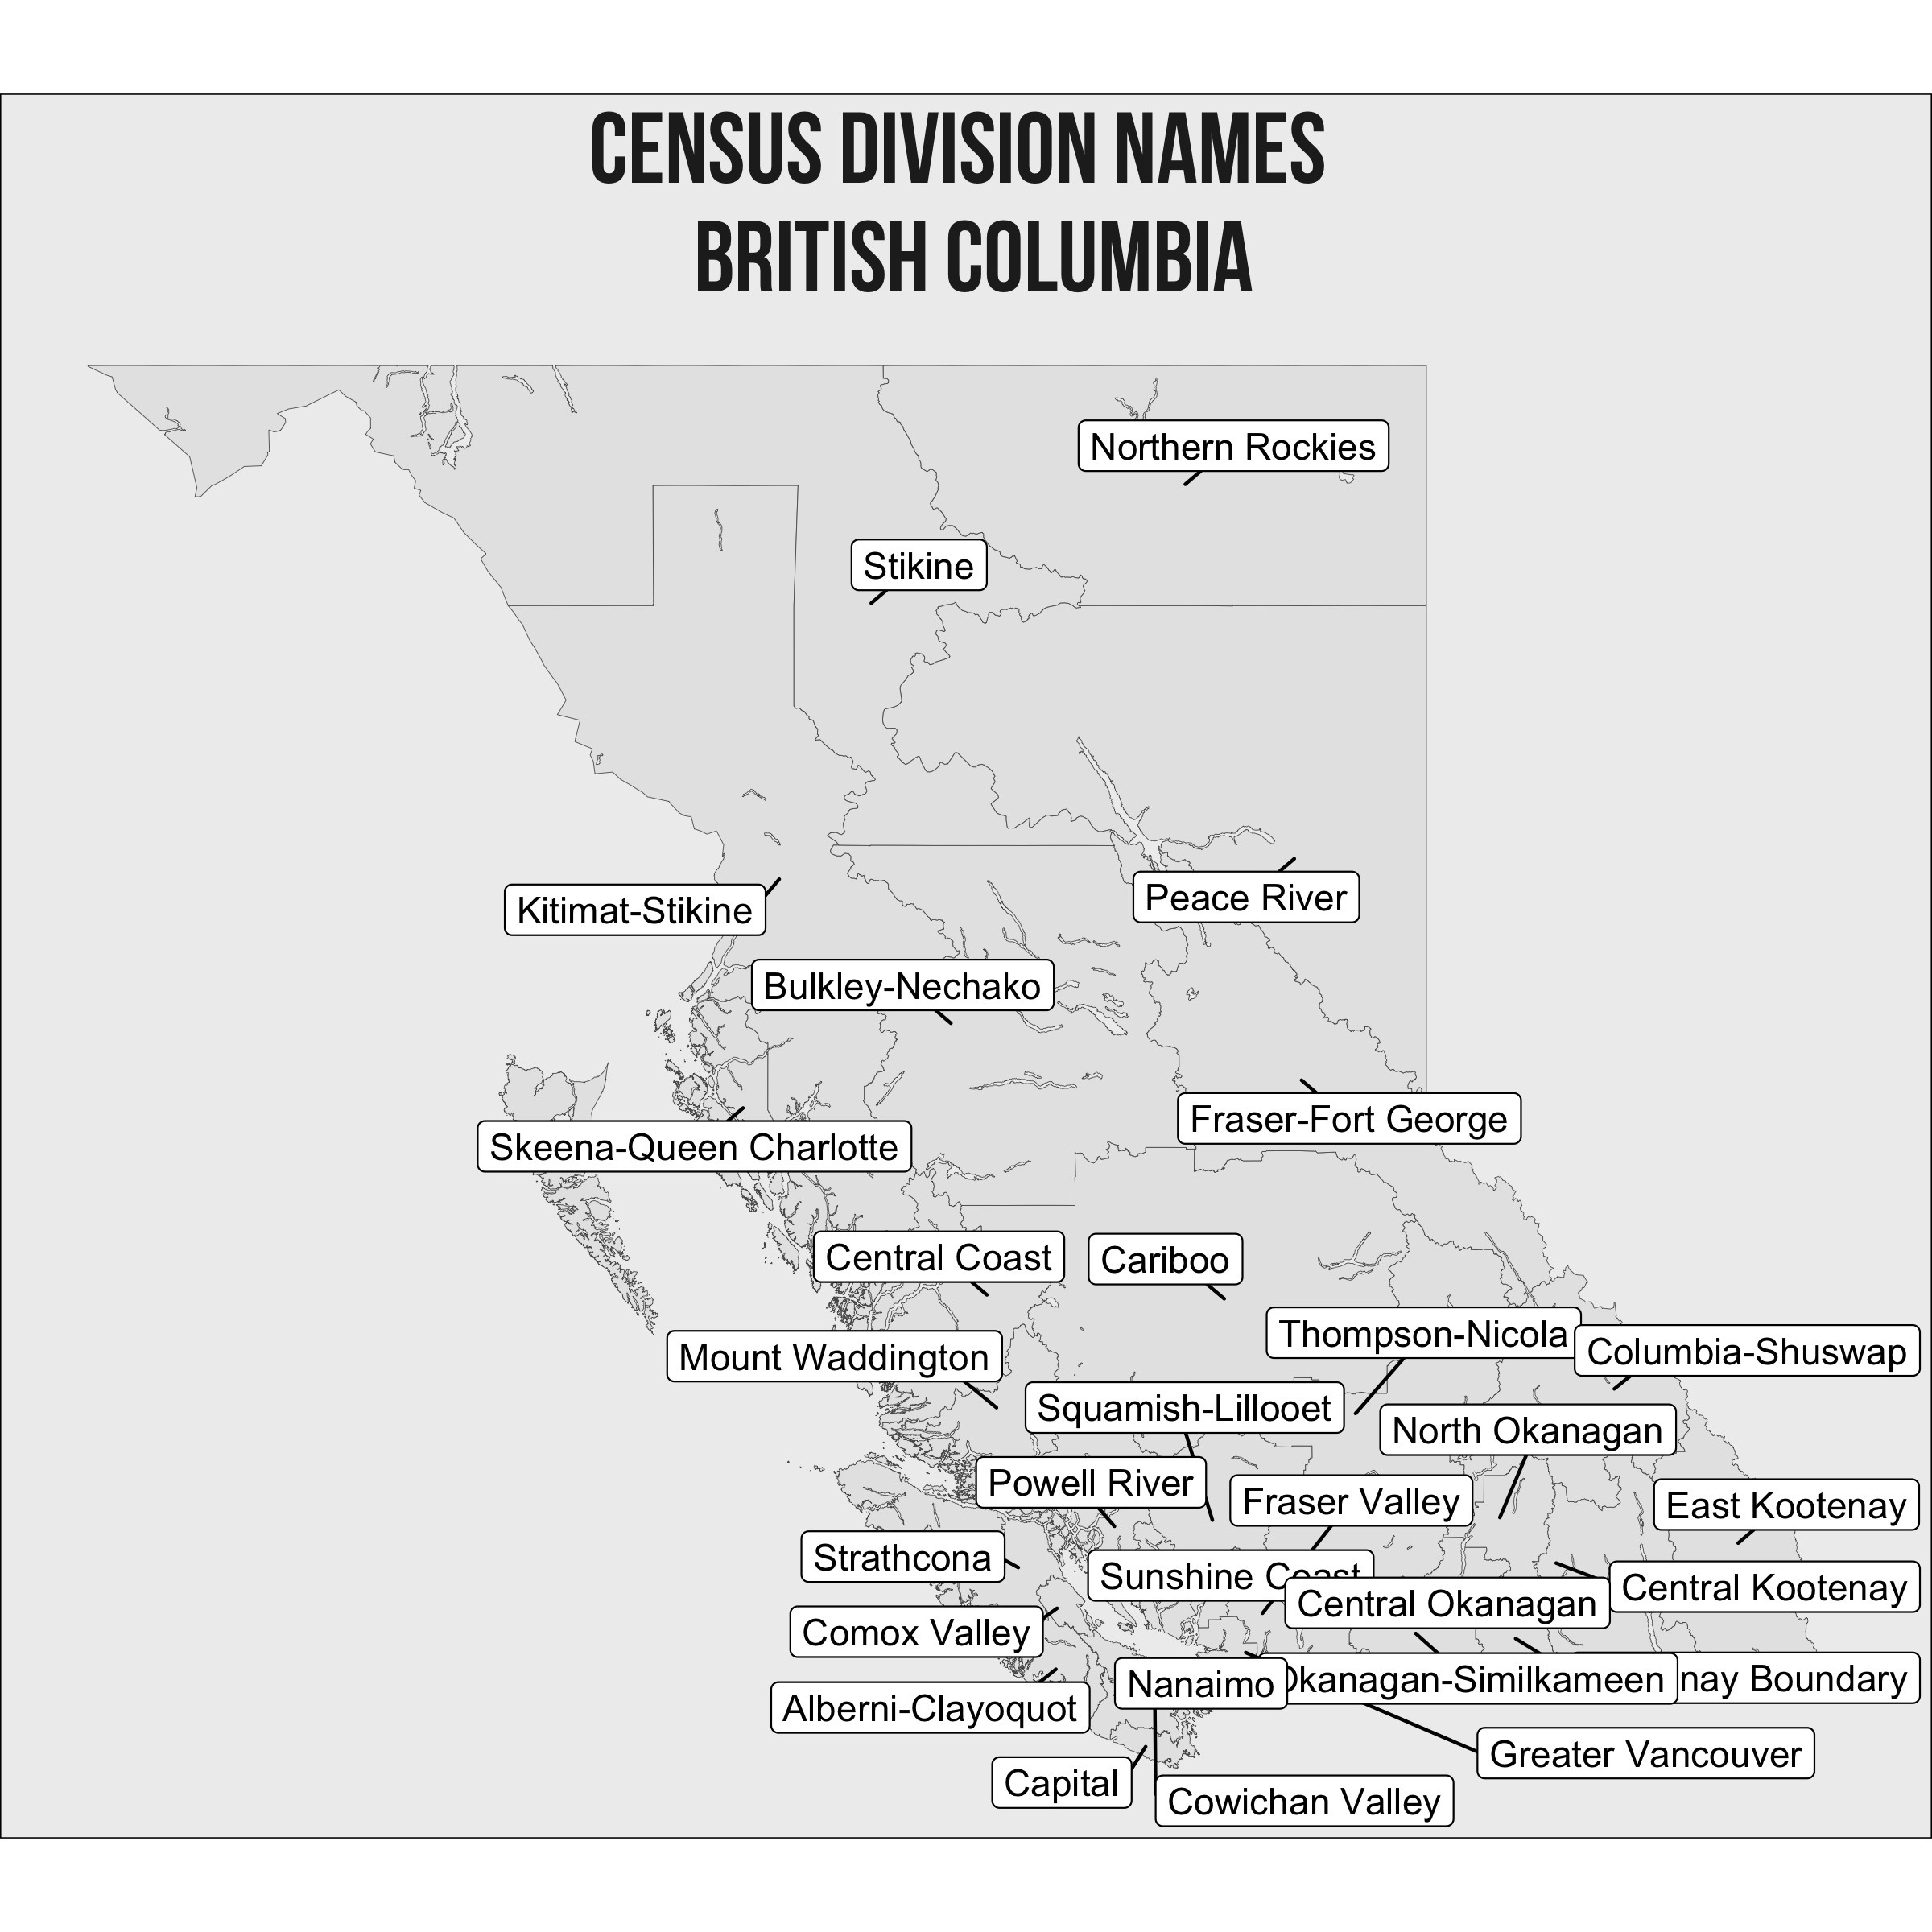
There are 29 different census division in British Columbia. A census division is defined by Statistics Canada as a “group of neighbouring municipalities joined together for the purposes of regional planning and managing common services”. The boundaries and population density of each of those 19 census divisions is shown on the map above, and the names are displayed on the map to the right.
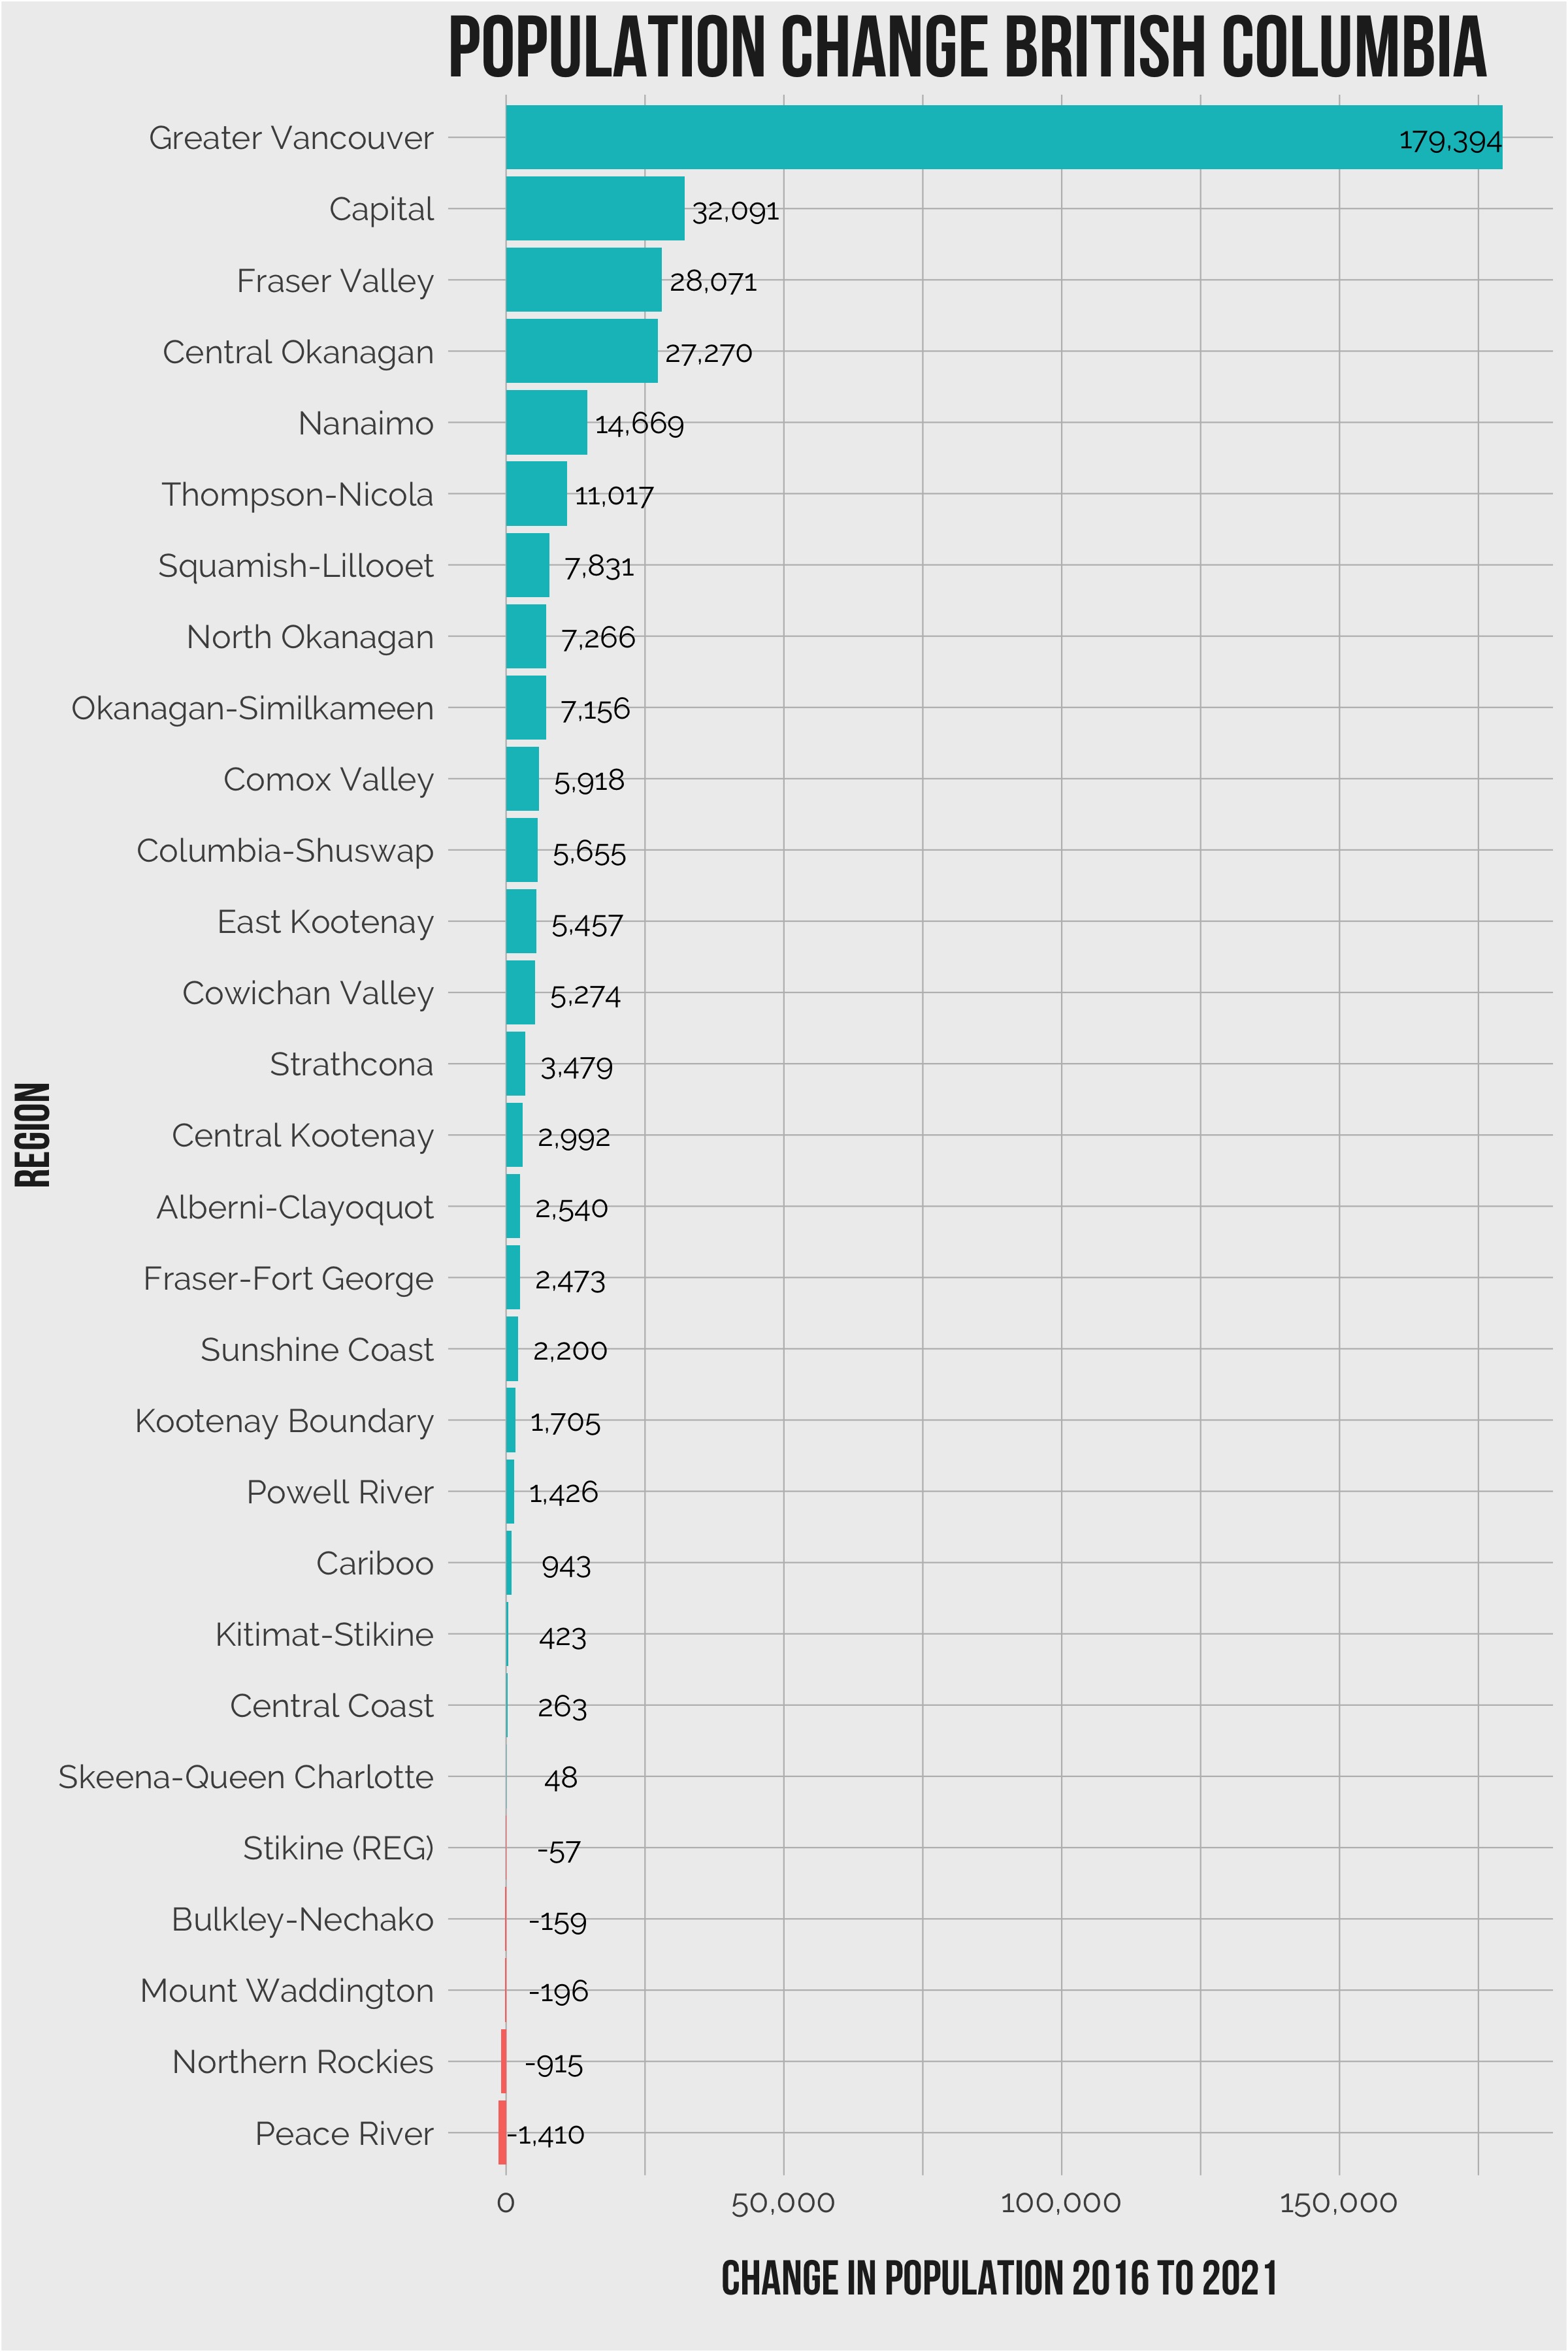
As a province, BC’s overall population grew by 352,824 from 4,648,055 in 2016 to 5,000,879 in 2021. 24 of the 29 census divisions in the province saw growth.
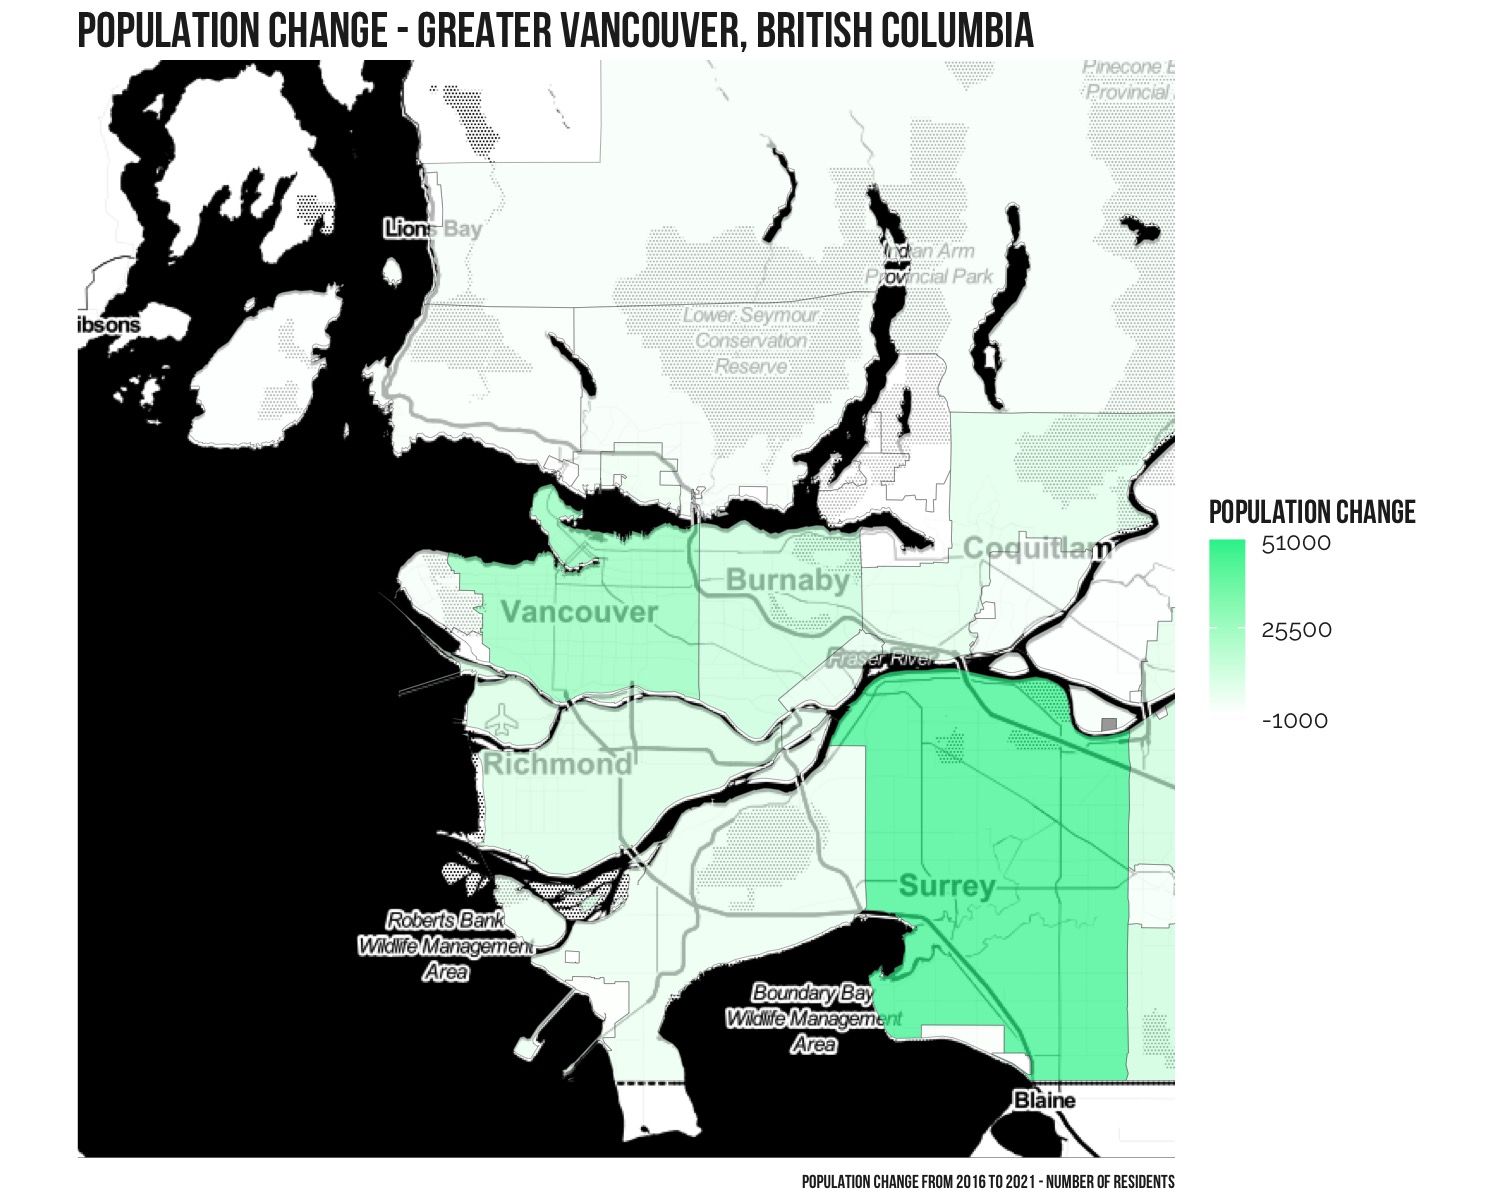
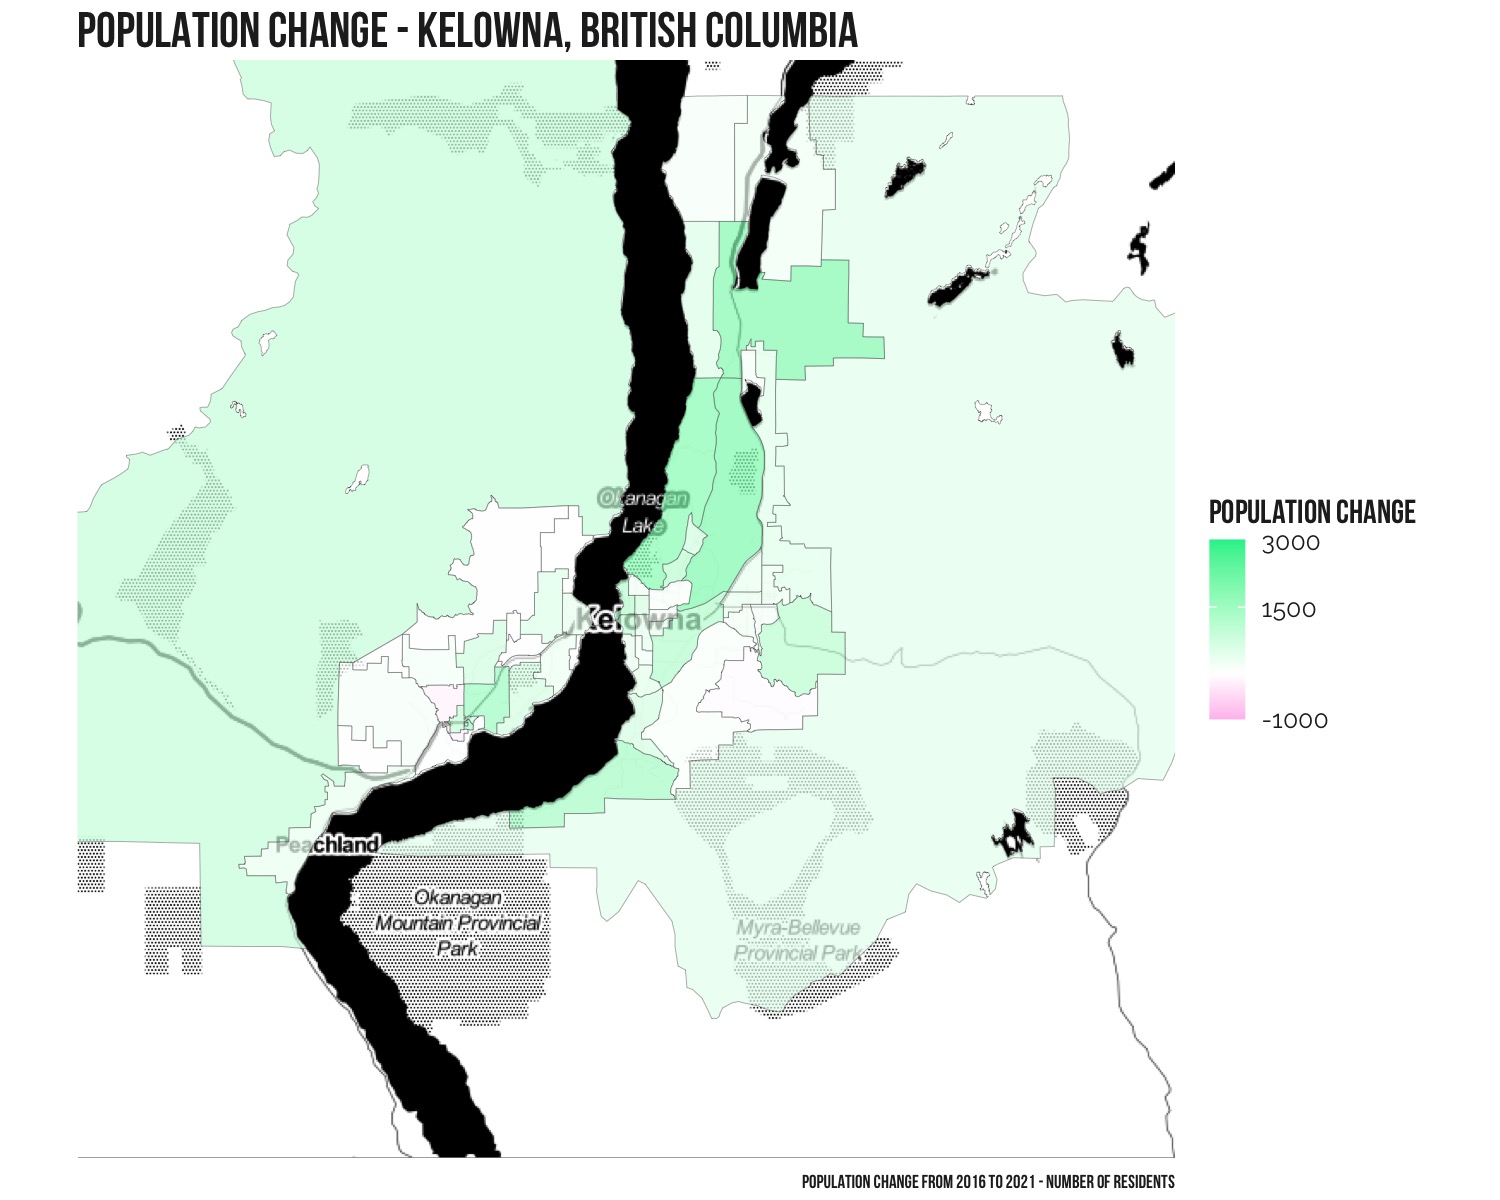
The census division of Central Okanagan which includes Kelowna, saw the highest percentage increase at nearly 14%. The census division of Greater Vancouver which includes the city of Vancouver, saw the largest overall population growth with an increase of 179,394 residents from 2,463,431 in 2016 to 2,642,825 in 2021 (7.3%).
| Region | Population 2016 | Population 2021 | Population Difference | Population Difference Percent |
|---|---|---|---|---|
| Greater Vancouver | 2,463,431 | 2,642,825 | 179,394 | 7.28 |
| Capital | 383,360 | 415,451 | 32,091 | 8.37 |
| Fraser Valley | 295,934 | 324,005 | 28,071 | 9.49 |
| Central Okanagan | 194,892 | 222,162 | 27,270 | 13.99 |
| Nanaimo | 155,698 | 170,367 | 14,669 | 9.42 |
| Thompson-Nicola | 132,663 | 143,680 | 11,017 | 8.3 |
| Squamish-Lillooet | 42,665 | 50,496 | 7,831 | 18.35 |
| North Okanagan | 84,344 | 91,610 | 7,266 | 8.61 |
| Okanagan-Similkameen | 83,022 | 90,178 | 7,156 | 8.62 |
| Comox Valley | 66,527 | 72,445 | 5,918 | 8.9 |
| Columbia-Shuswap | 51,366 | 57,021 | 5,655 | 11.01 |
| East Kootenay | 60,439 | 65,896 | 5,457 | 9.03 |
| Cowichan Valley | 83,739 | 89,013 | 5,274 | 6.3 |
| Strathcona | 44,671 | 48,150 | 3,479 | 7.79 |
| Central Kootenay | 59,517 | 62,509 | 2,992 | 5.03 |
| Alberni-Clayoquot | 30,981 | 33,521 | 2,540 | 8.2 |
| Fraser-Fort George | 94,506 | 96,979 | 2,473 | 2.62 |
| Sunshine Coast | 29,970 | 32,170 | 2,200 | 7.34 |
| Kootenay Boundary | 31,447 | 33,152 | 1,705 | 5.42 |
| Powell River | 20,070 | 21,496 | 1,426 | 7.11 |
| Cariboo | 61,988 | 62,931 | 943 | 1.52 |
| Kitimat-Stikine | 37,367 | 37,790 | 423 | 1.13 |
| Central Coast | 3,319 | 3,582 | 263 | 7.92 |
| Skeena-Queen Charlotte | 18,133 | 18,181 | 48 | 0.26 |
| Stikine (REG) | 740 | 683 | -57 | -7.7 |
| Bulkley-Nechako | 37,896 | 37,737 | -159 | -0.42 |
| Mount Waddington | 11,035 | 10,839 | -196 | -1.78 |
| Northern Rockies | 5,393 | 4,478 | -915 | -16.97 |
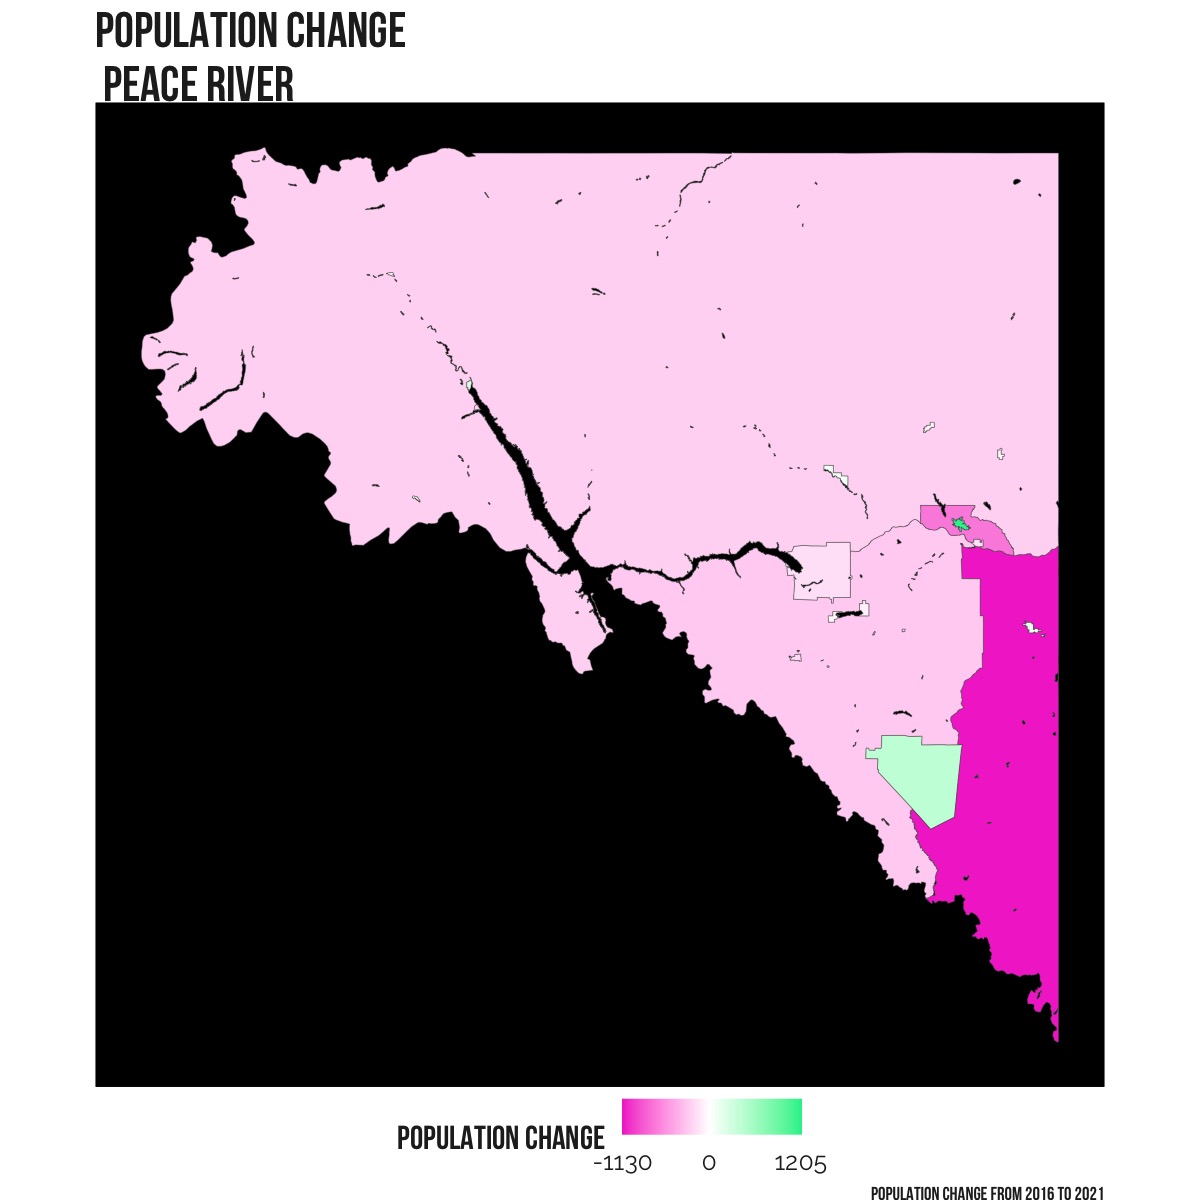
| Peace River | 62,942 | 61,532 | -1,410 | -2.24 |
Which areas have seen high growth?
Of the 29 census divisions in the province, 24 saw population growth between 2016 and 2021.
The next level down to consider is the census subdivision, which Statistics Canada defines as “the general term for municipalities”.
High growth area #1
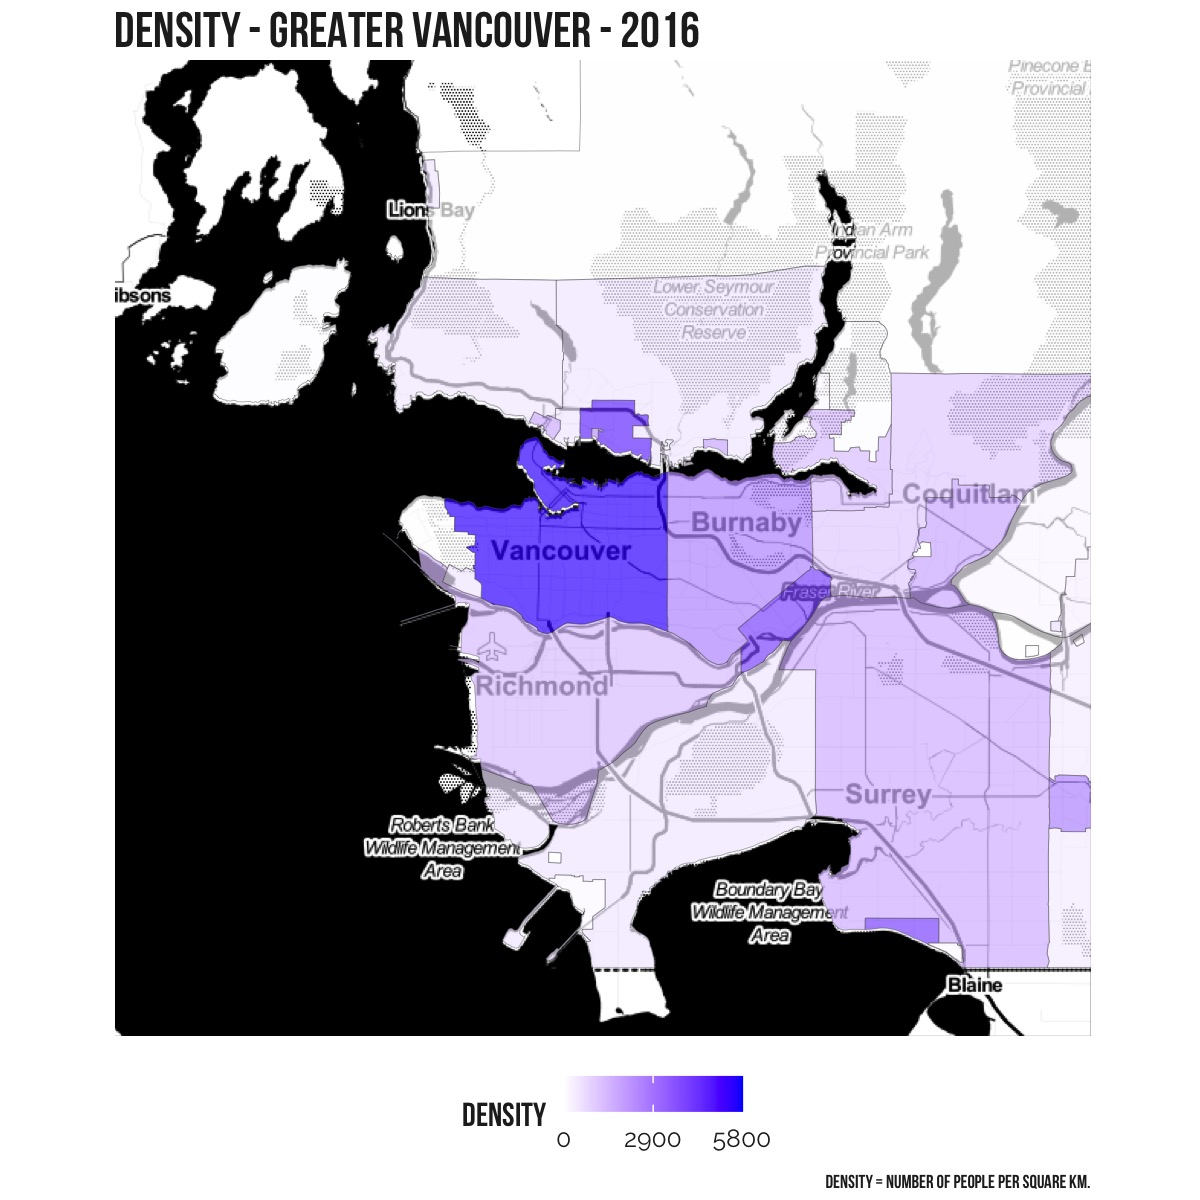
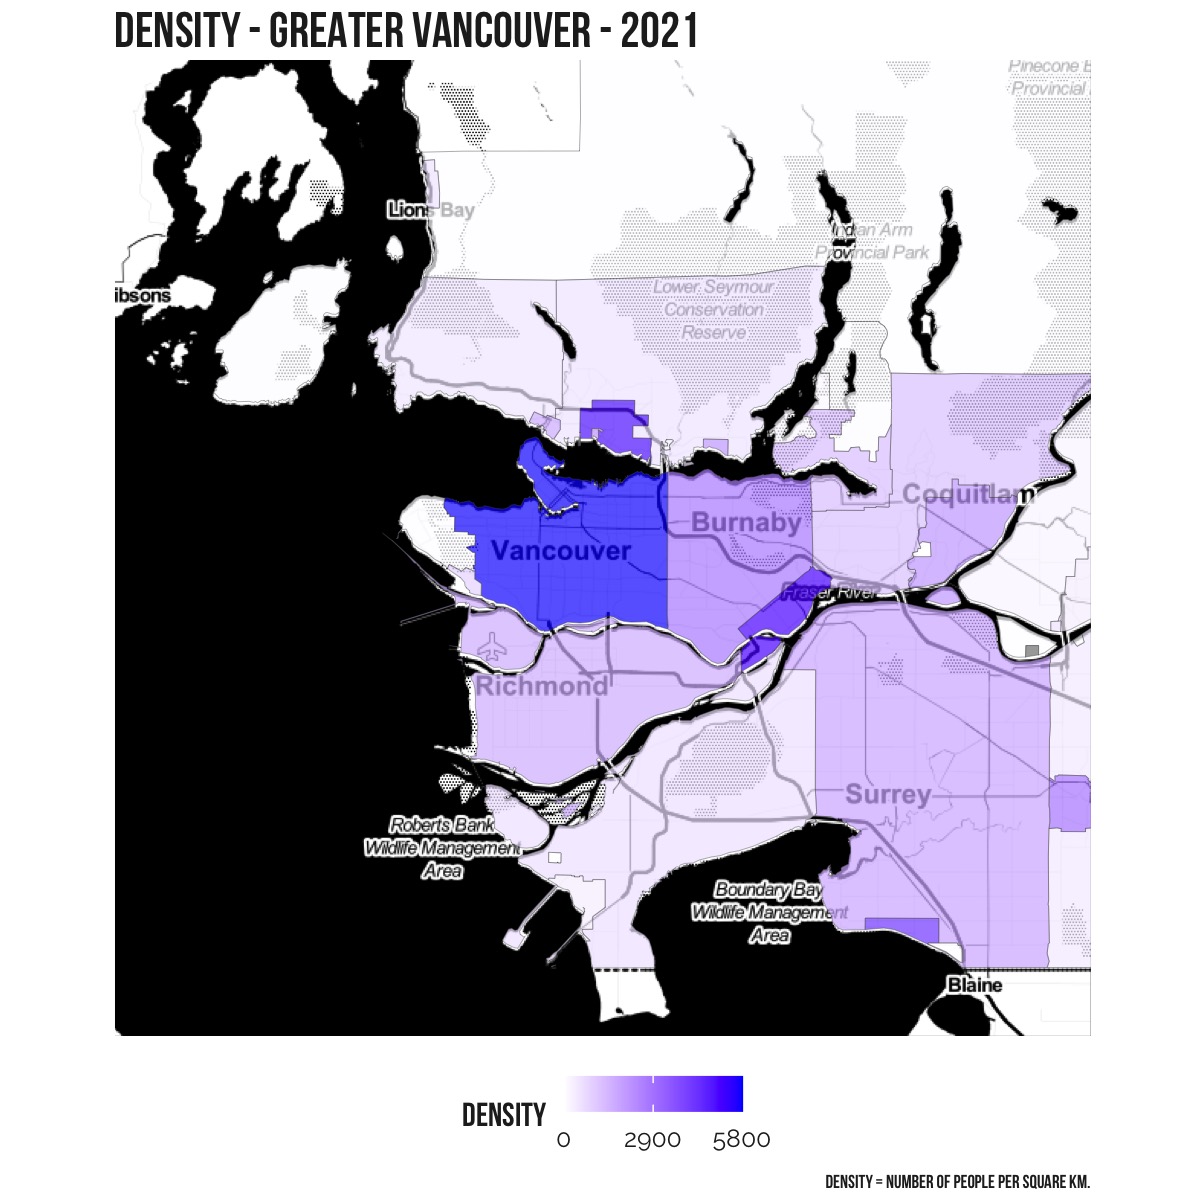
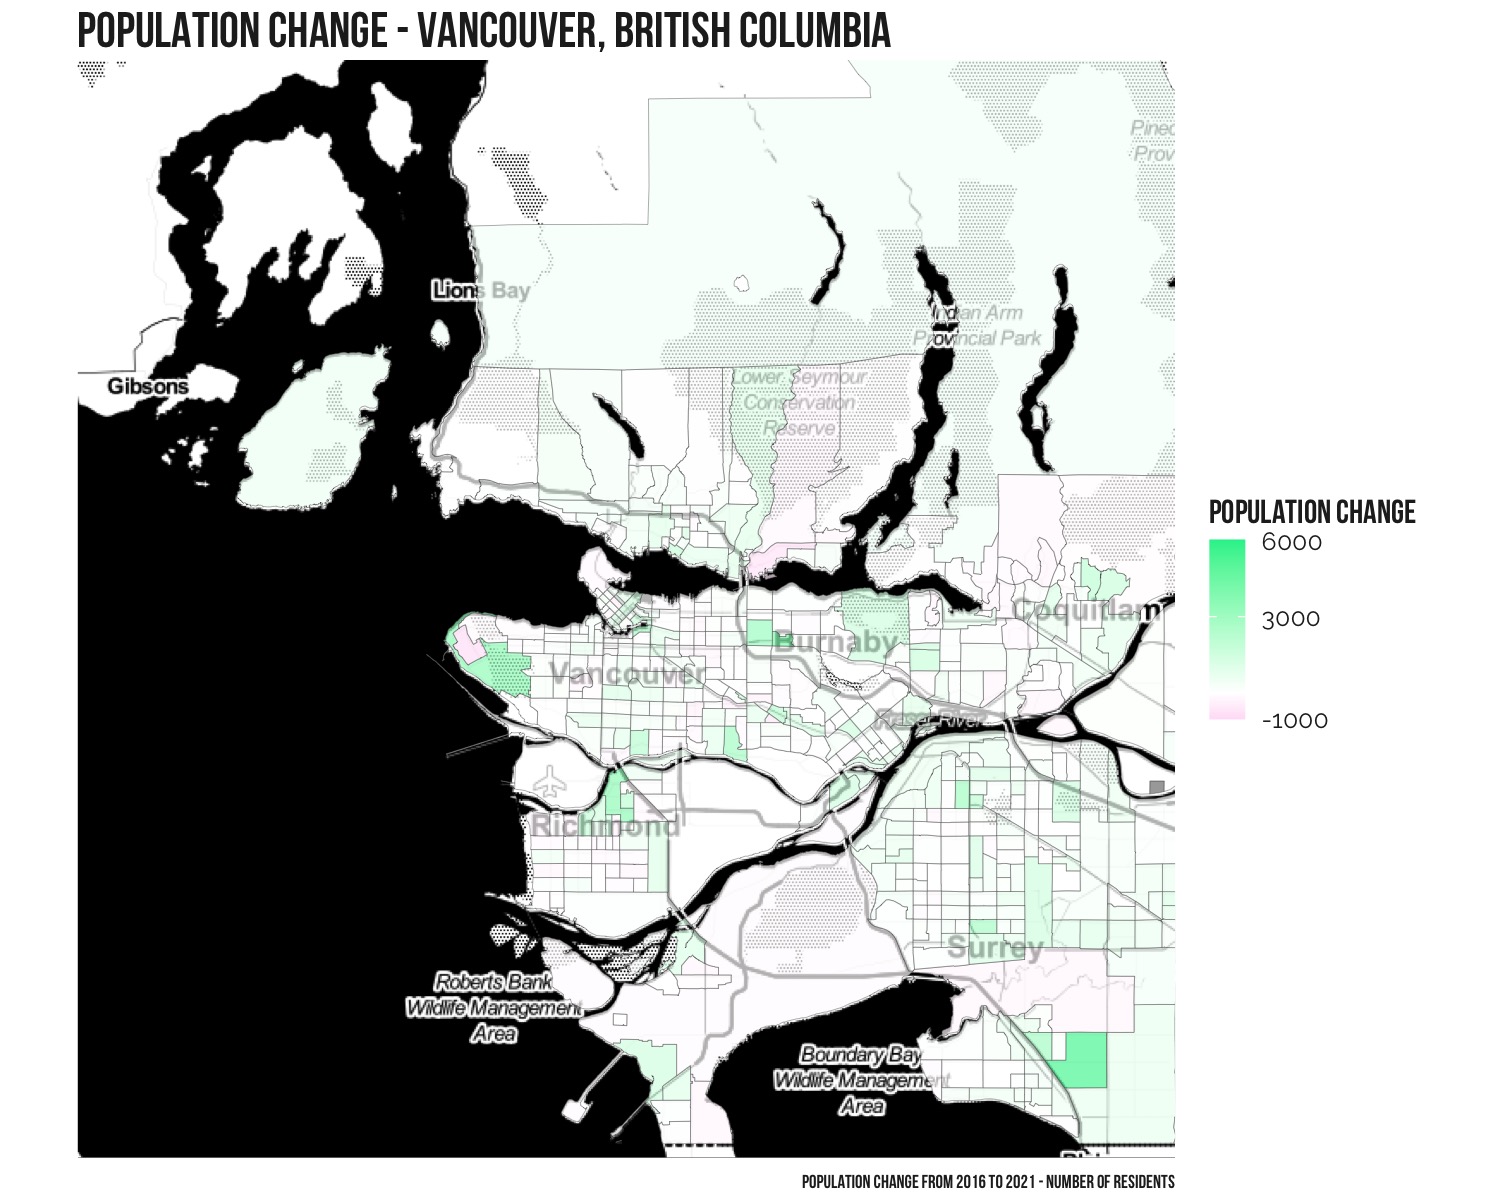
Greater Vancouver, which includes the city of Vancouver, saw the largest increase in population of 179,394 residents from 2,463,431 in 2016 to 2,642,825 in 2021 (7.3%).
High growth area #2
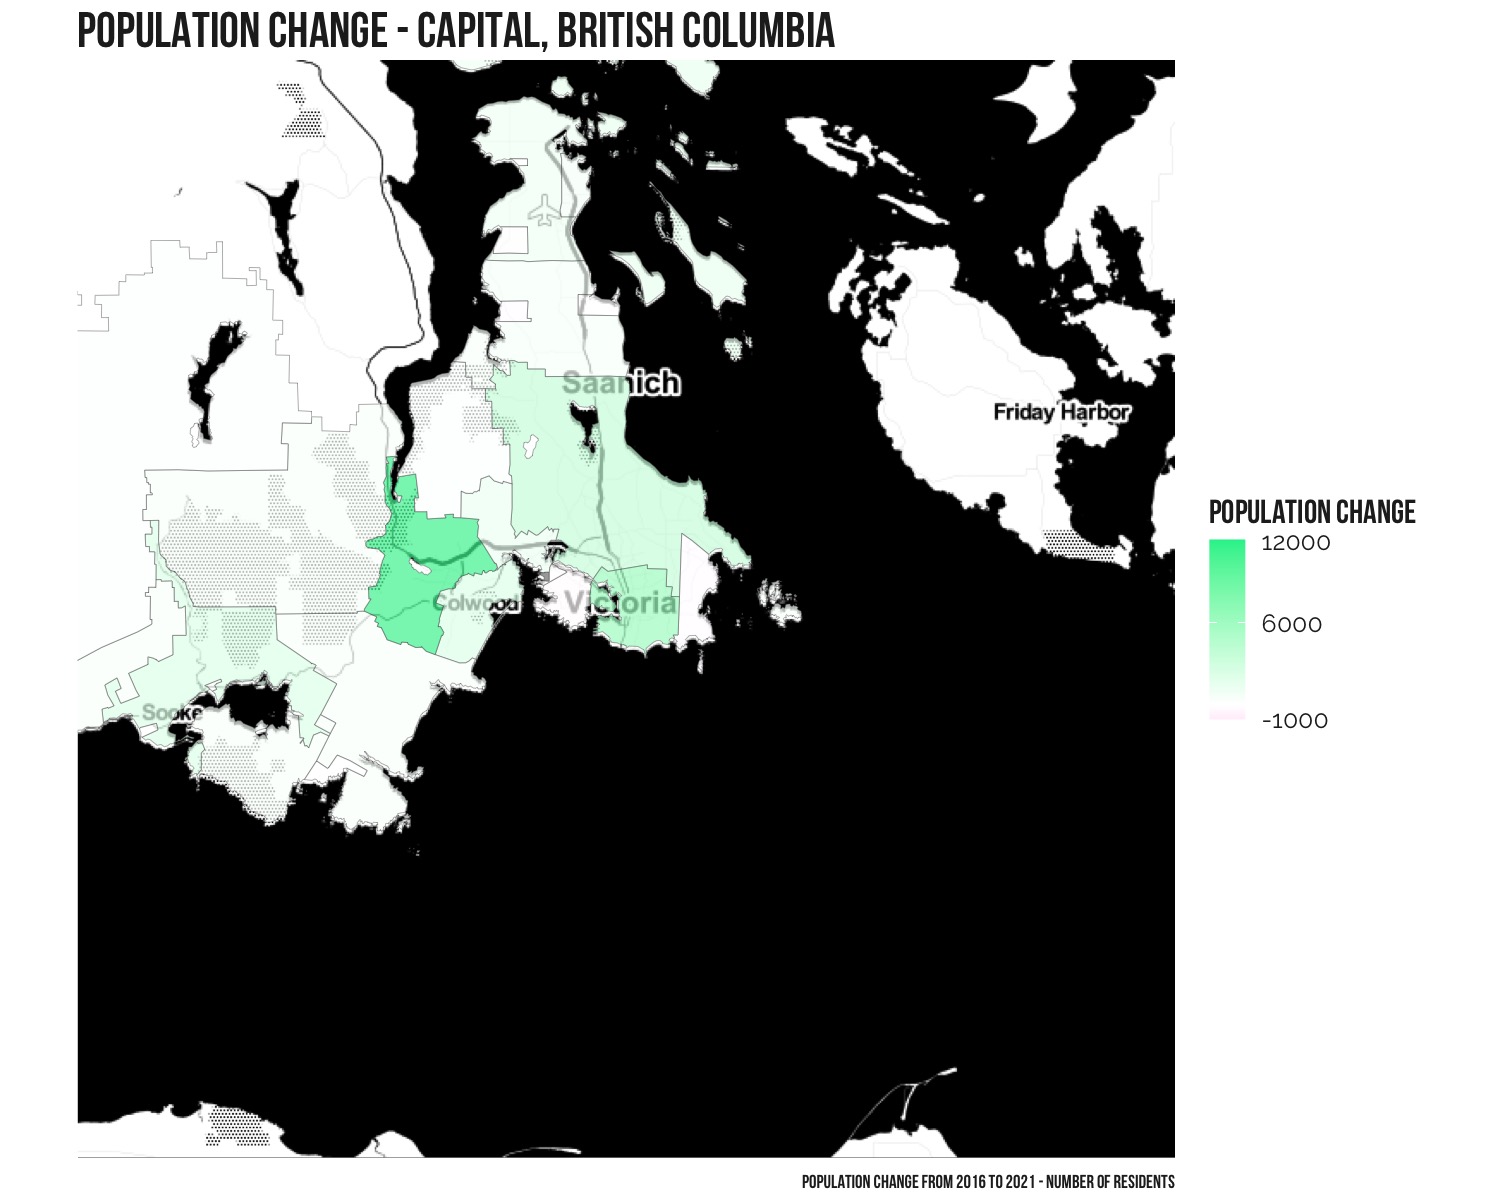
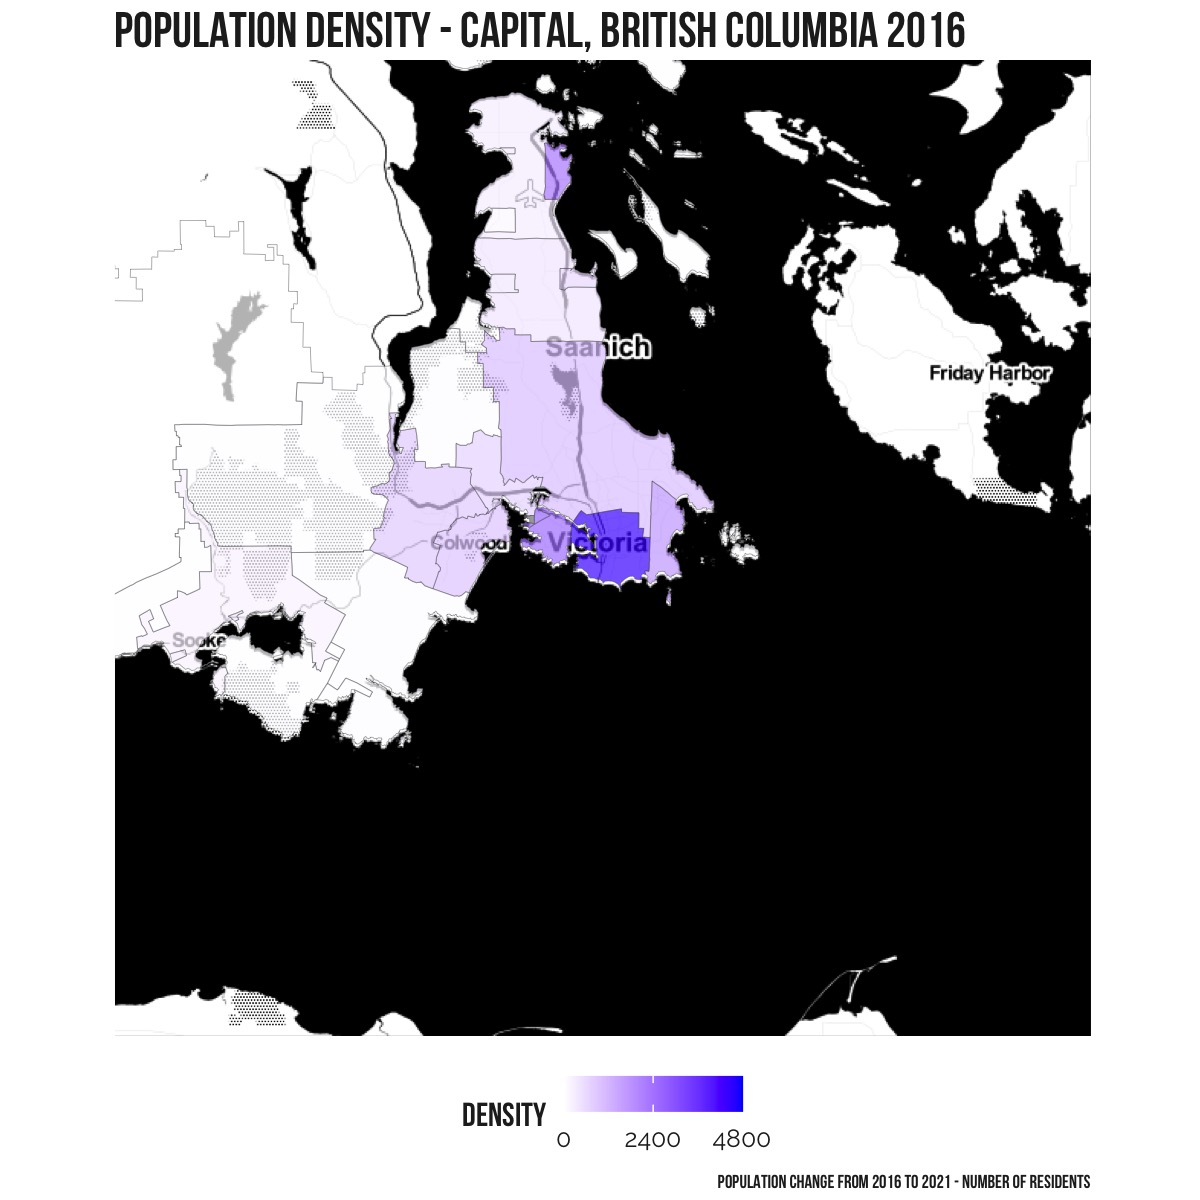
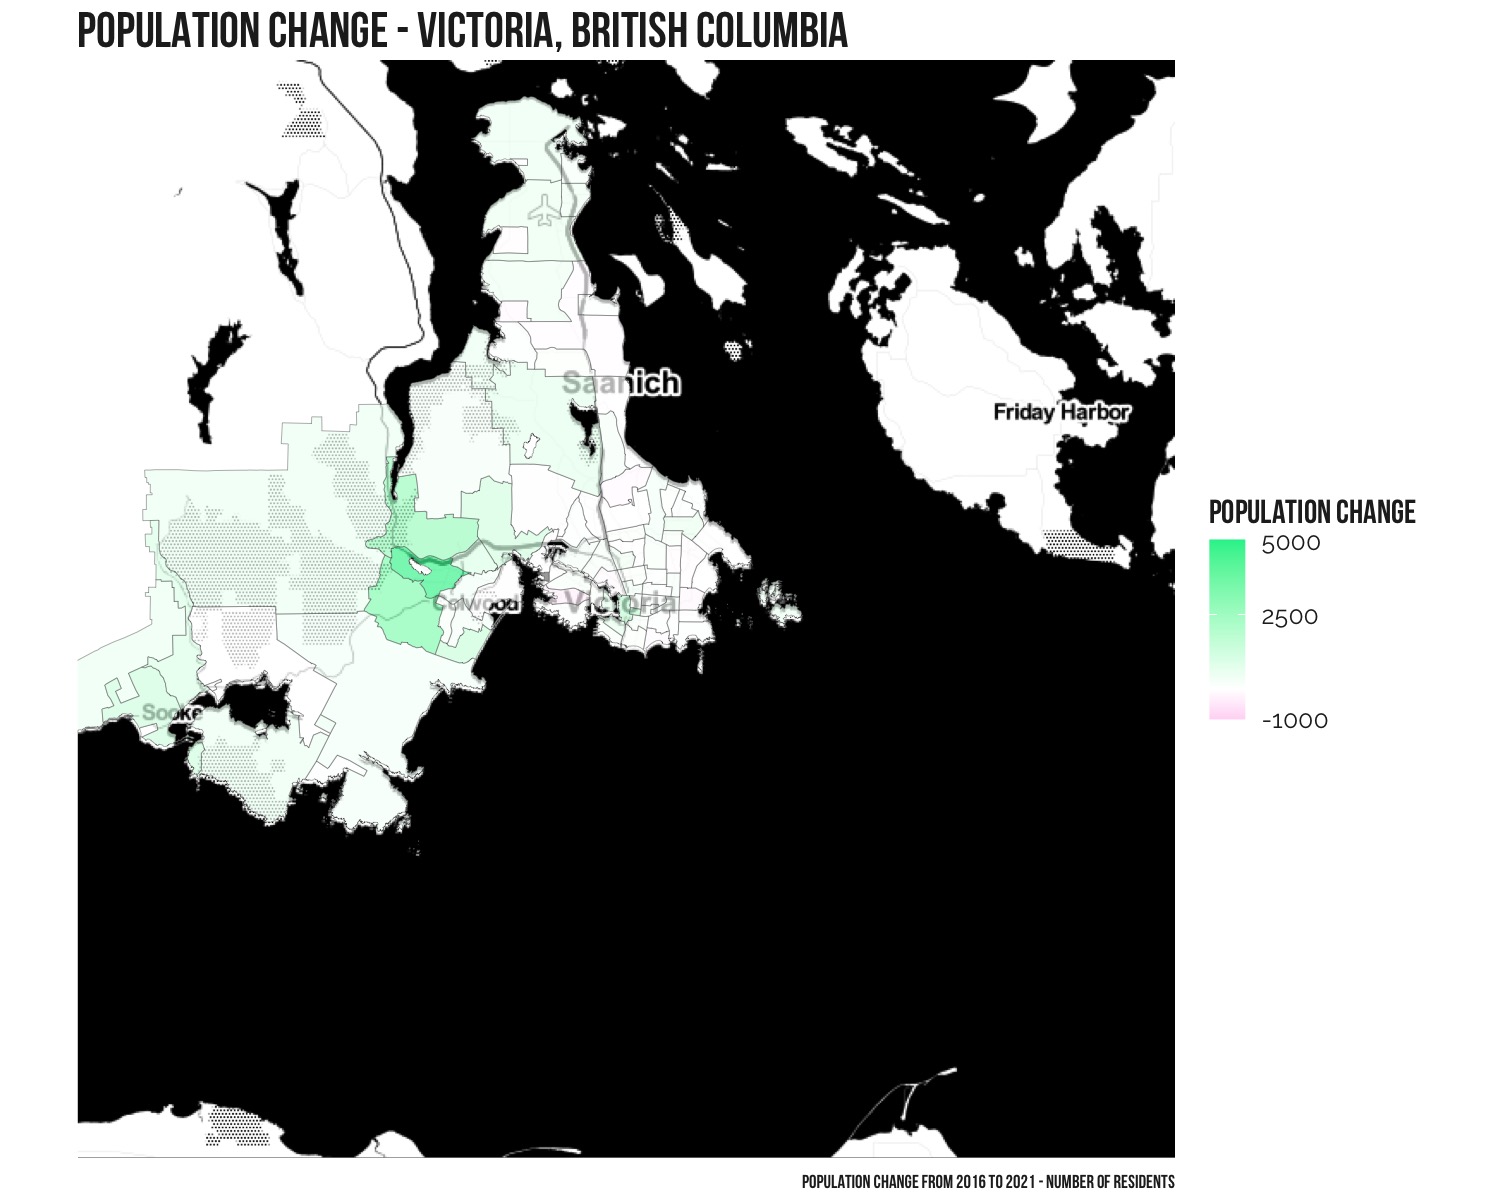
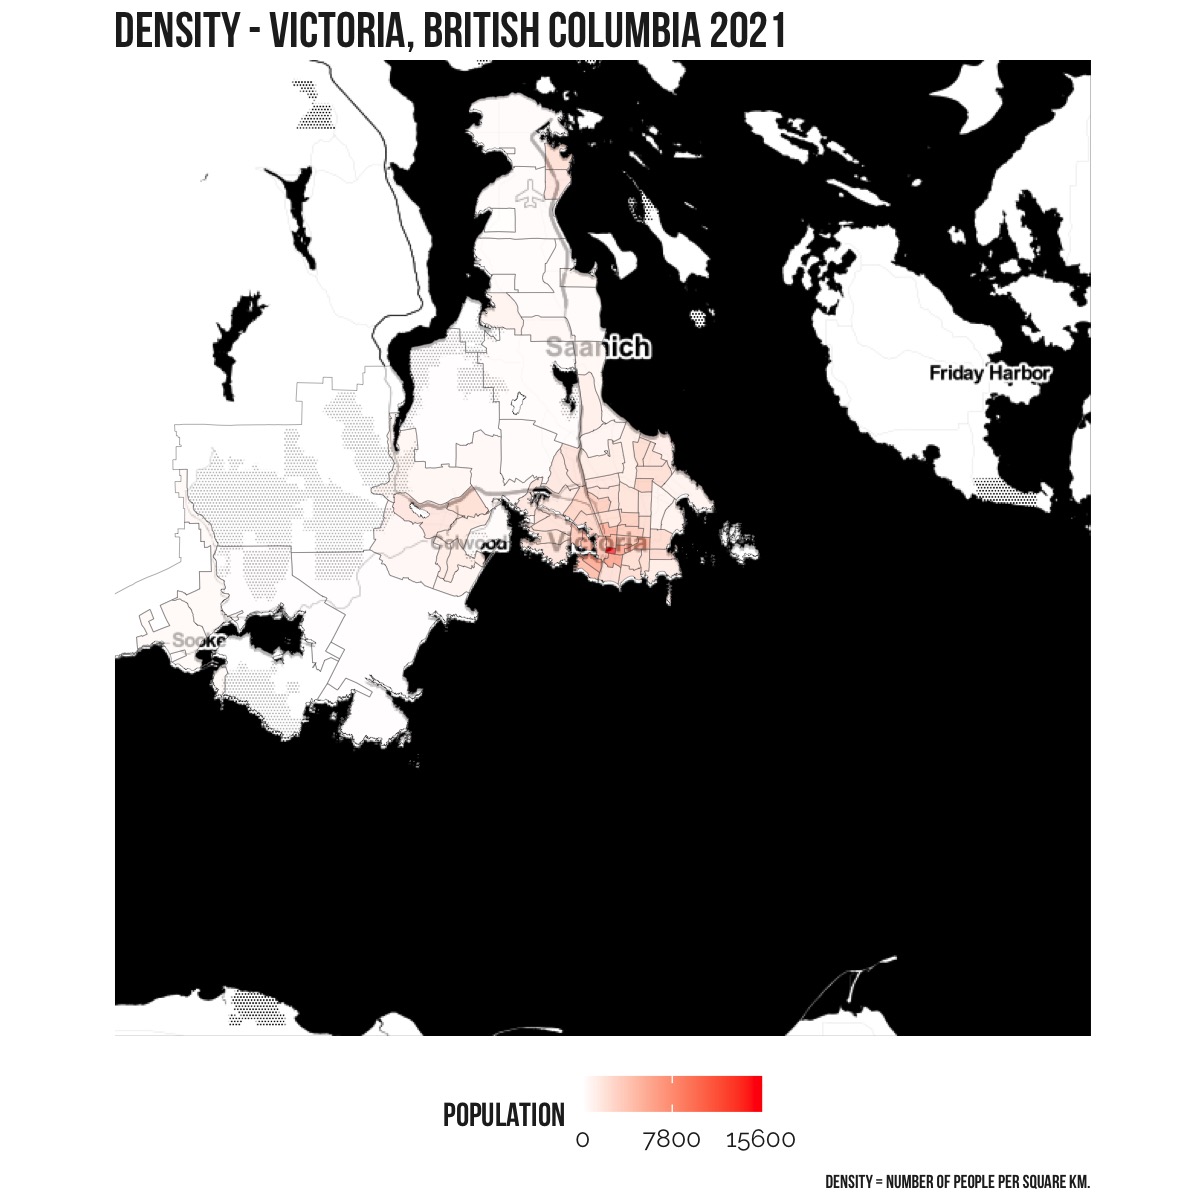
Capital, which includes the city of Victoria, saw the second largest increase in population of 32,091 residents from 383,360 in 2016 to 415,451 in 2021 (8.4%).
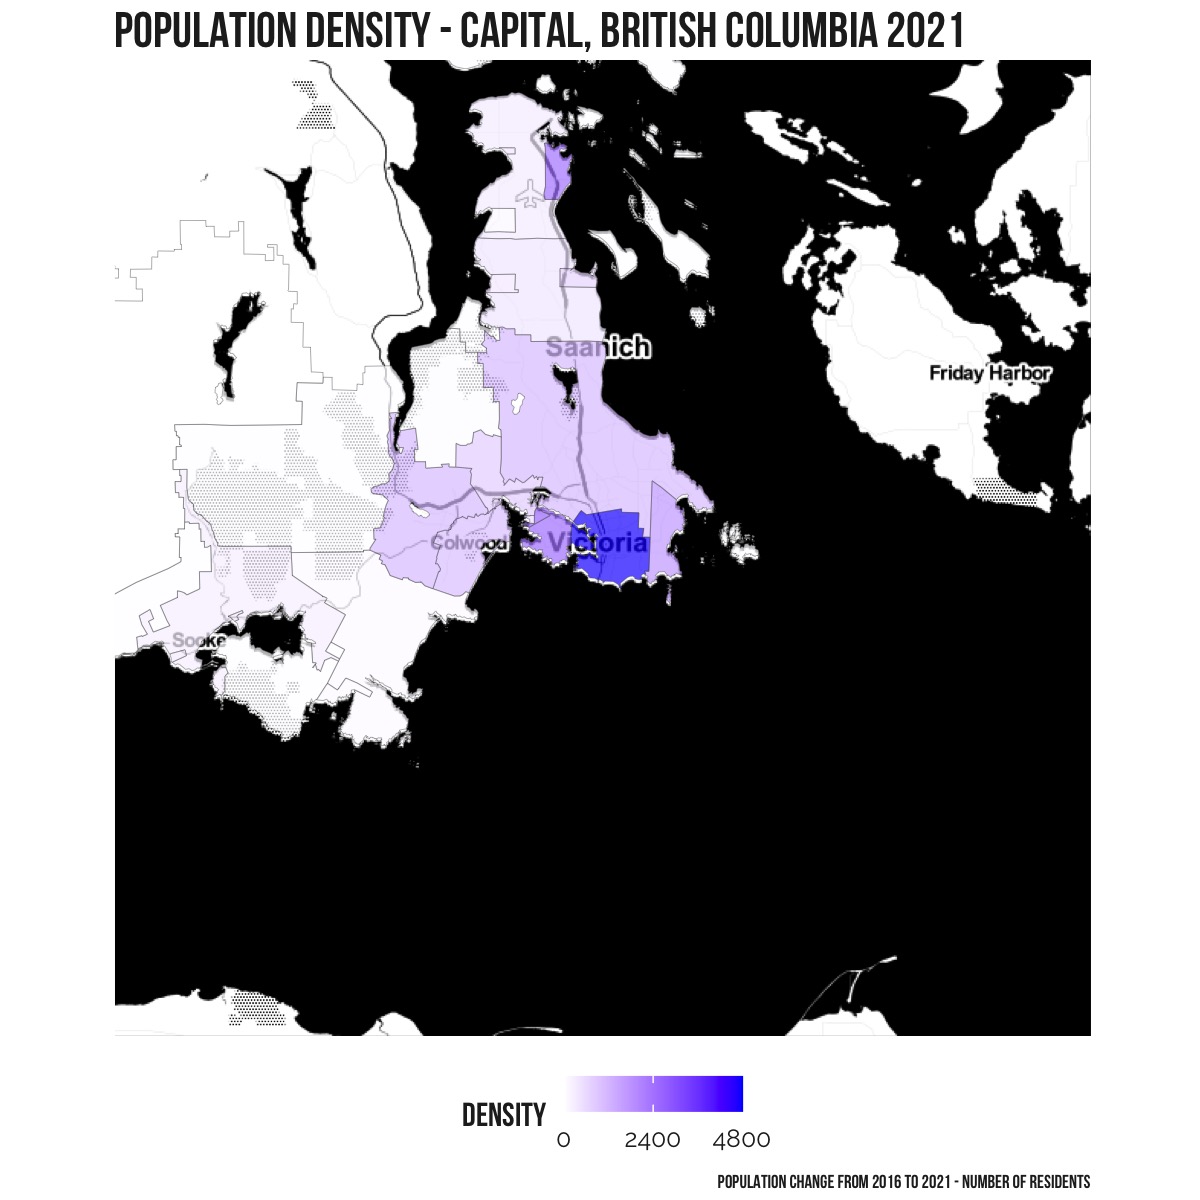
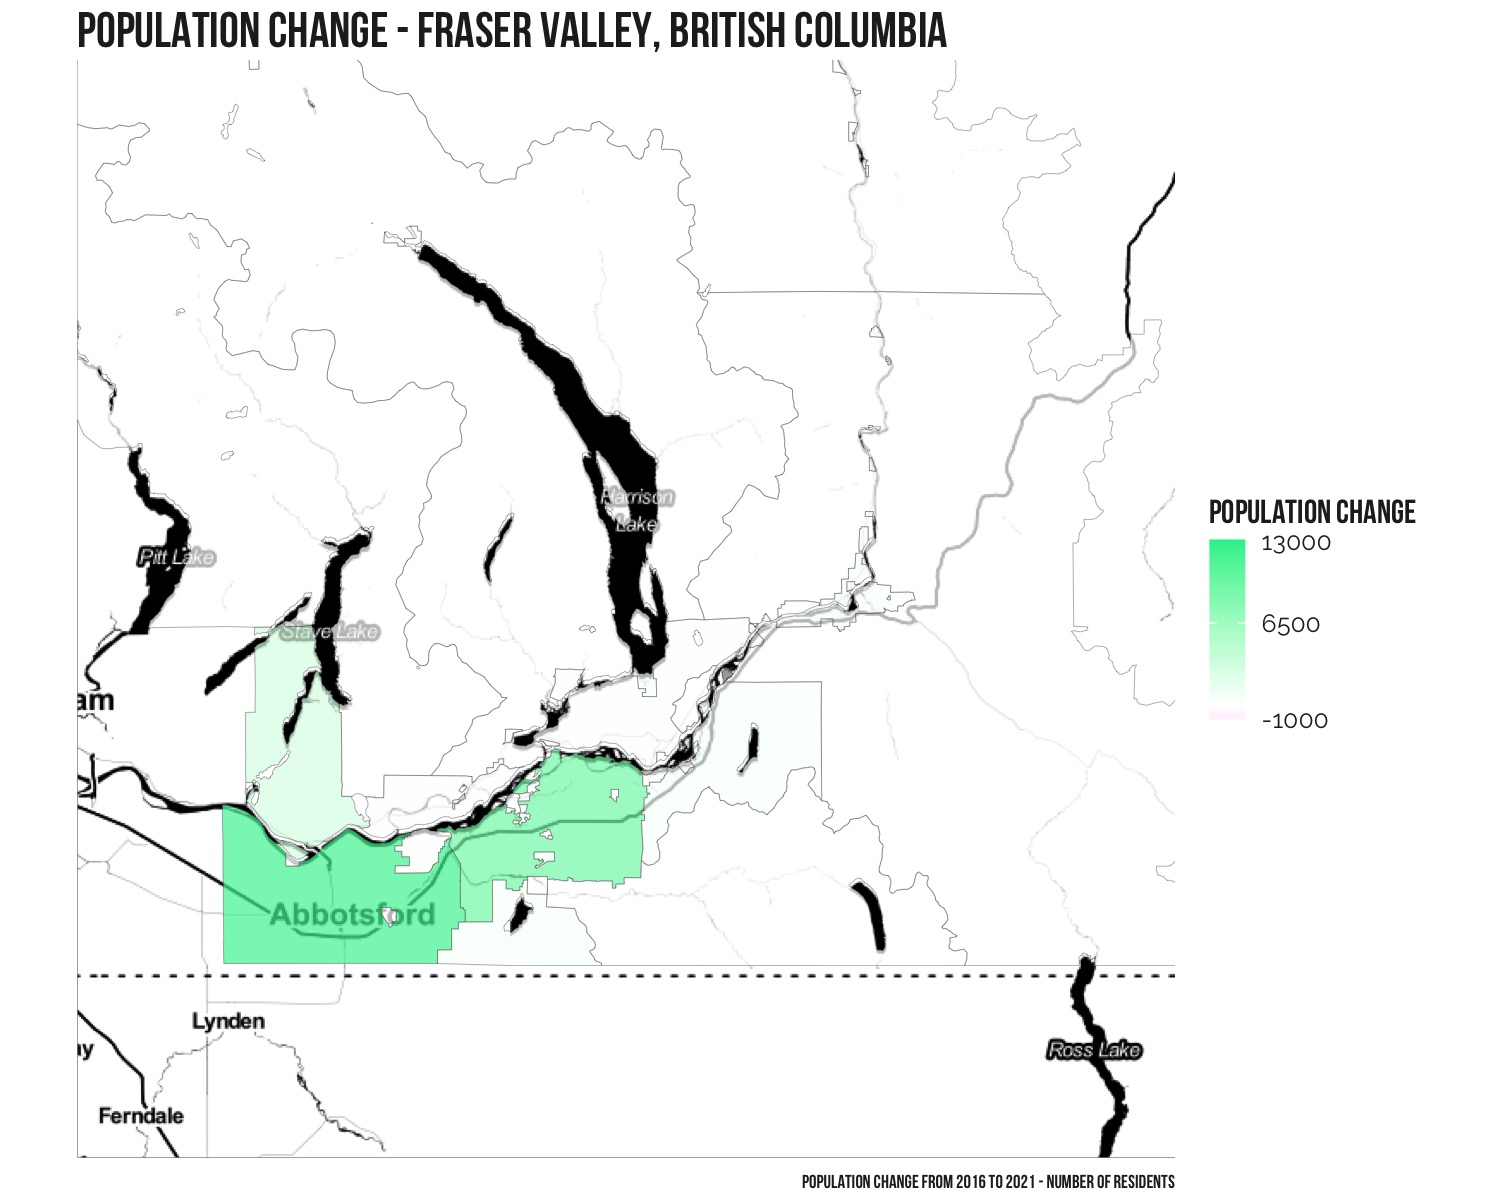
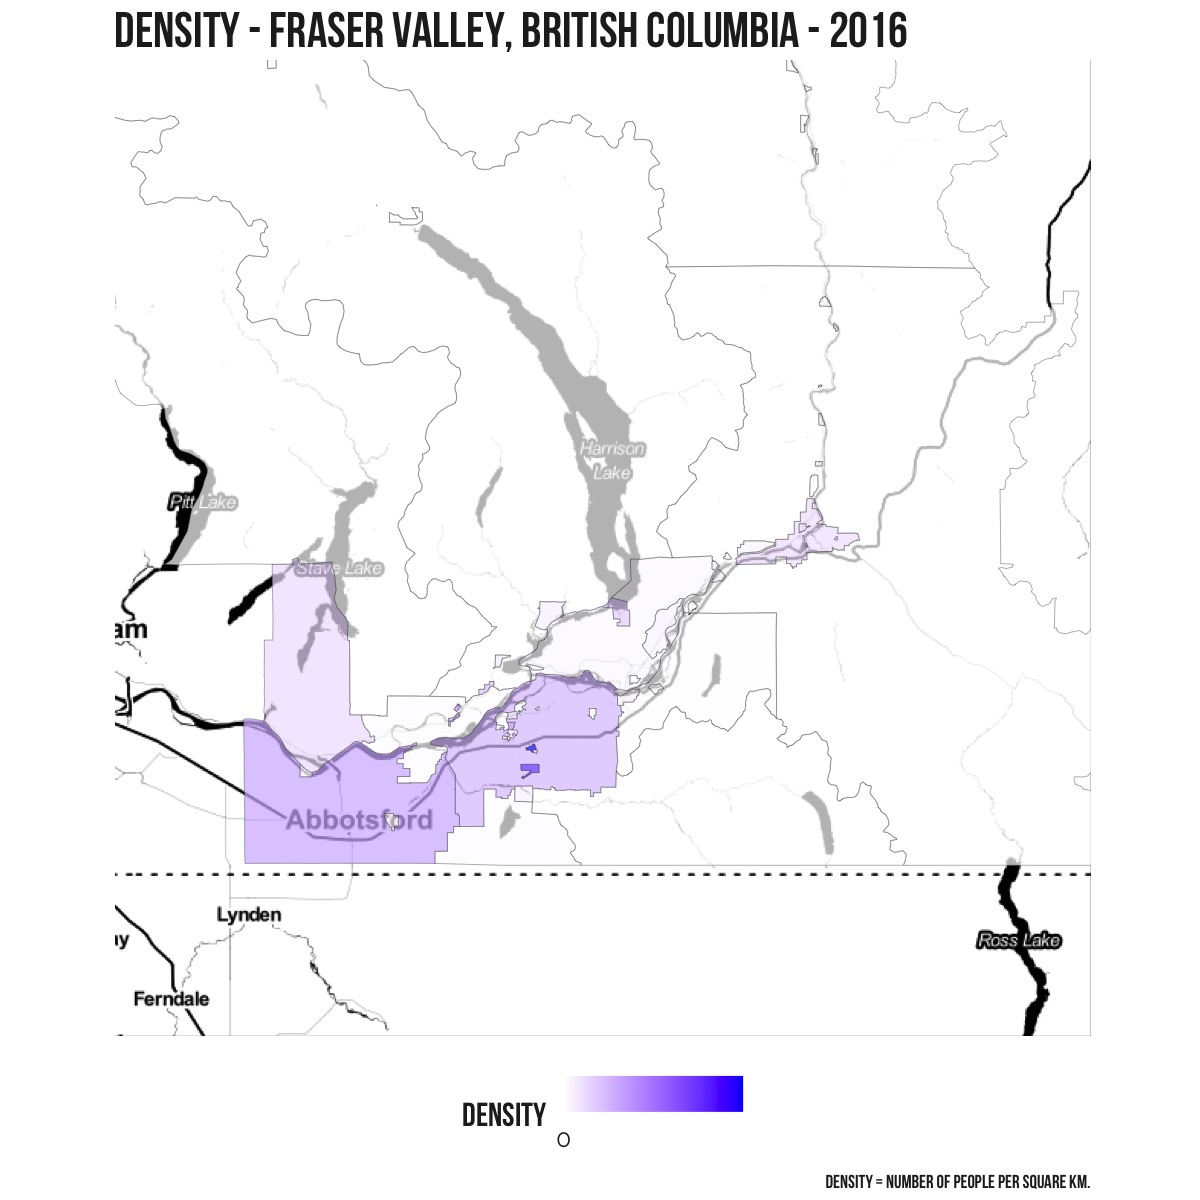
High growth area #3
Fraser Valley, which includes Abbotsford, saw the third largest increase in population of 28,071 residents from 295,934 in 2016 to 324,005 in 2021 (5.2%).

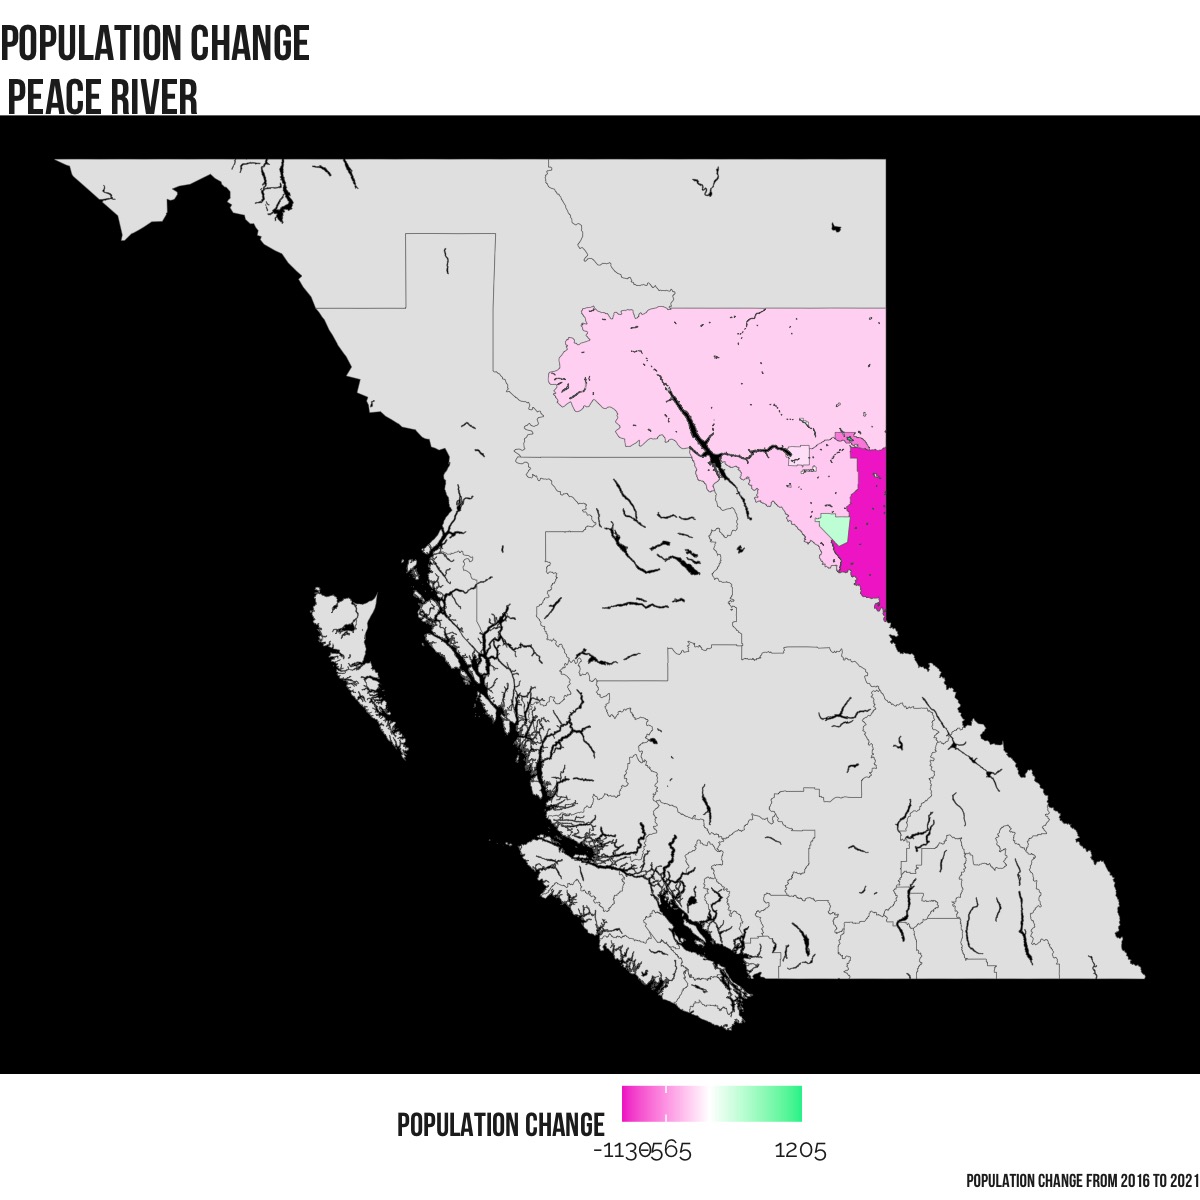
Which areas have seen the lowest growth?
5 of the 24 census divisions in BC saw a drop in population. The highest decline as a percentage was Northern Rockies with a drop of nearly 17% (915 residents). The highest absolute decline was Peace Rive with a decline of 1,410 residents, from 62,942 in 2016 to 61,532 in 2021.
Population changes in major cities
There are 28 census metropolitan areas in BC. Statistics Canada defines a census metropolitan area (CMA) as “…one or more adjacent municipalities centred on a population centre (known as the core). A CMA must have a total population of at least 100,000 of which 50,000 or more must live in the core.”
Vancouver is the largest with an overall population of 2,642,825, followed by Victoria with 397,237.
CMA – Vancouver
The census metropolitan area (CMA) of Vancouver grew by 179,394 residents from 2,463,431 in 2016 to 2,642,825 in 2021.

CMA – Victoria
The census metropolitan area (CMA) of Victoria grew by 29,467 residents from 367,770 in 2016 to 397,237 in 2021.

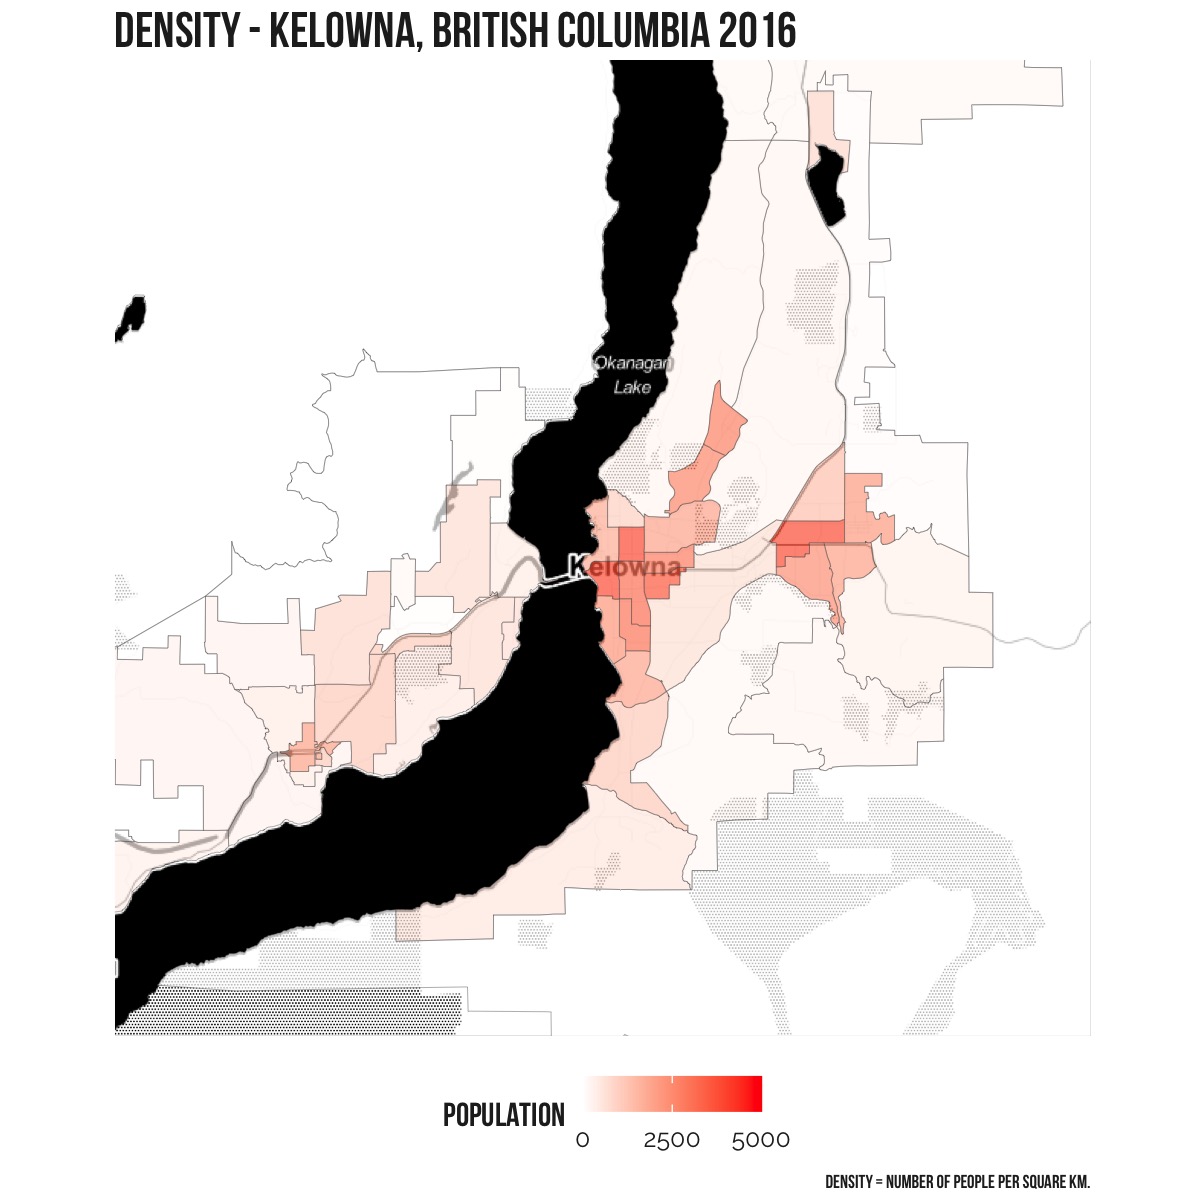
CMA – Kelowna
The census metropolitan area (CMA) of Kelowna grew by 27,270 residents from 194,892 in 2016 to 222,162 in 2021.

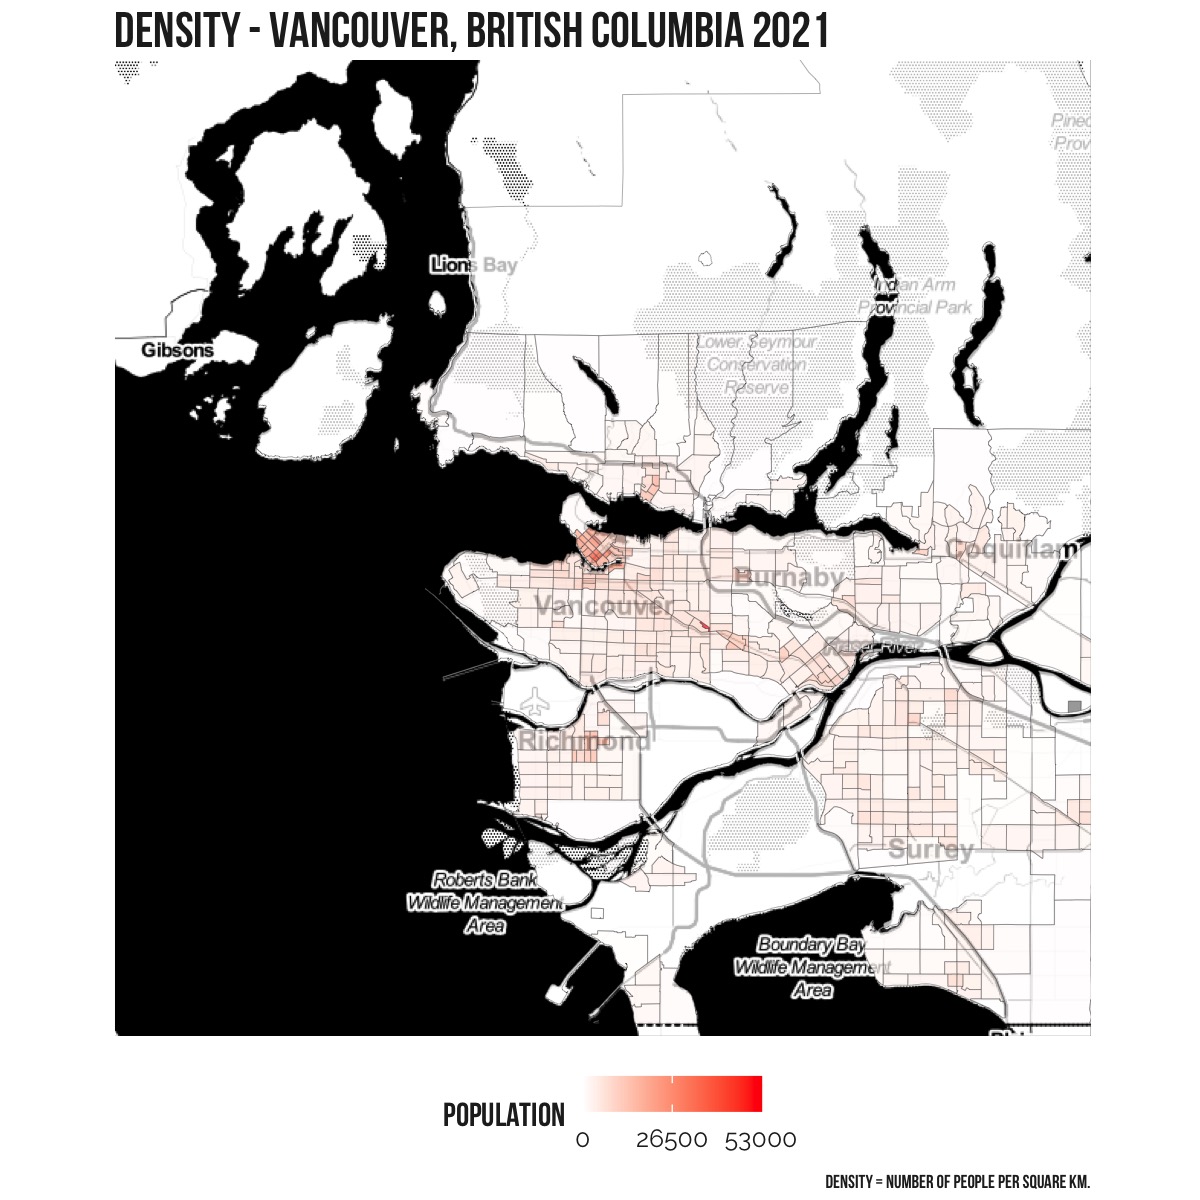
Overall population density