The 2021 census has been released and that means it is time to dive right into some population trends. Canadian population numbers have changed substantially between 2016 and 2021 and this post will go into more detail about Alberta. You can also read more about the population changes in Nova Scotia, New Brunswick, Newfoundland, PEI, Quebec, Ontario, Manitoba, and Saskatchewan.
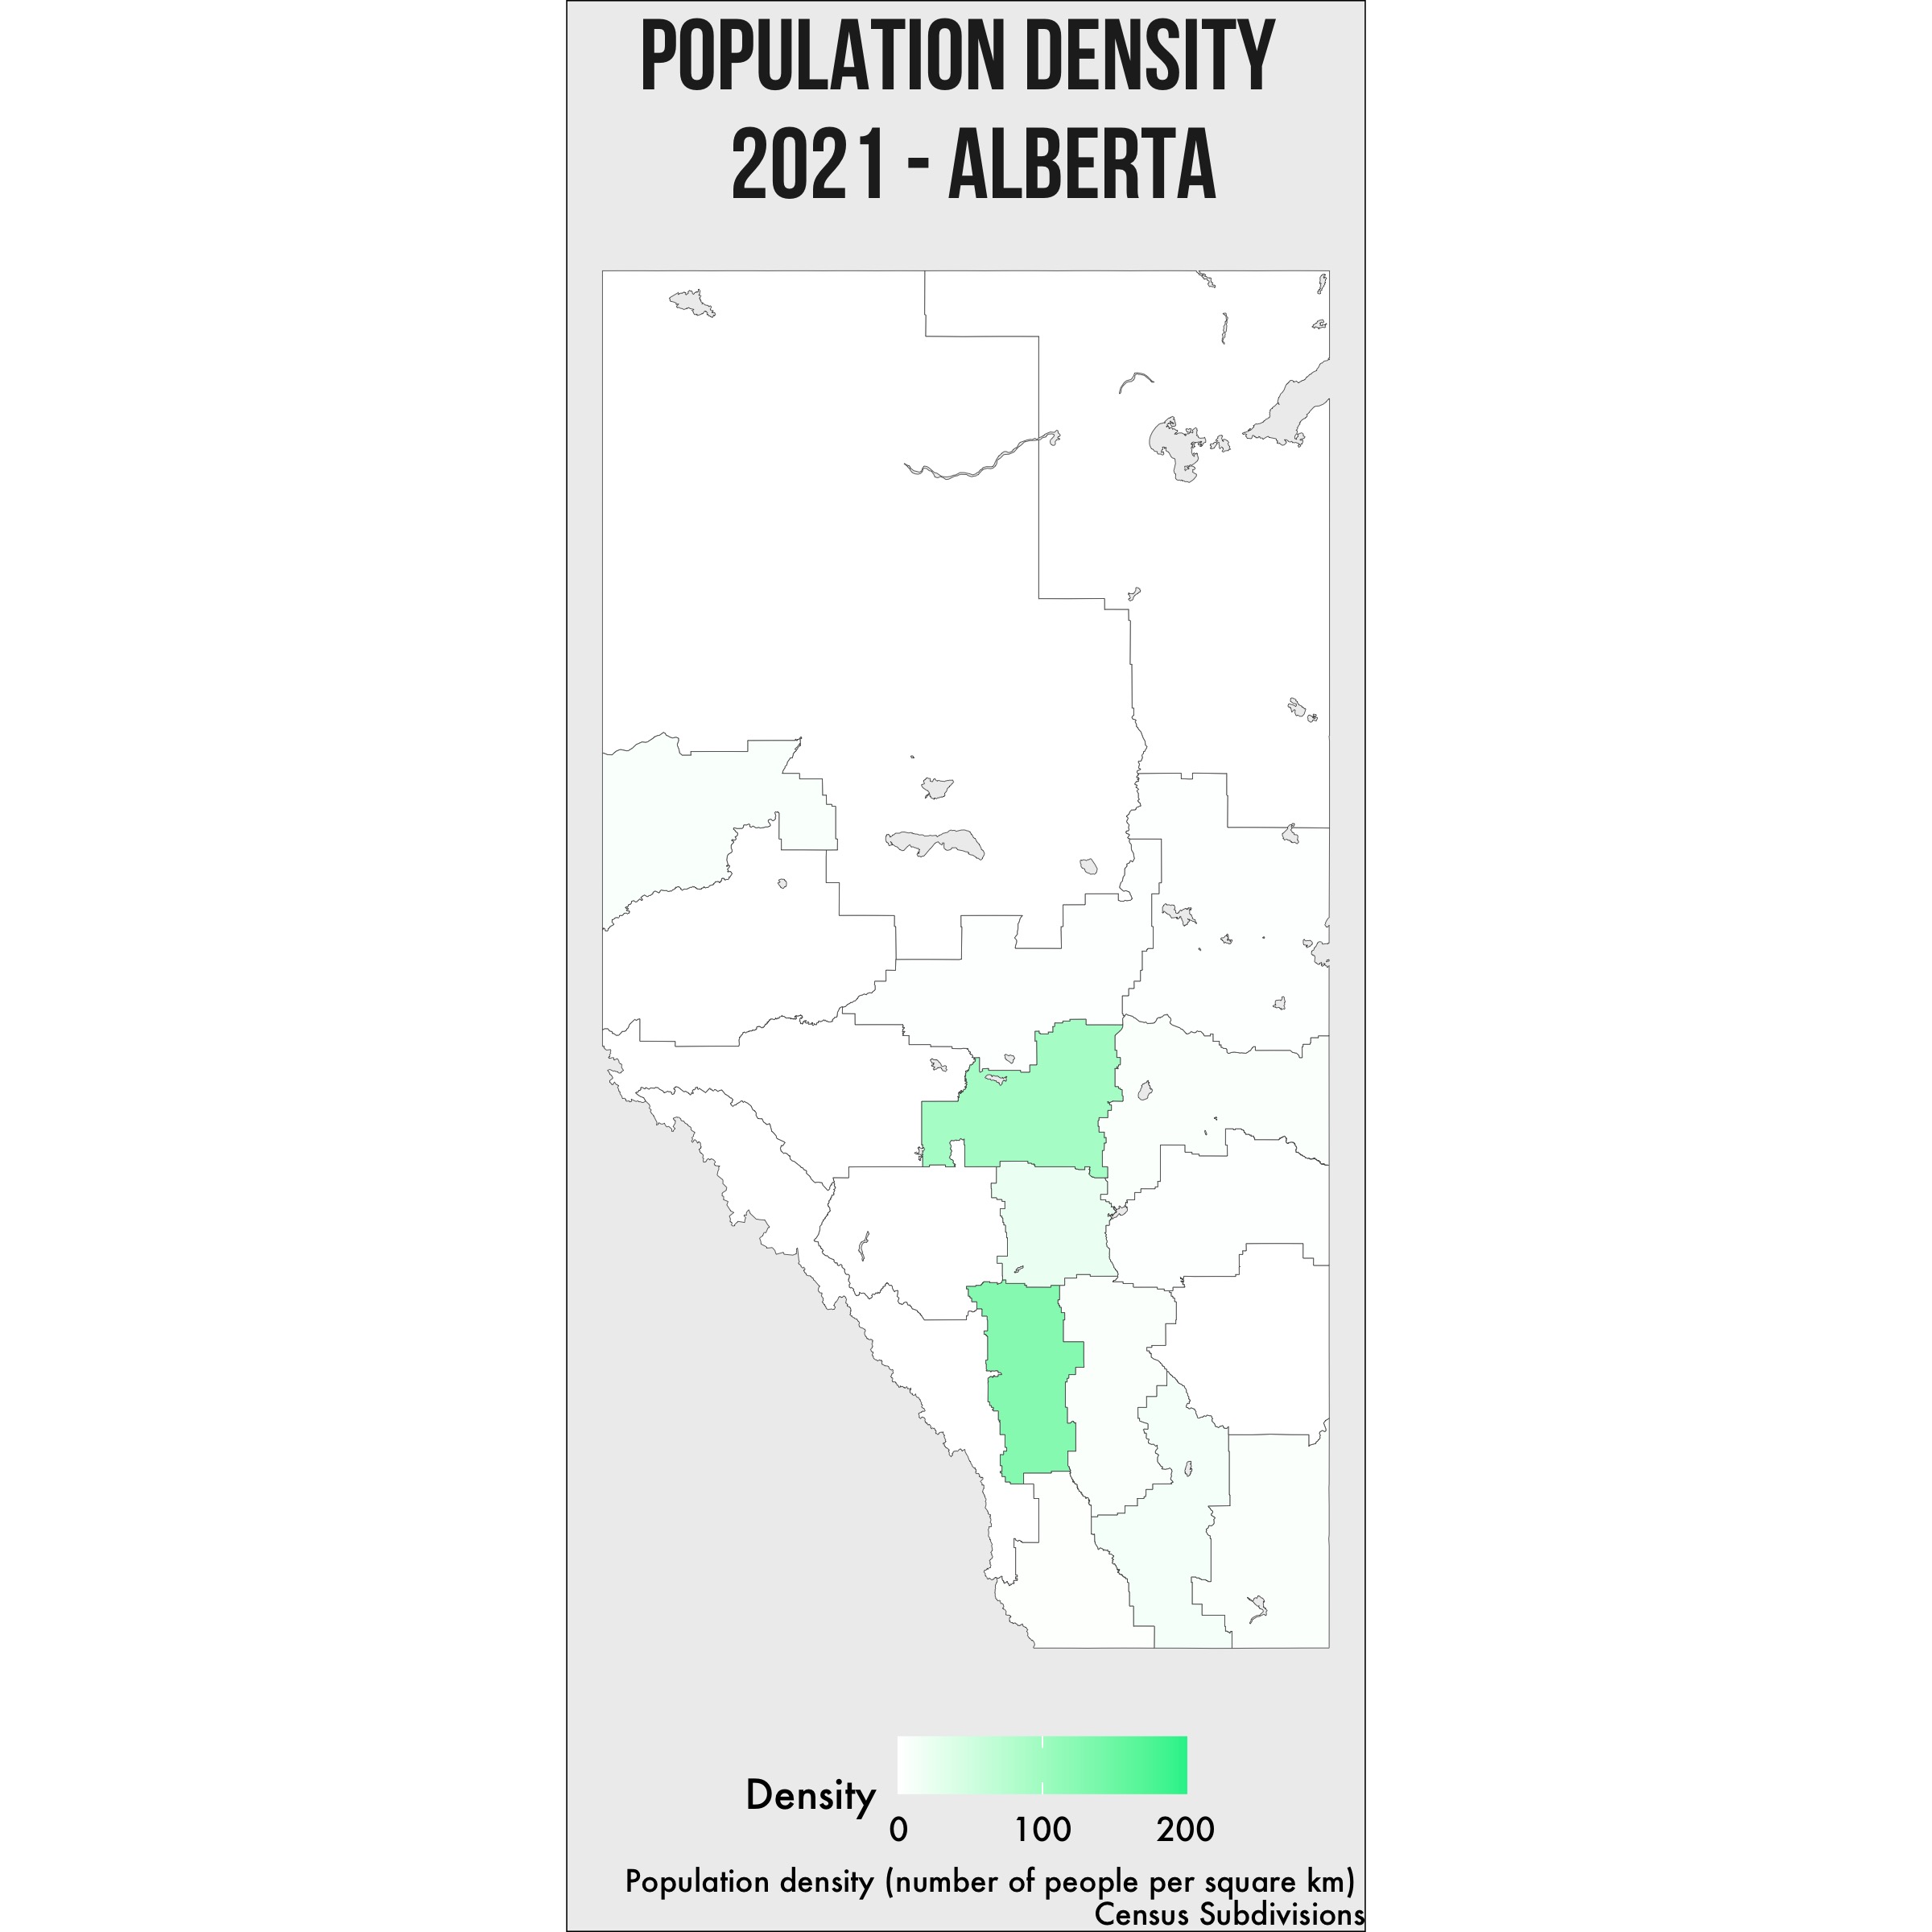
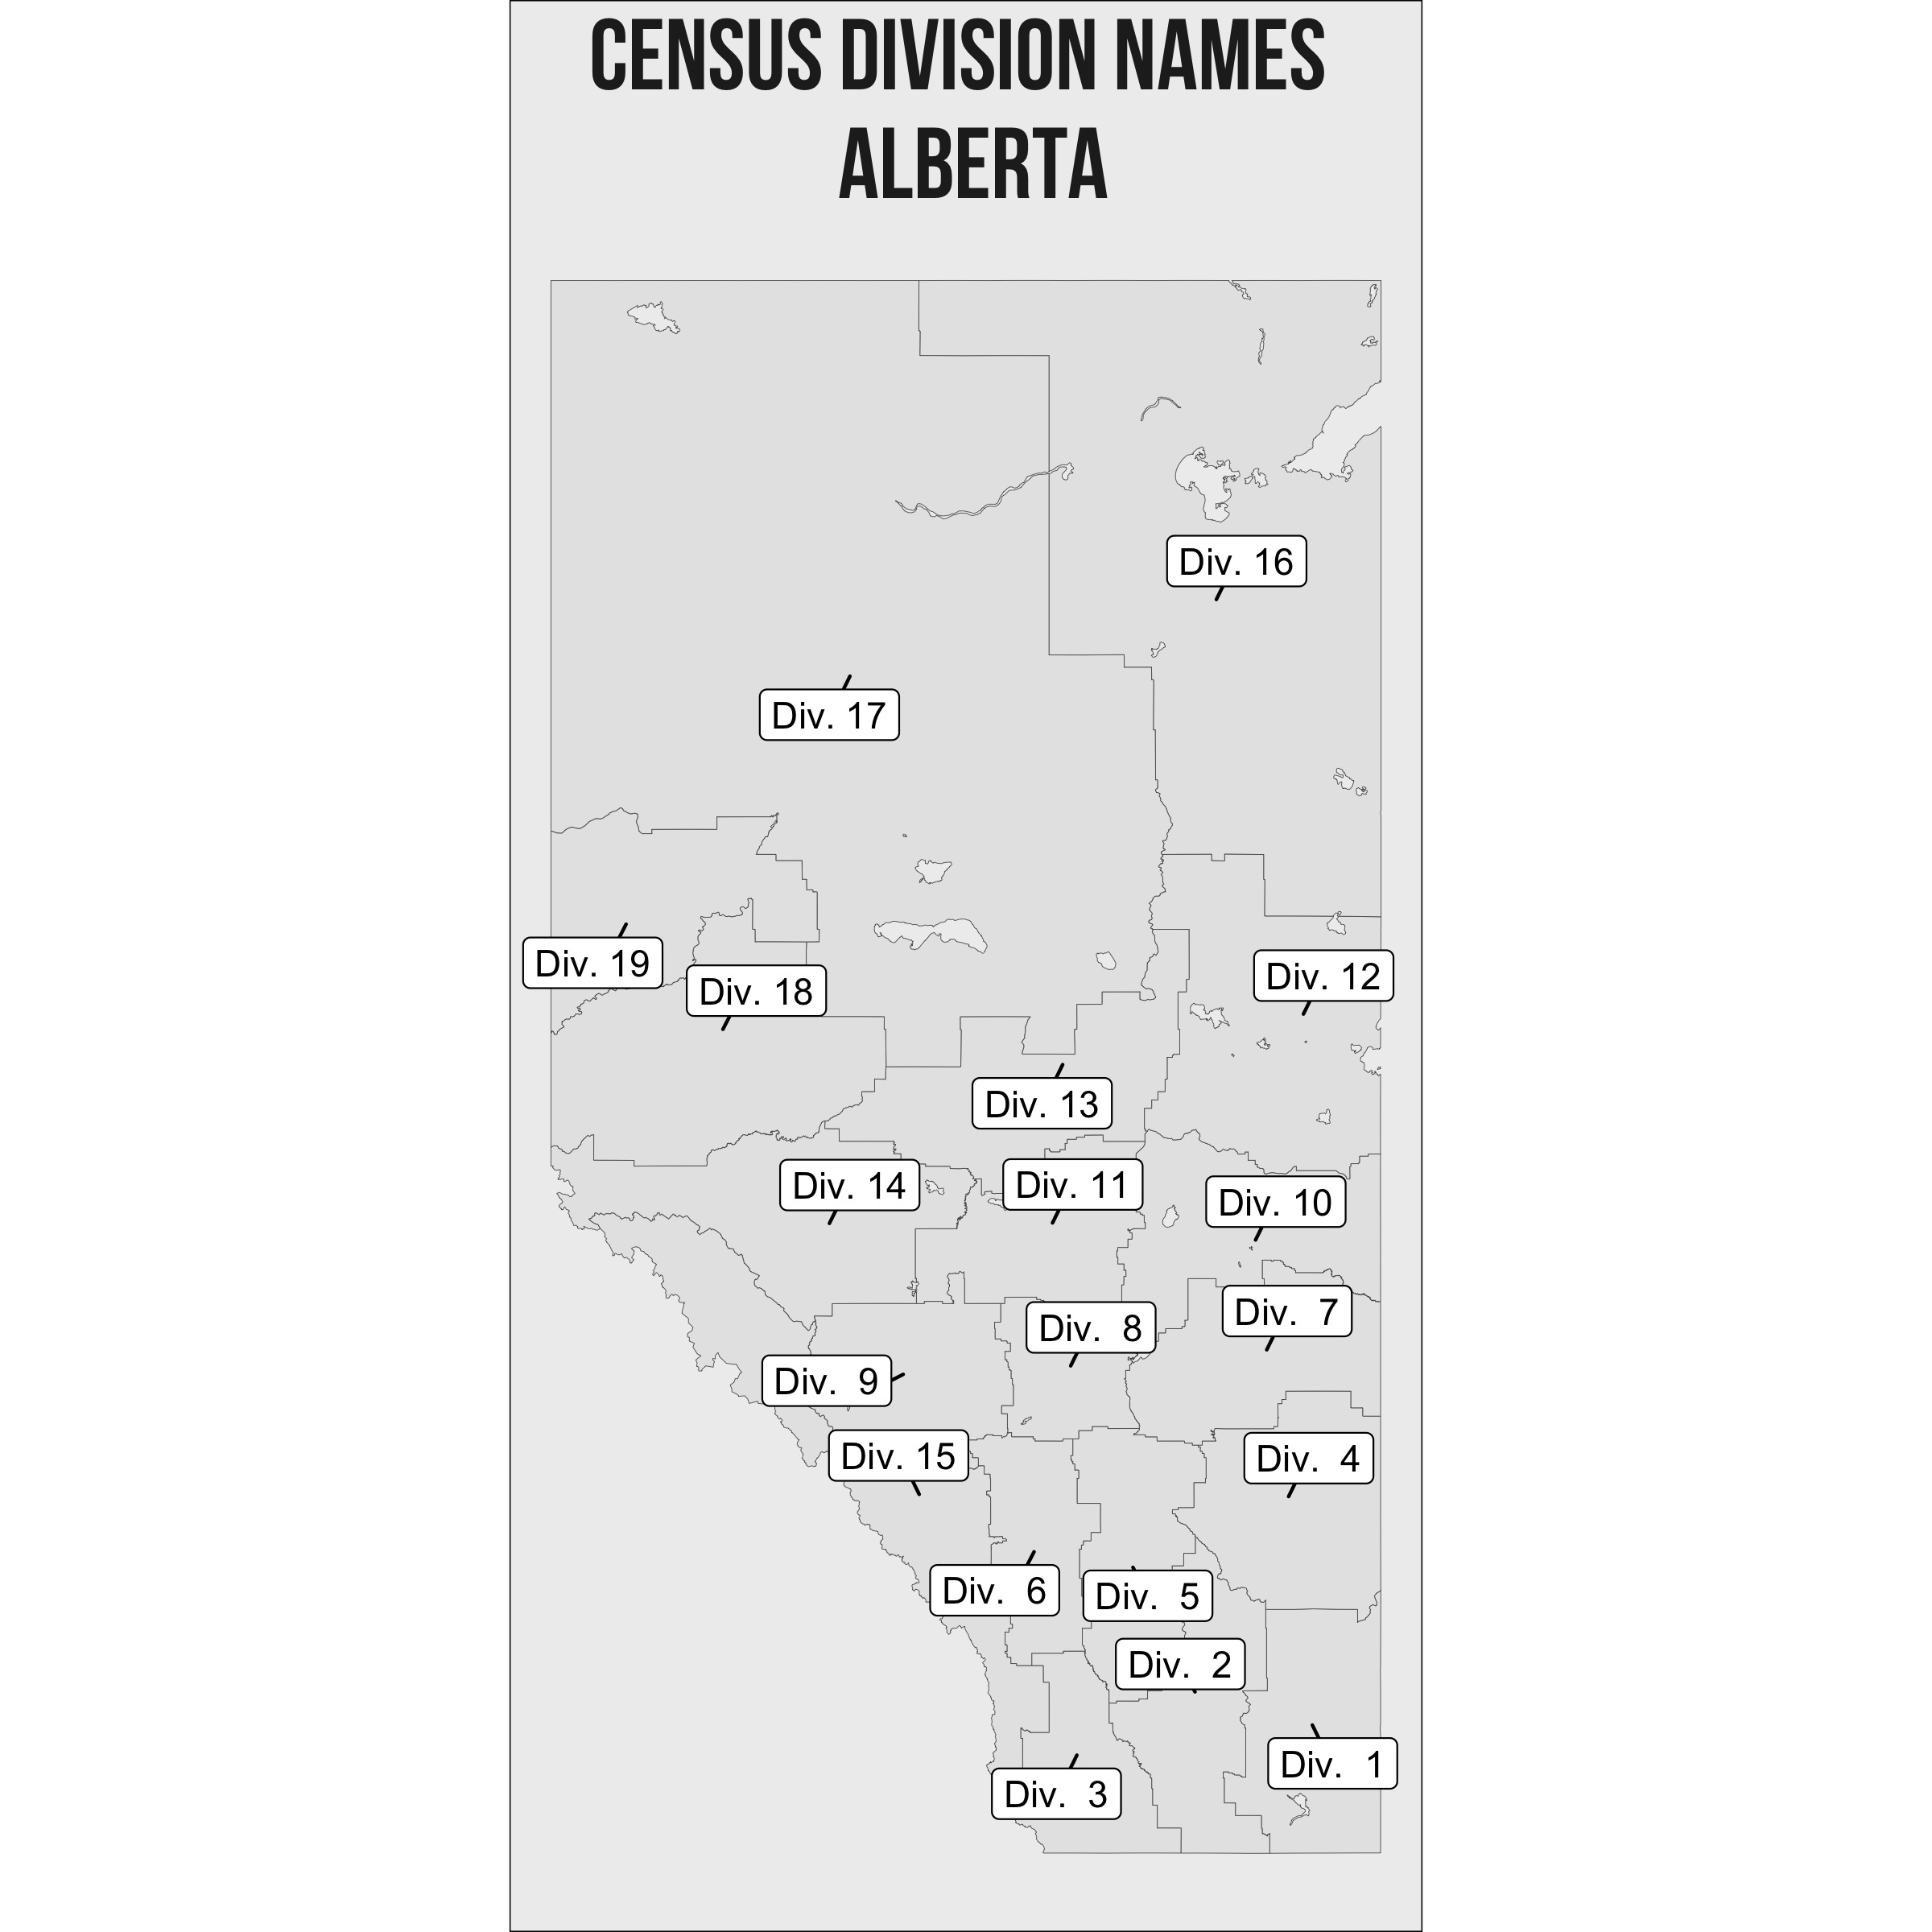
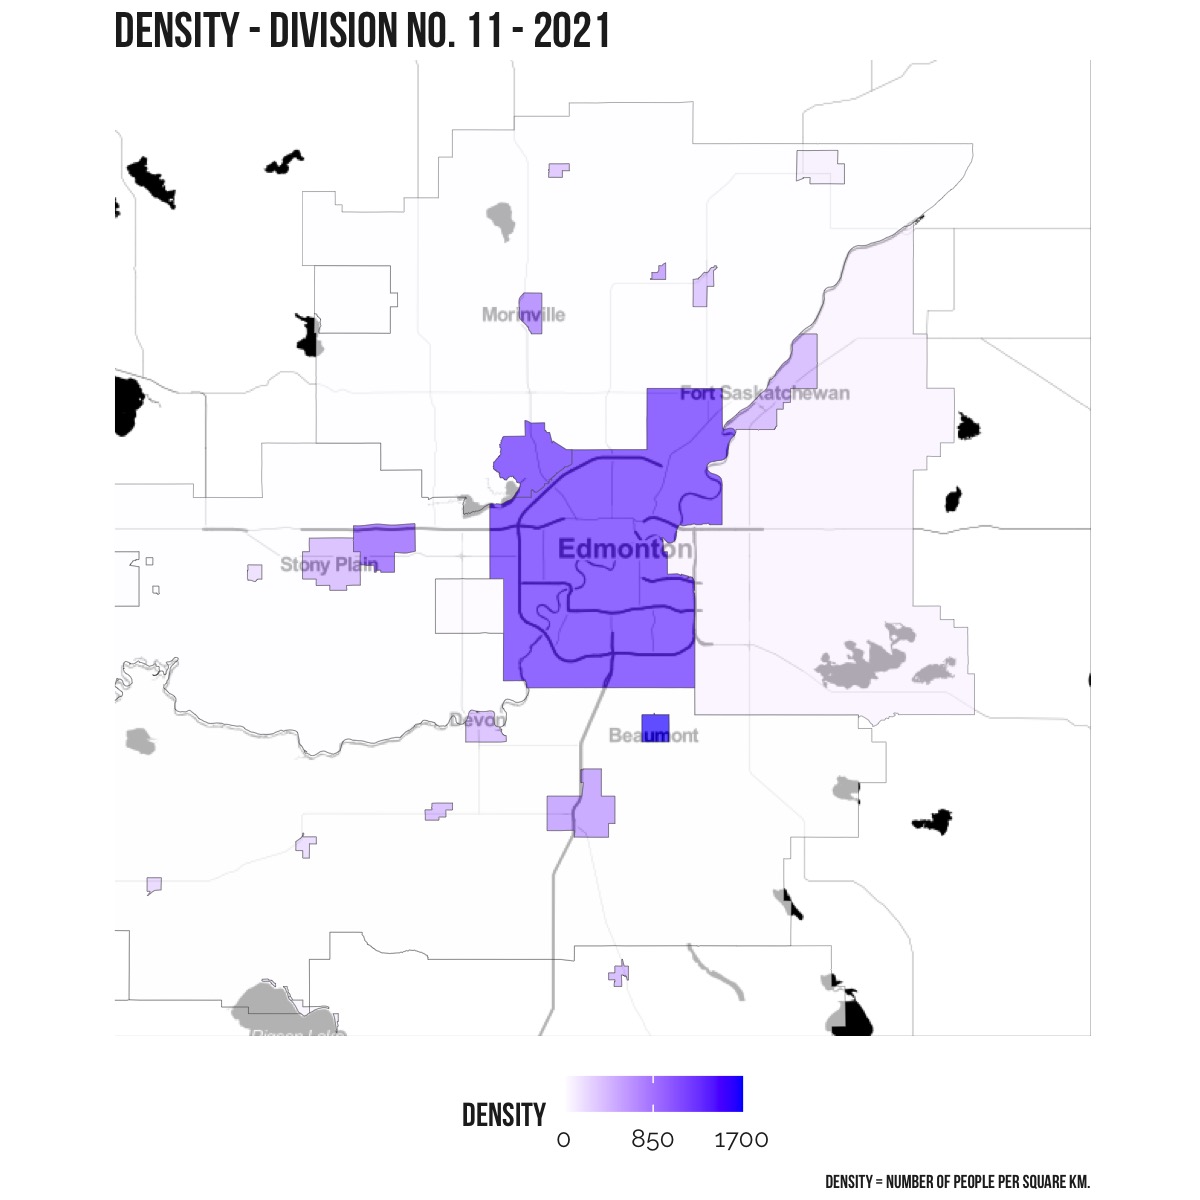
There are 19 different census division in Alberta. A census division is defined by Statistics Canada as a “group of neighbouring municipalities joined together for the purposes of regional planning and managing common services”. The boundaries and population density of each of those 19 census divisions is shown on the map above, and the names are displayed on the map to the right.
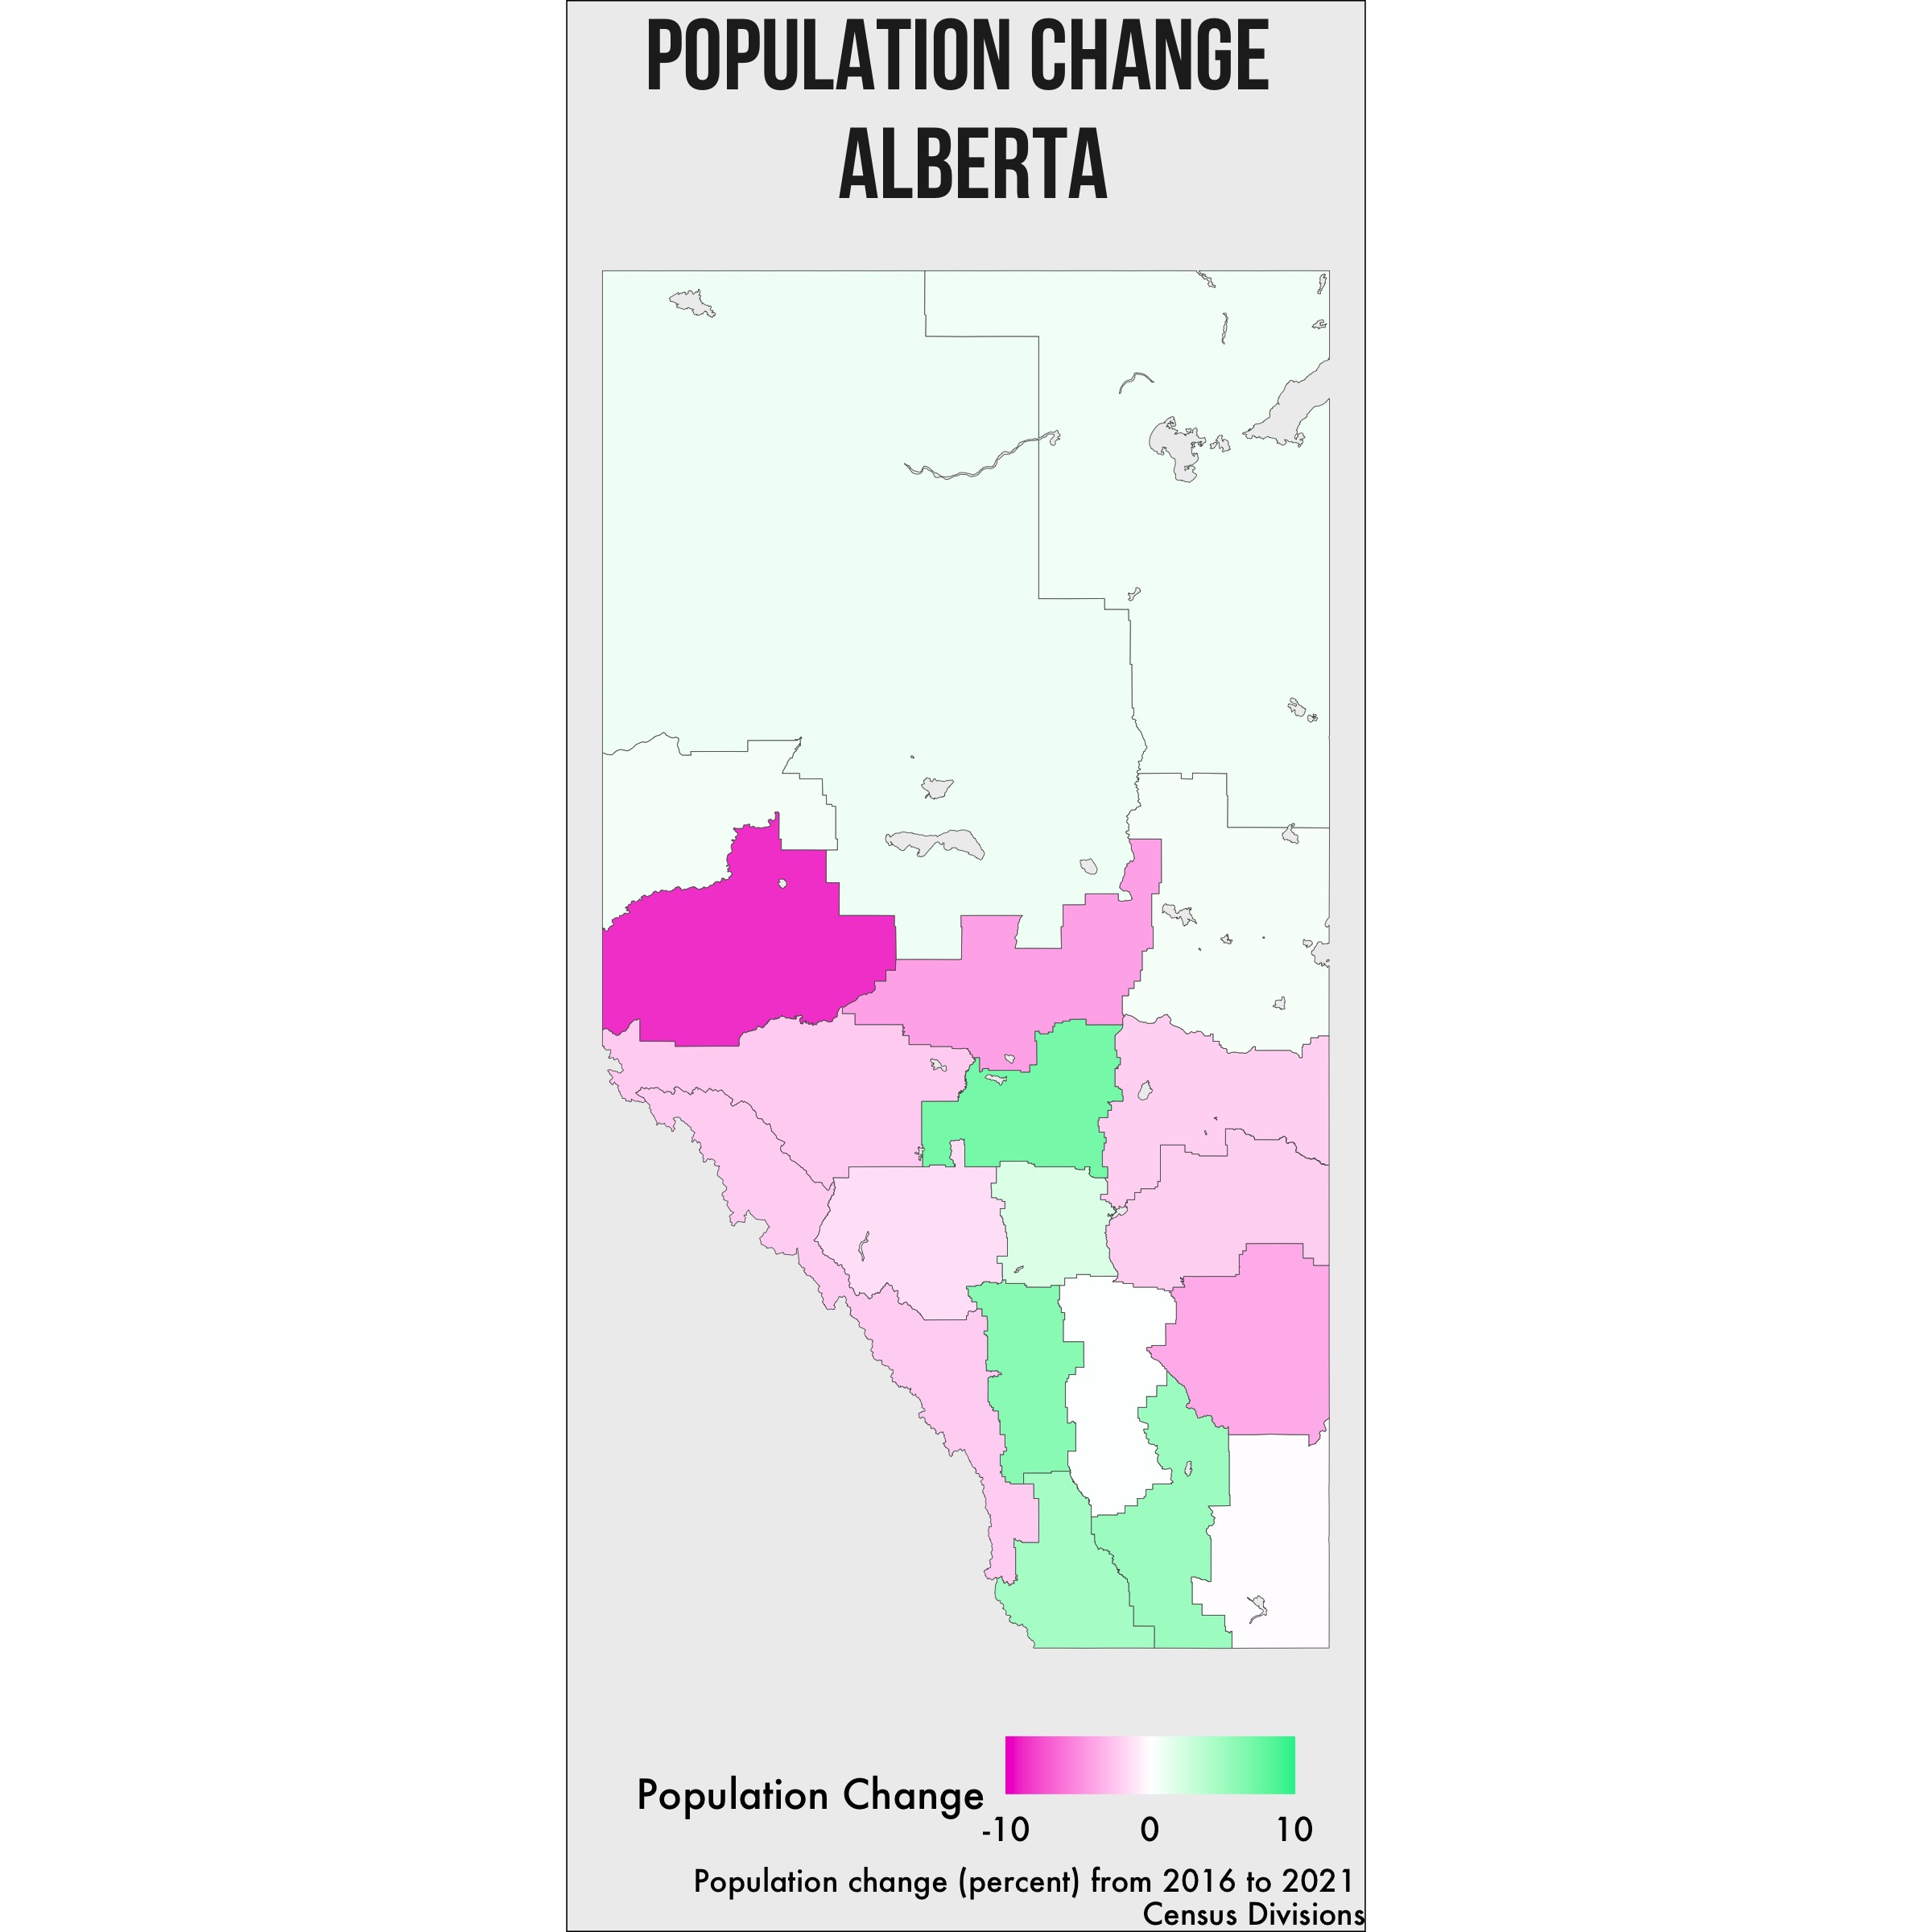
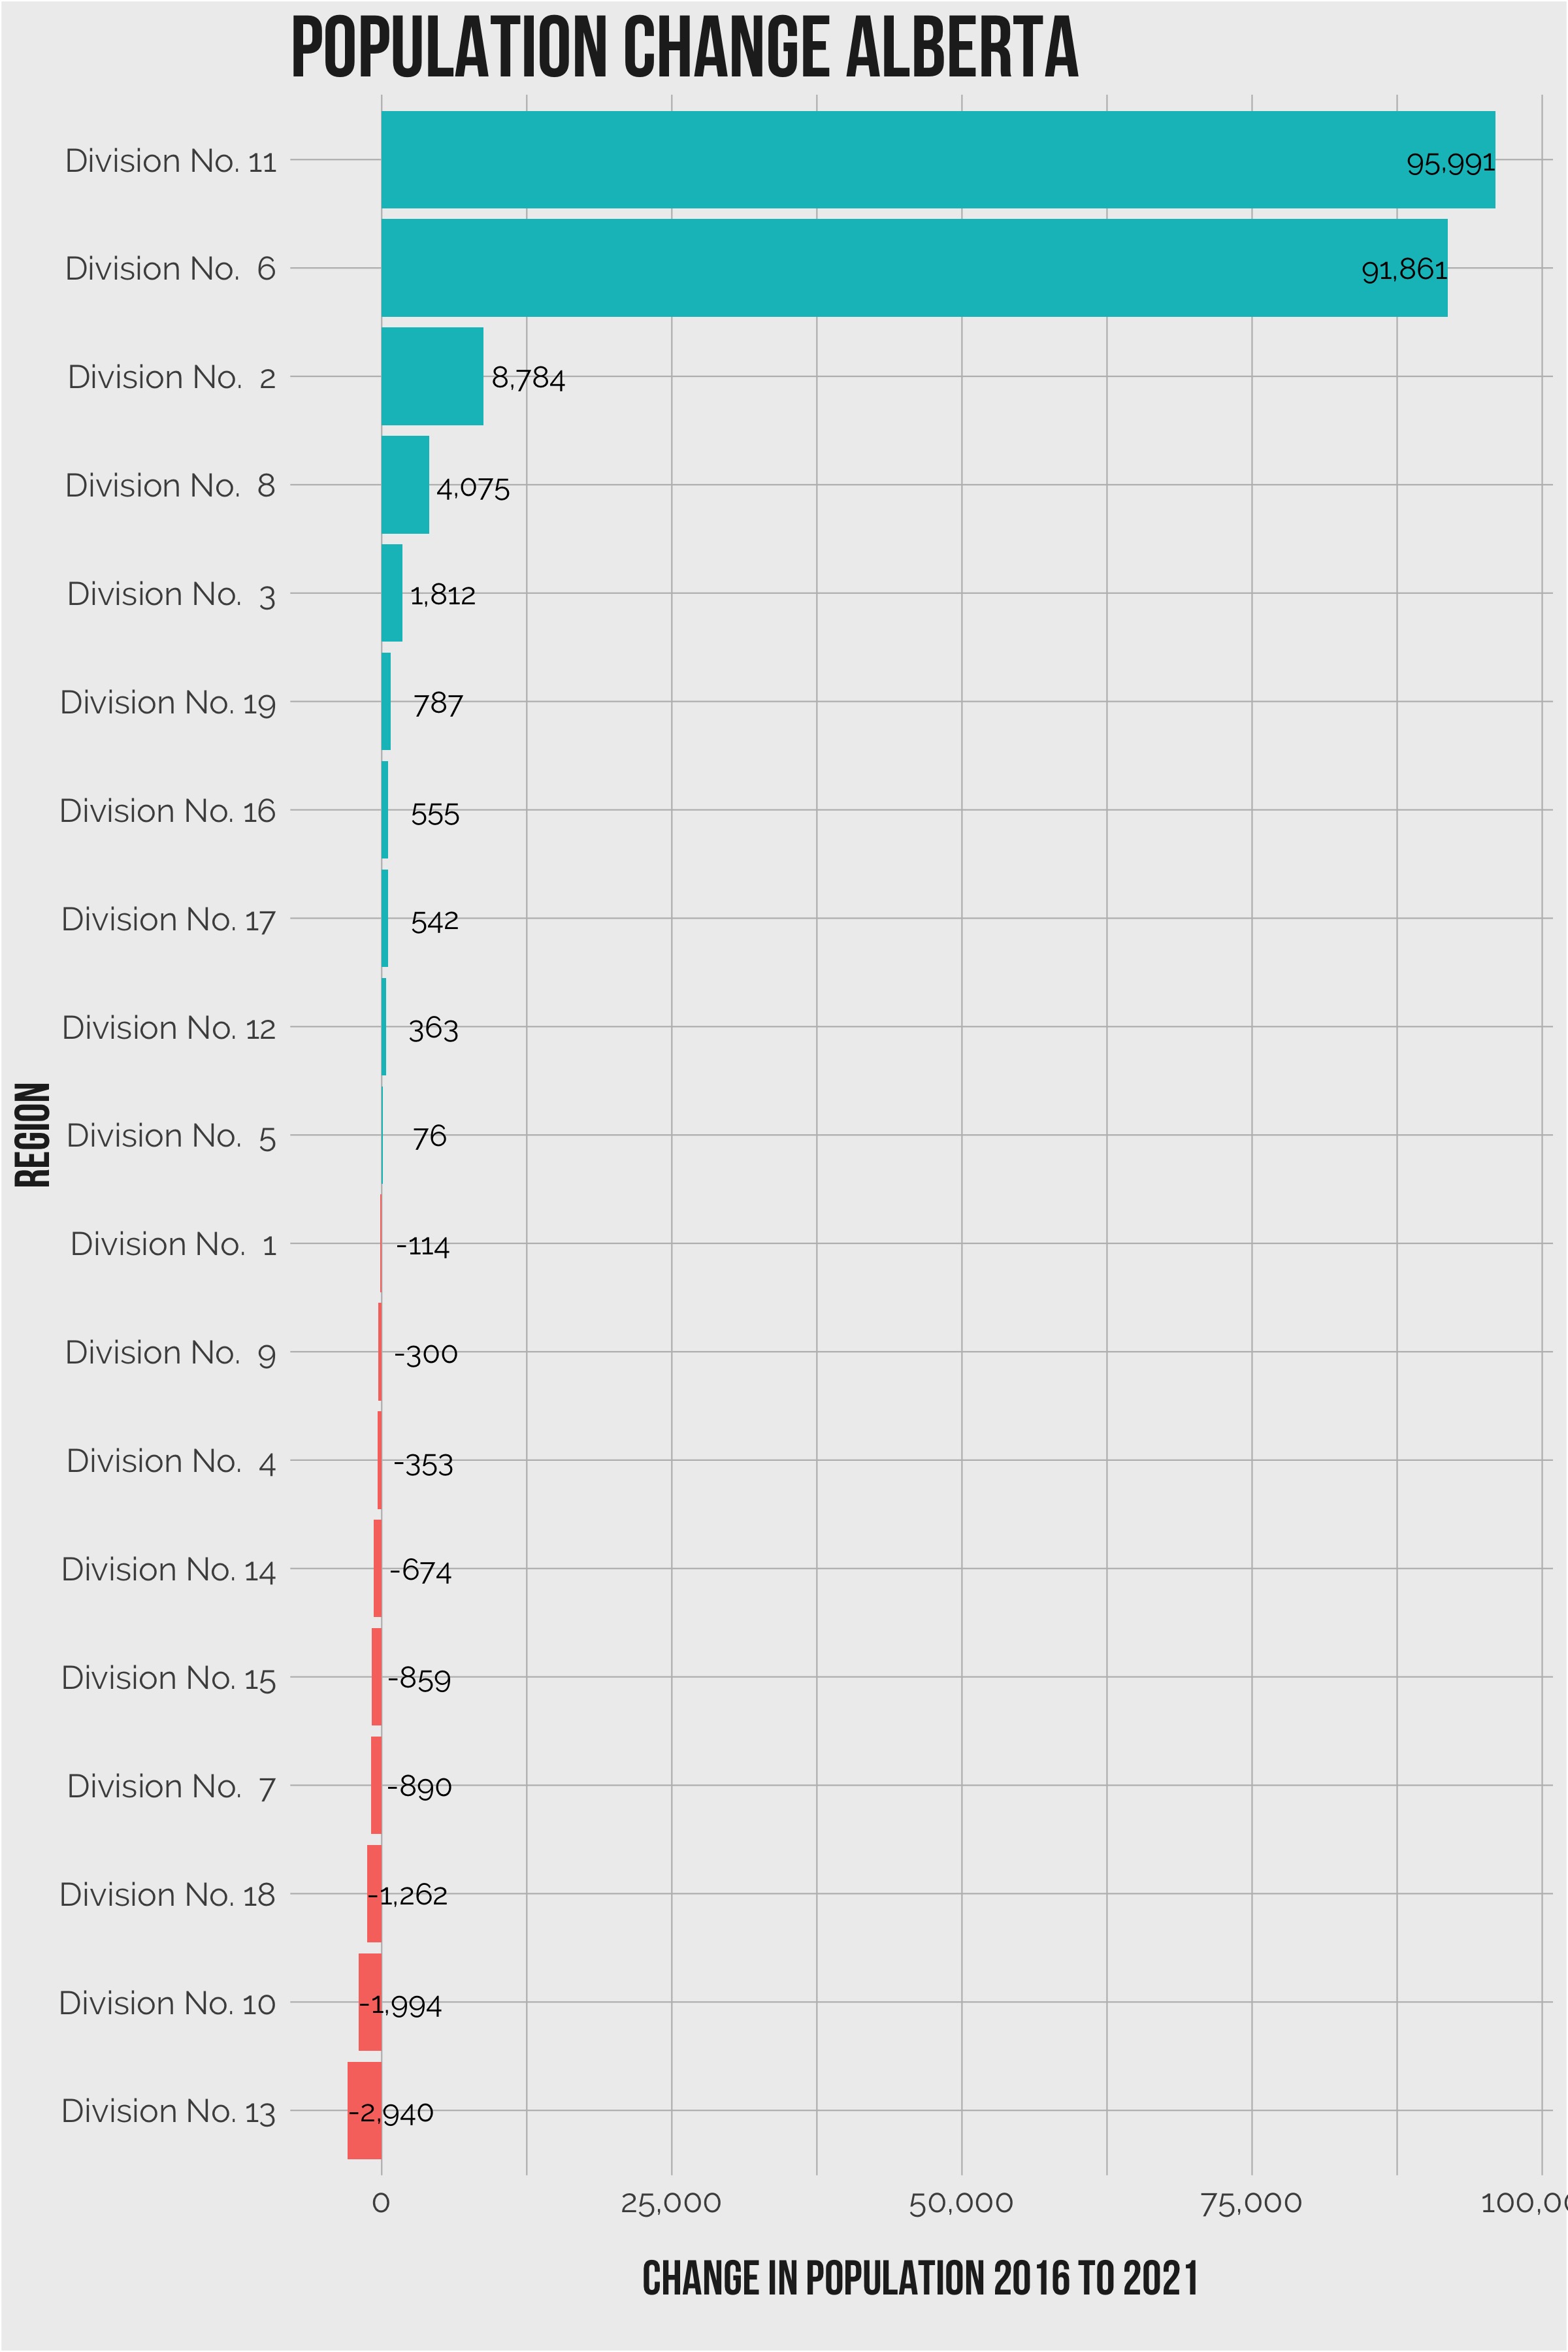
As a province, Alberta’s overall population grew by 195,460 from 4,067,175 in 2016 to 4,262,635 in 2021. 10 of the 19 census divisions in the province saw growth.
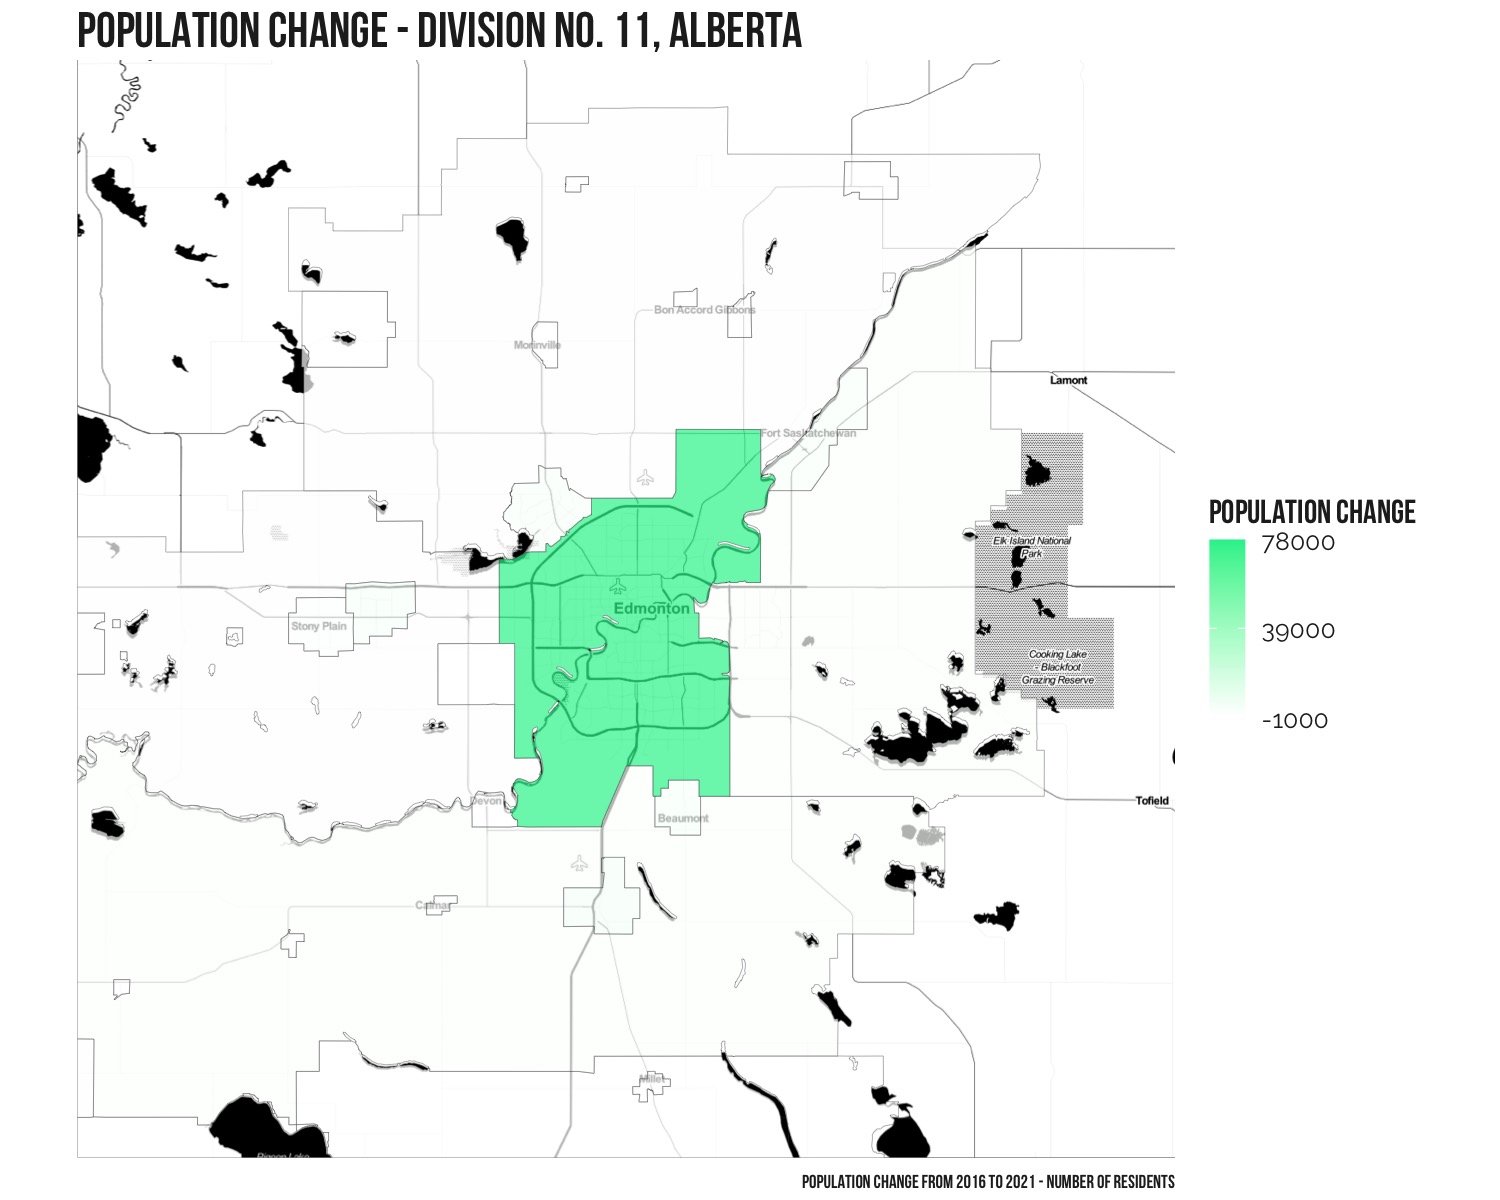
The census division of “Division No. 11” which includes Edmonton, saw the highest percentage increase as well as actual population increase. This area grew by 95,991 residents from 1,366,050 in 2016 to 1,462,041 in 2021 (7.0%).
| Region | Population 2016 | Population 2021 | Population Difference | Population Difference Percent |
|---|---|---|---|---|
| Division No. 11 | 1,366,050 | 1,462,041 | 95,991 | 7.03 |
| Division No. 6 | 1,498,778 | 1,590,639 | 91,861 | 6.13 |
| Division No. 2 | 169,729 | 178,513 | 8,784 | 5.18 |
| Division No. 8 | 209,395 | 213,470 | 4,075 | 1.95 |
| Division No. 3 | 38,956 | 40,768 | 1,812 | 4.65 |
| Division No. 19 | 120,380 | 121,167 | 787 | 0.65 |
| Division No. 16 | 73,988 | 74,543 | 555 | 0.75 |
| Division No. 17 | 61,590 | 62,132 | 542 | 0.88 |
| Division No. 12 | 67,120 | 67,483 | 363 | 0.54 |
| Division No. 5 | 55,708 | 55,784 | 76 | 0.14 |
| Division No. 1 | 82,627 | 82,513 | -114 | -0.14 |
| Division No. 9 | 20,869 | 20,569 | -300 | -1.44 |
| Division No. 4 | 9,573 | 9,220 | -353 | -3.69 |
| Division No. 14 | 29,291 | 28,617 | -674 | -2.3 |
| Division No. 15 | 38,594 | 37,735 | -859 | -2.23 |
| Division No. 7 | 41,574 | 40,684 | -890 | -2.14 |
| Division No. 18 | 14,488 | 13,226 | -1,262 | -8.71 |
| Division No. 10 | 97,449 | 95,455 | -1,994 | -2.05 |
| Division No. 13 | 71,016 | 68,076 | -2,940 | -4.14 |
Which areas have seen high growth?
Of the 19 census divisions in the province, 10 saw population growth between 2016 and 2021.
The next level down to consider is the census subdivision, which Statistics Canada defines as “the general term for municipalities”.
High growth area #1
Division No. 11, which includes Edmonton, saw the largest increase in population of 95,991 residents from 1,366,050 in 2016 to 1,462,041 in 2021 (7.0%).
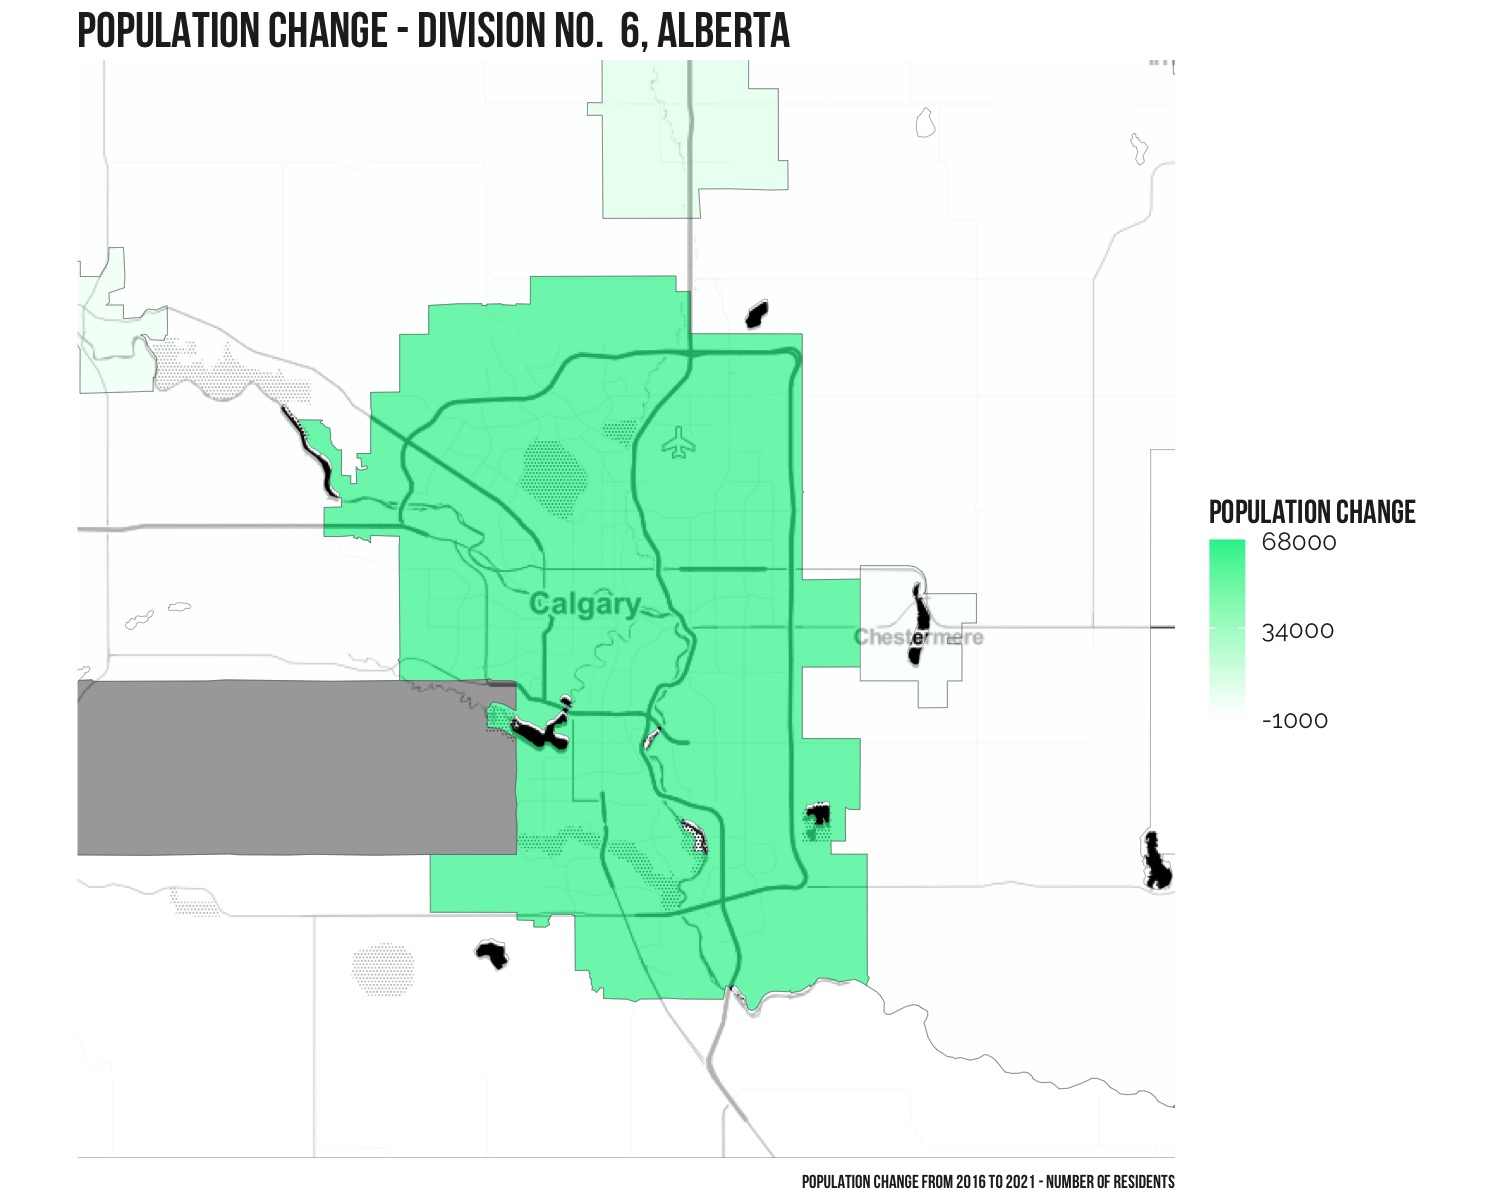
High growth area #2
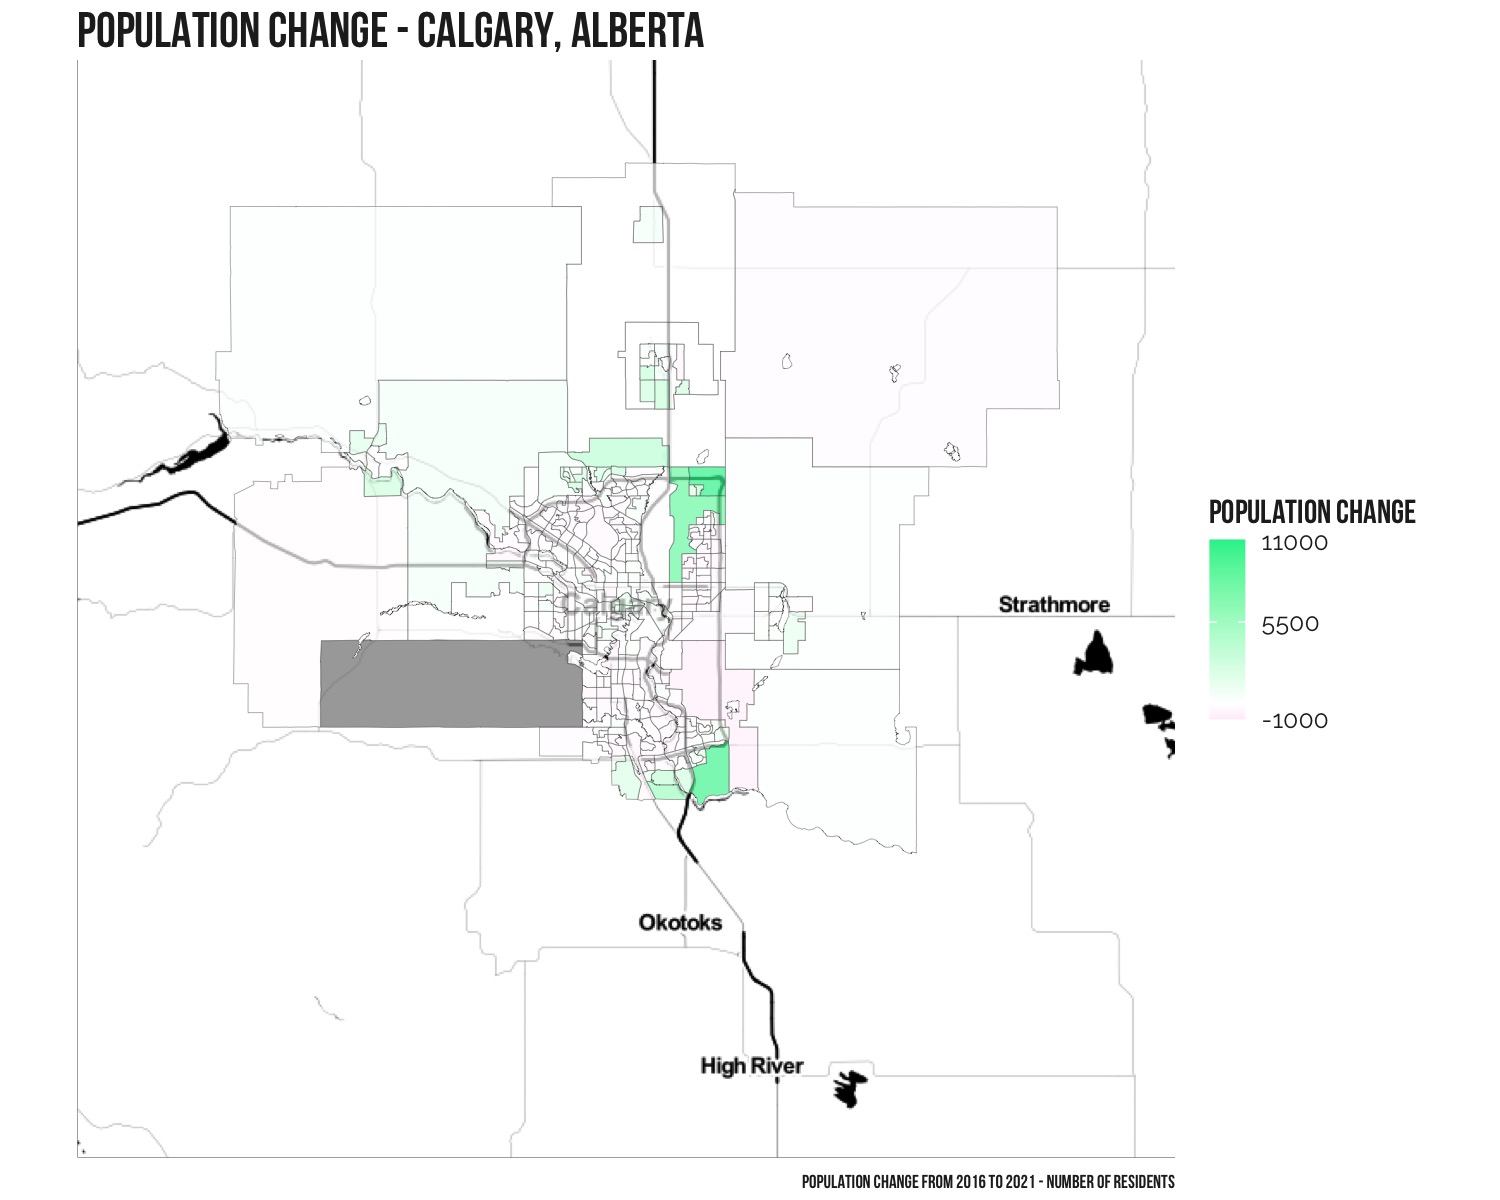
Division No. 6, which includes Calgary, saw the second largest increase in population of 91,861 residents from 1,498,778 in 2016 to 1,590,639 in 2021 (6.1%). Note the area to the south-west does not currently have population data available for the 2021 census.
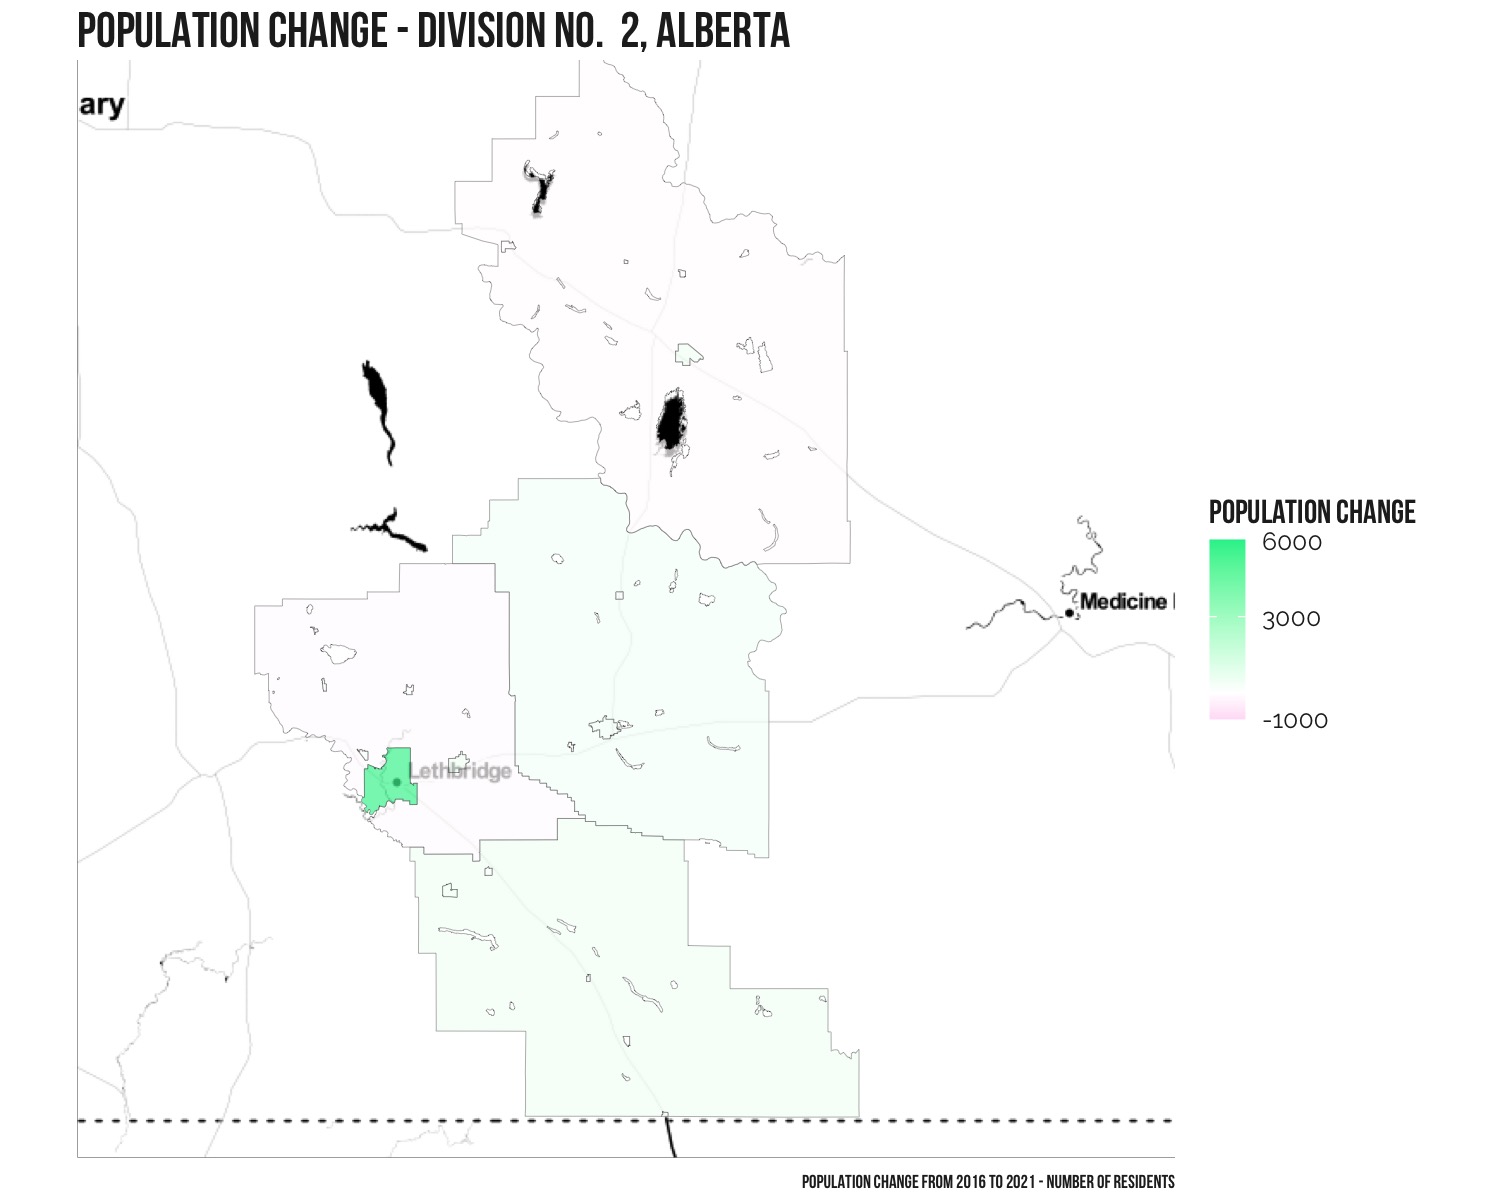
High growth area #3
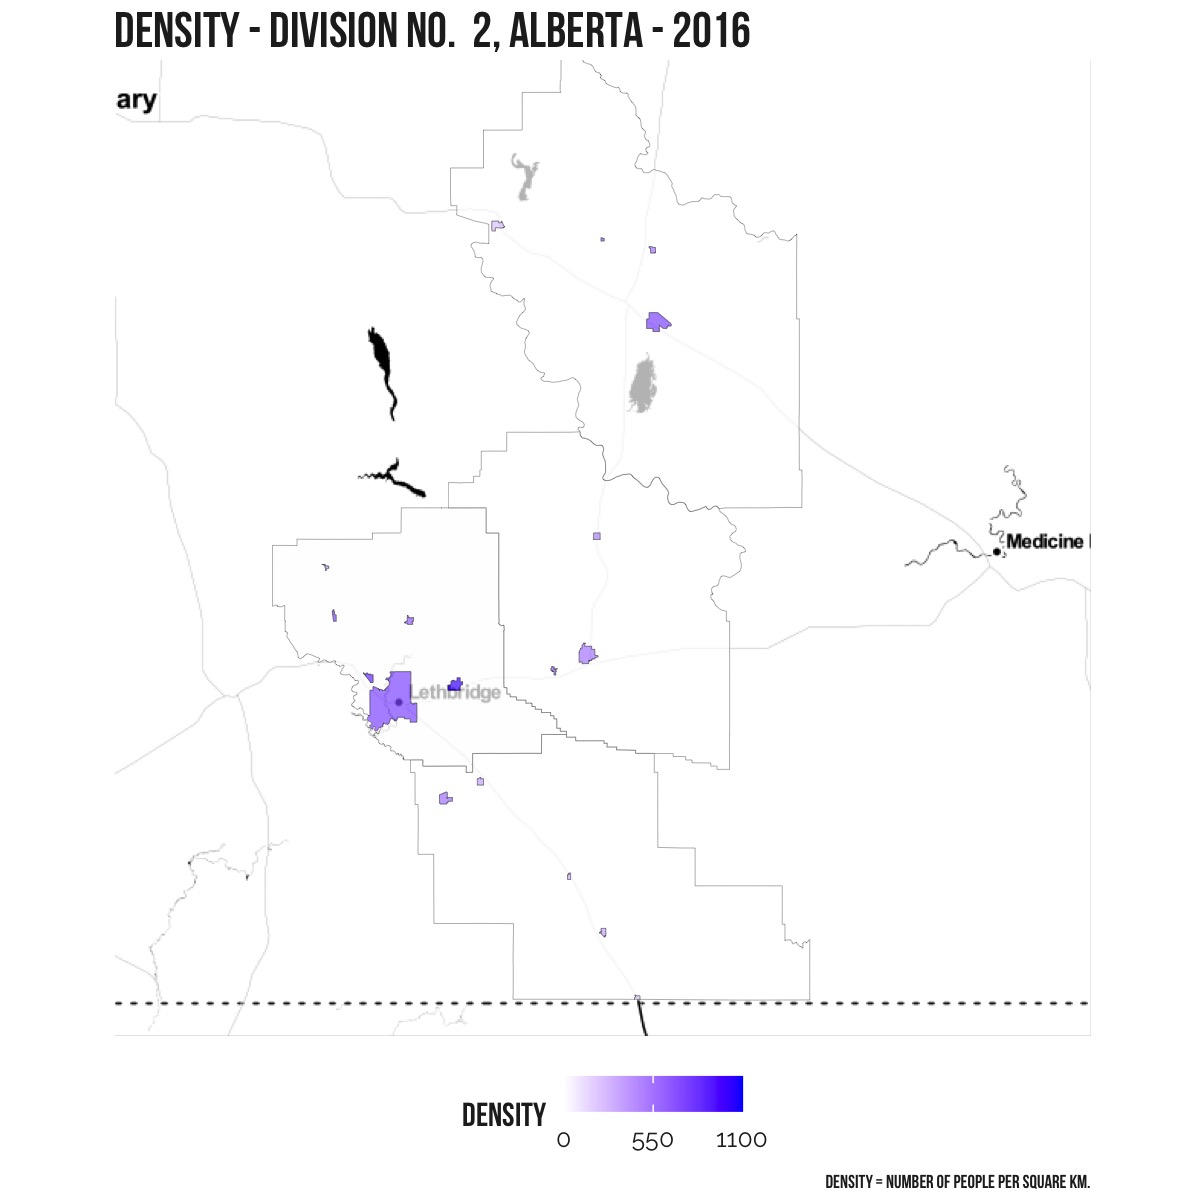
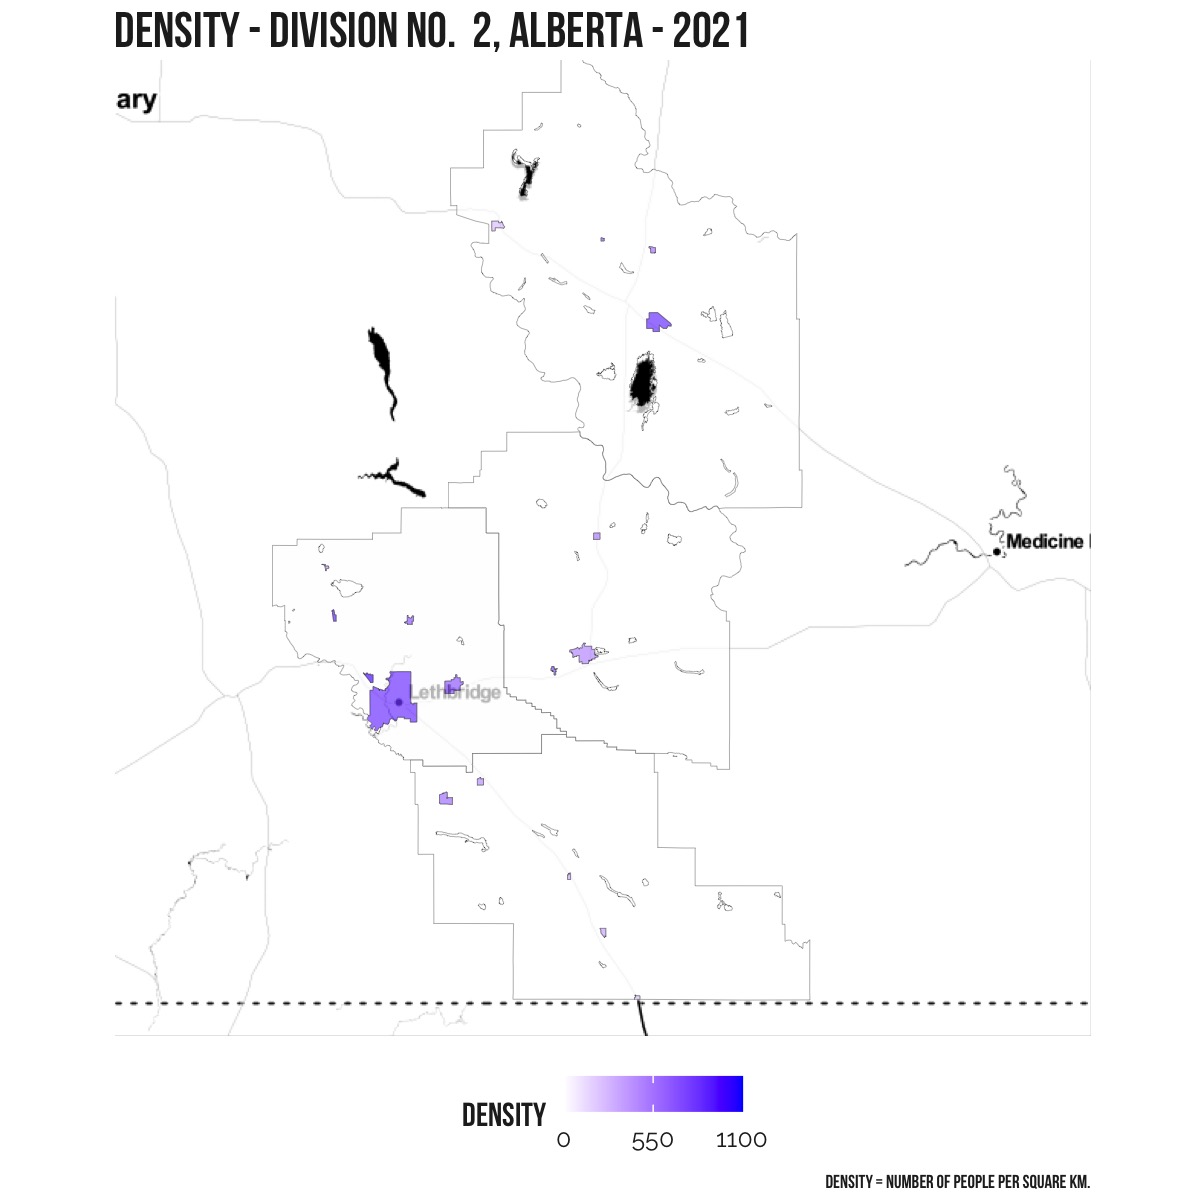
Division No. 2, which includes Lethbridge, saw the third largest increase in population of 8,784 residents from 169,729 in 2016 to 178,513 in 2021 (5.2%).
Which areas have seen the lowest growth?
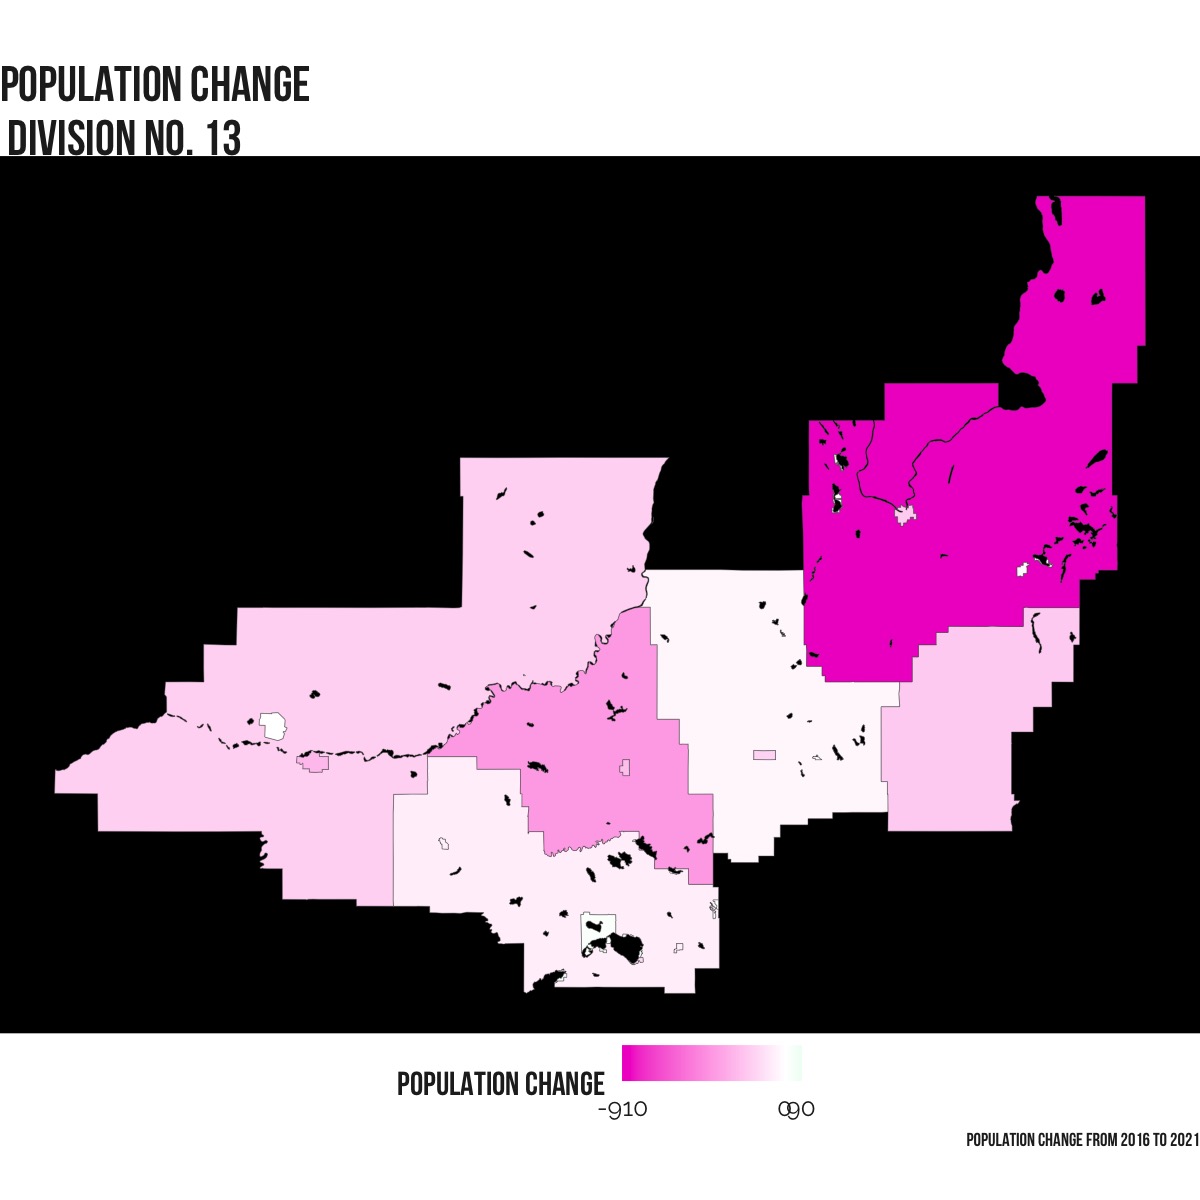
9 of the 19 census divisions in Alberta saw a drop in population. The highest decline as a percentage was Division No. 18, north-west of Edmonton, with a 8.7% drop (1,262 residents). The highest absolute decline was Division No. 13, including Athabasca, with a decline of 2,940 residents, from 71,016 in 2016 to 68,076 in 2021.

Population changes in major cities
There are 17 census metropolitan areas in Alberta. Statistics Canada defines a census metropolitan area (CMA) as “…one or more adjacent municipalities centred on a population centre (known as the core). A CMA must have a total population of at least 100,000 of which 50,000 or more must live in the core.”
Calgary is the largest with an overall population of 1,481,806, and Edmonton is a close second at 1,418,118.
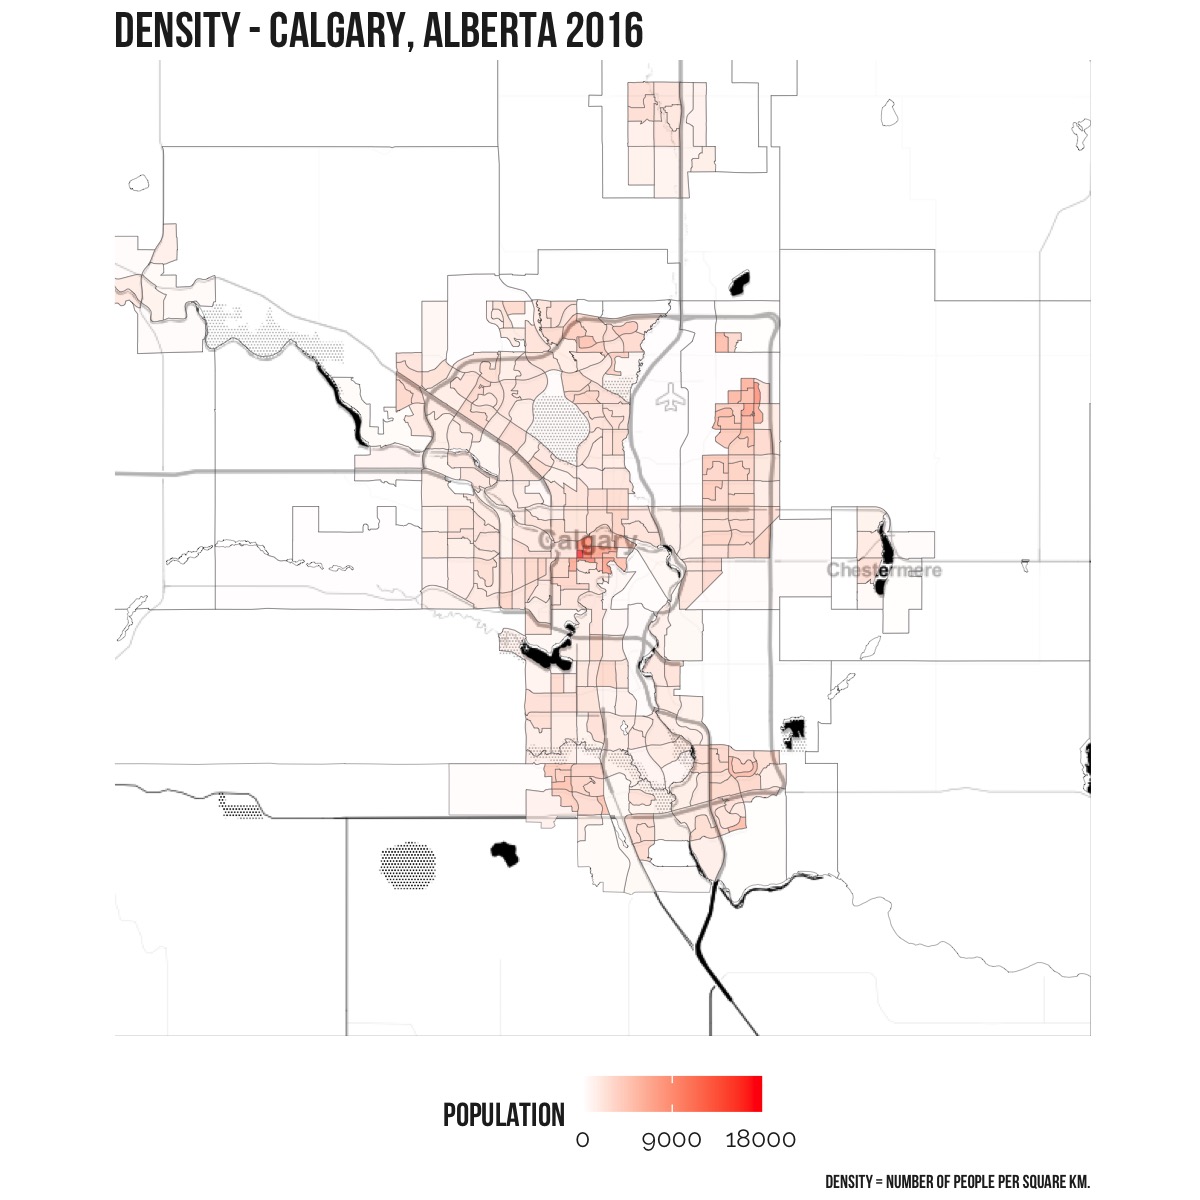
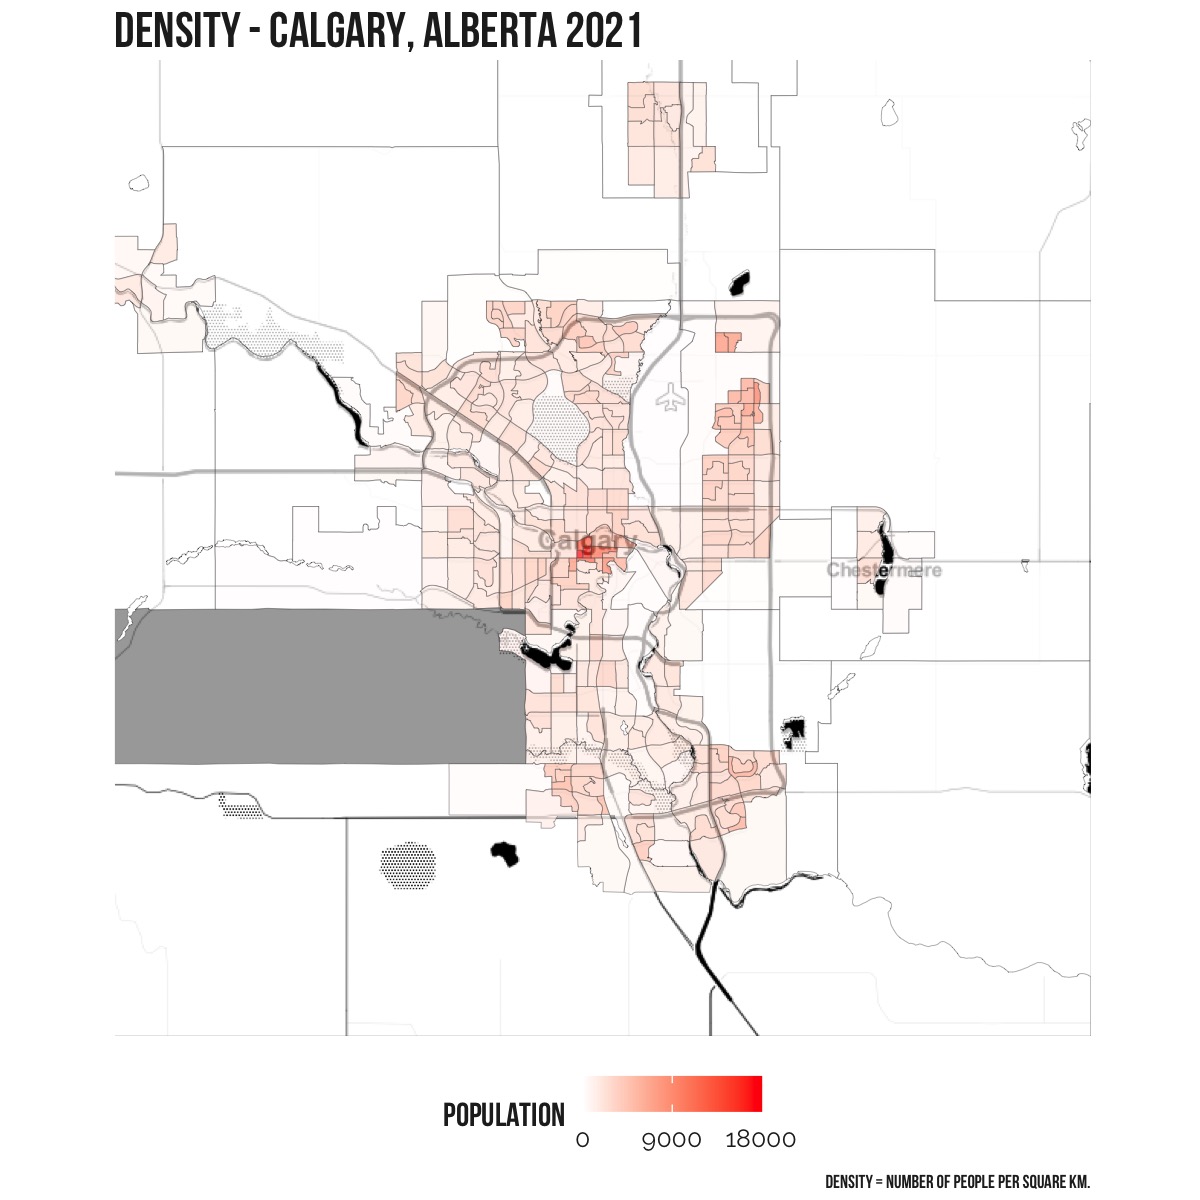
CMA – Calgary
The census metropolitan area (CMA) of Calgary grew by 89,197 residents from 1,392,609 in 2016 to 1,481,806 in 2021. Note the area to the south-west does not currently have population data available for the 2021 census.
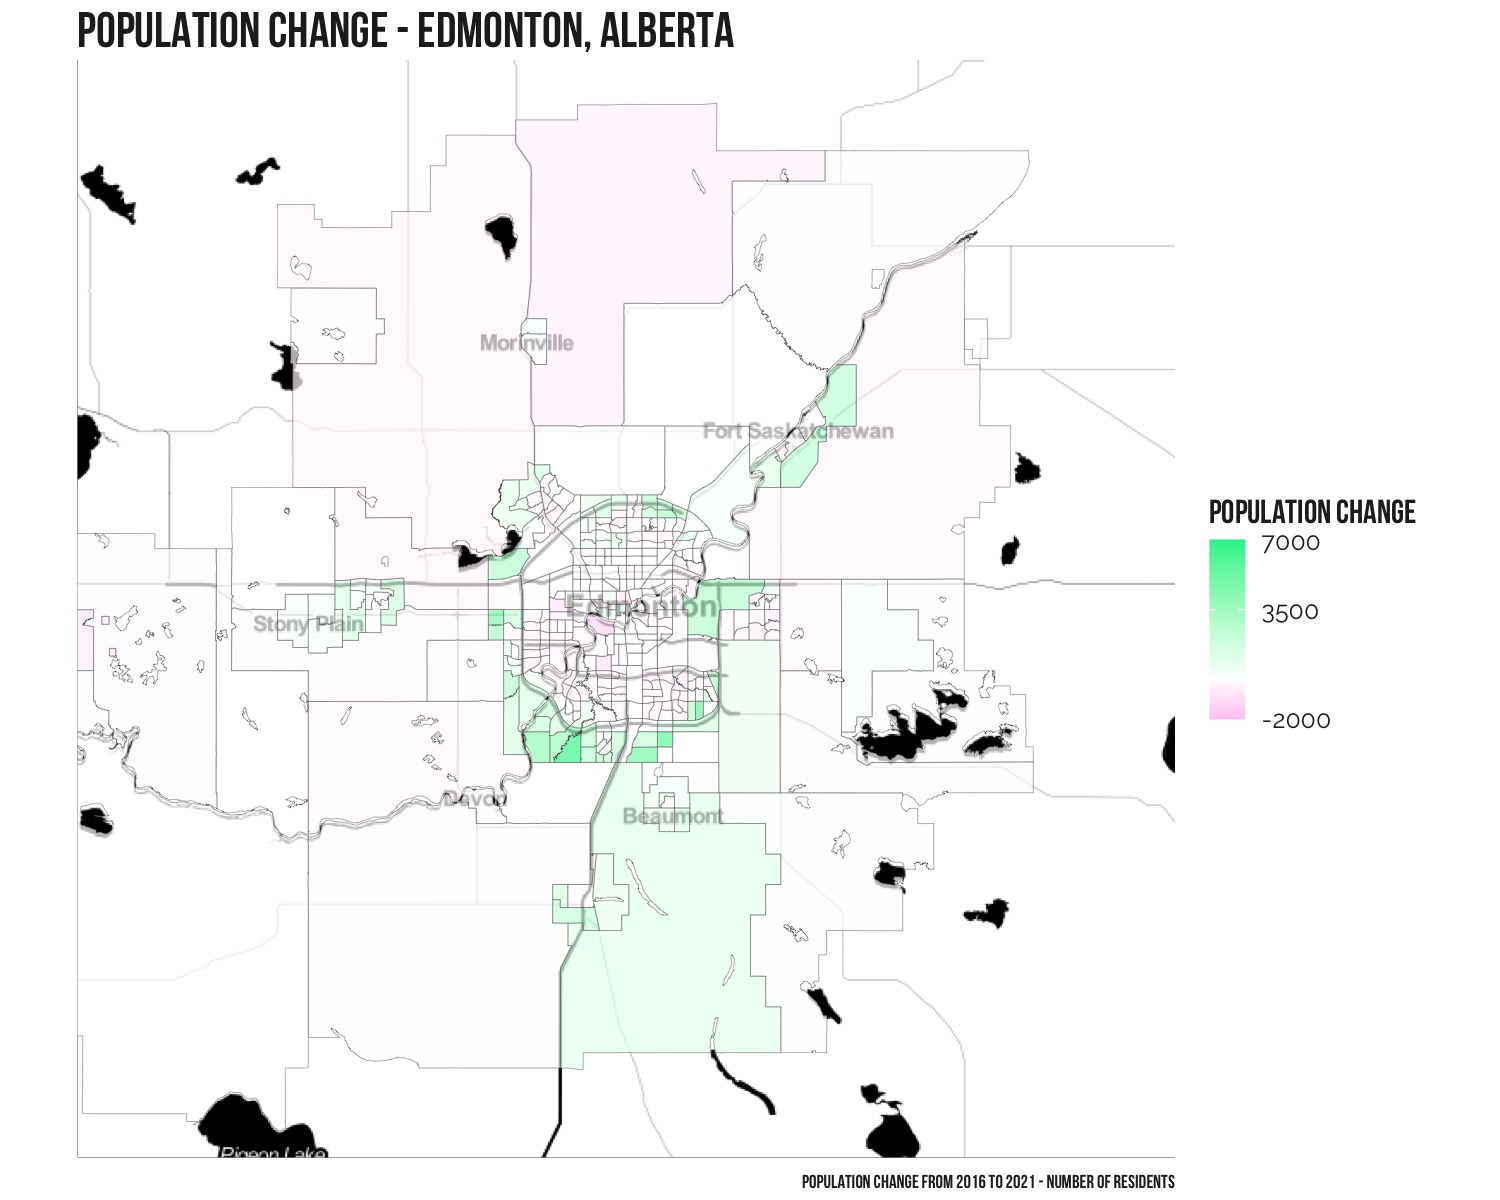
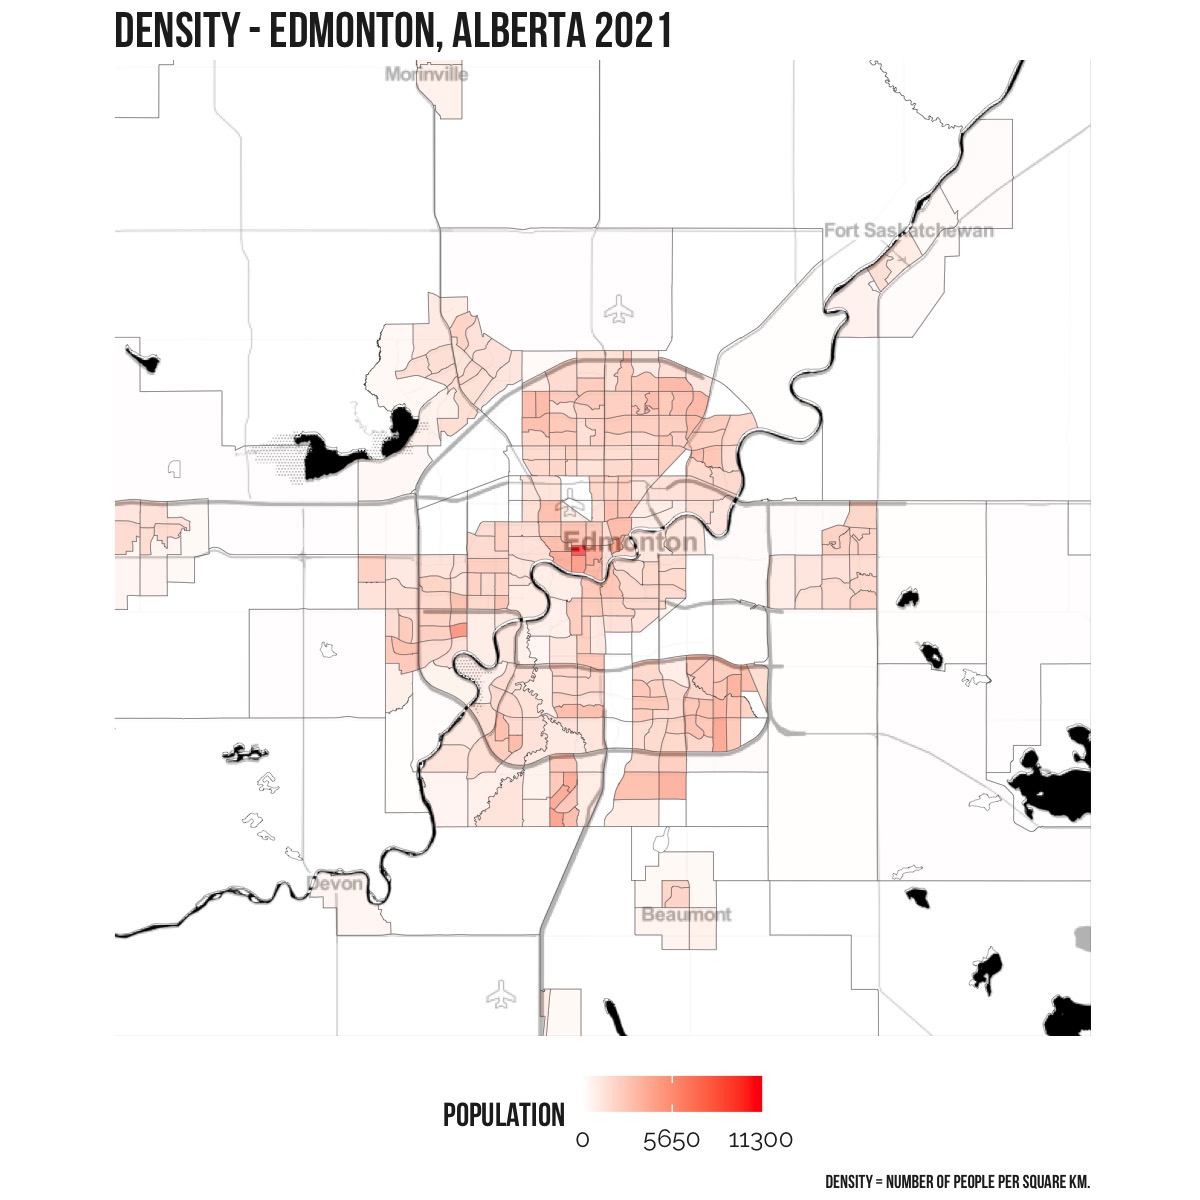
CMA – Edmonton
The census metropolitan area (CMA) of Edmonton grew by 96,677 residents from 1,321,441 in 2016 to 1,418,118 in 2021.

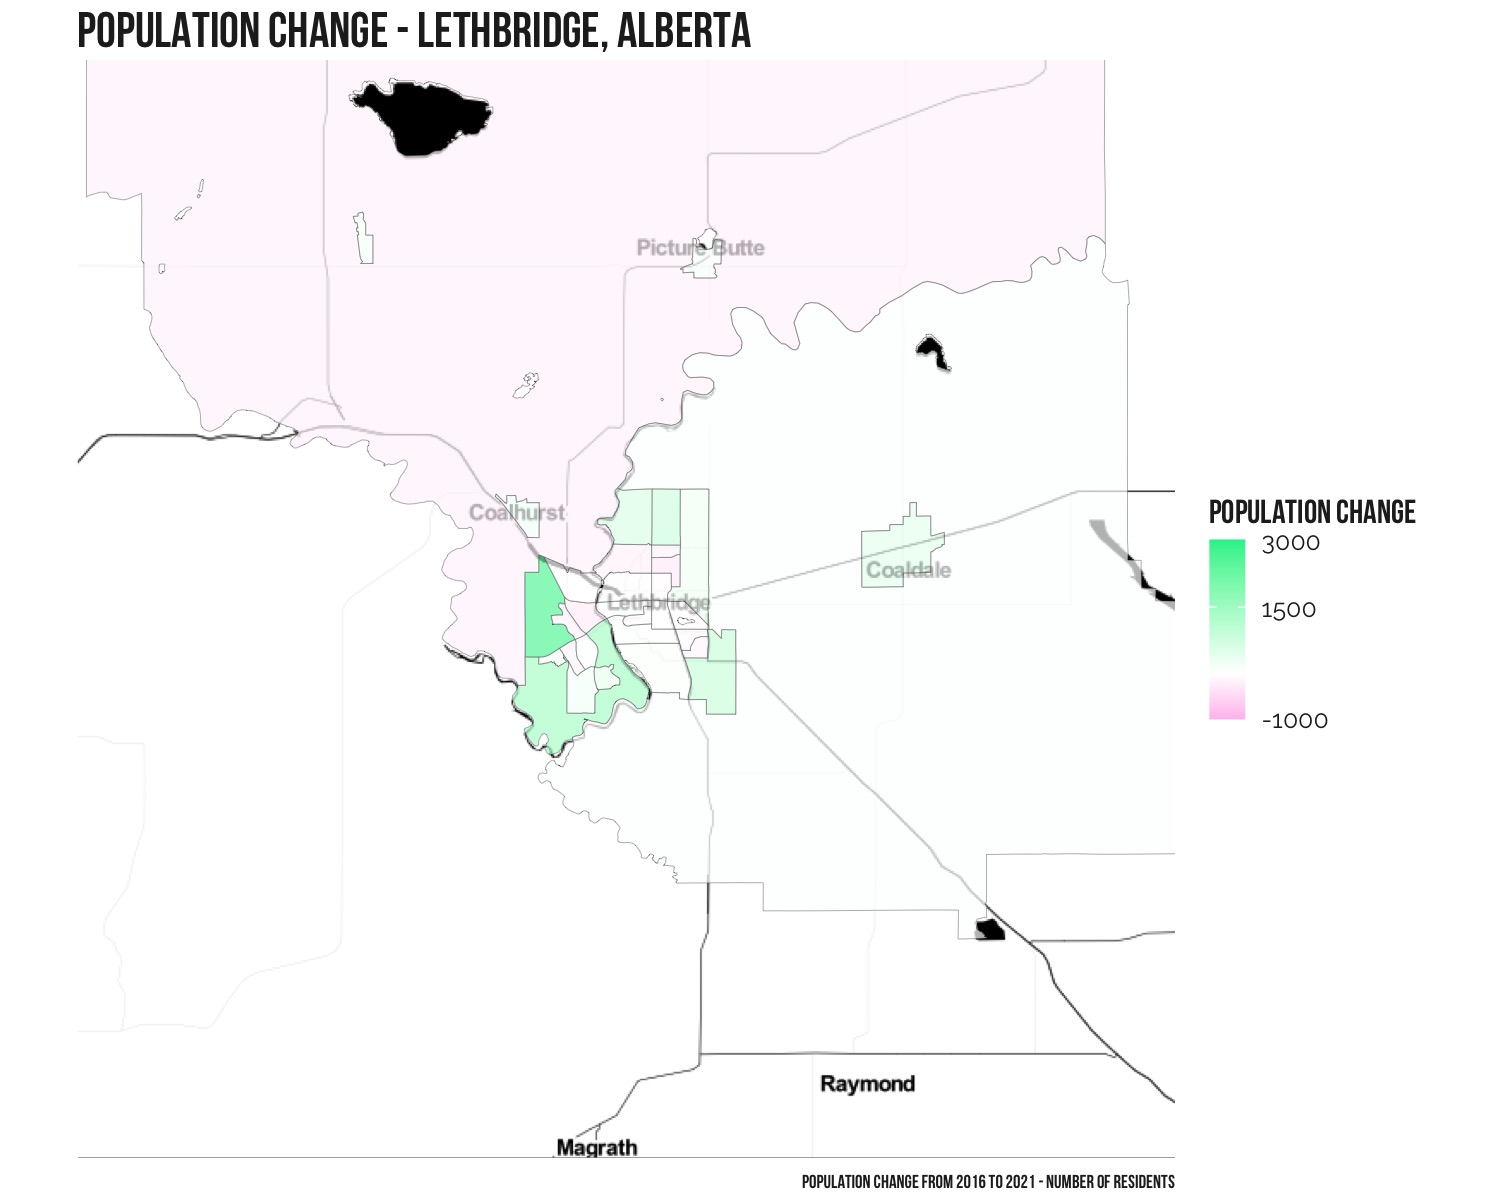
CMA – Lethbridge
The census metropolitan area (CMA) of Lethbridge grew by 6,453 residents from 117,394 in 2016 to 123,847 in 2021.

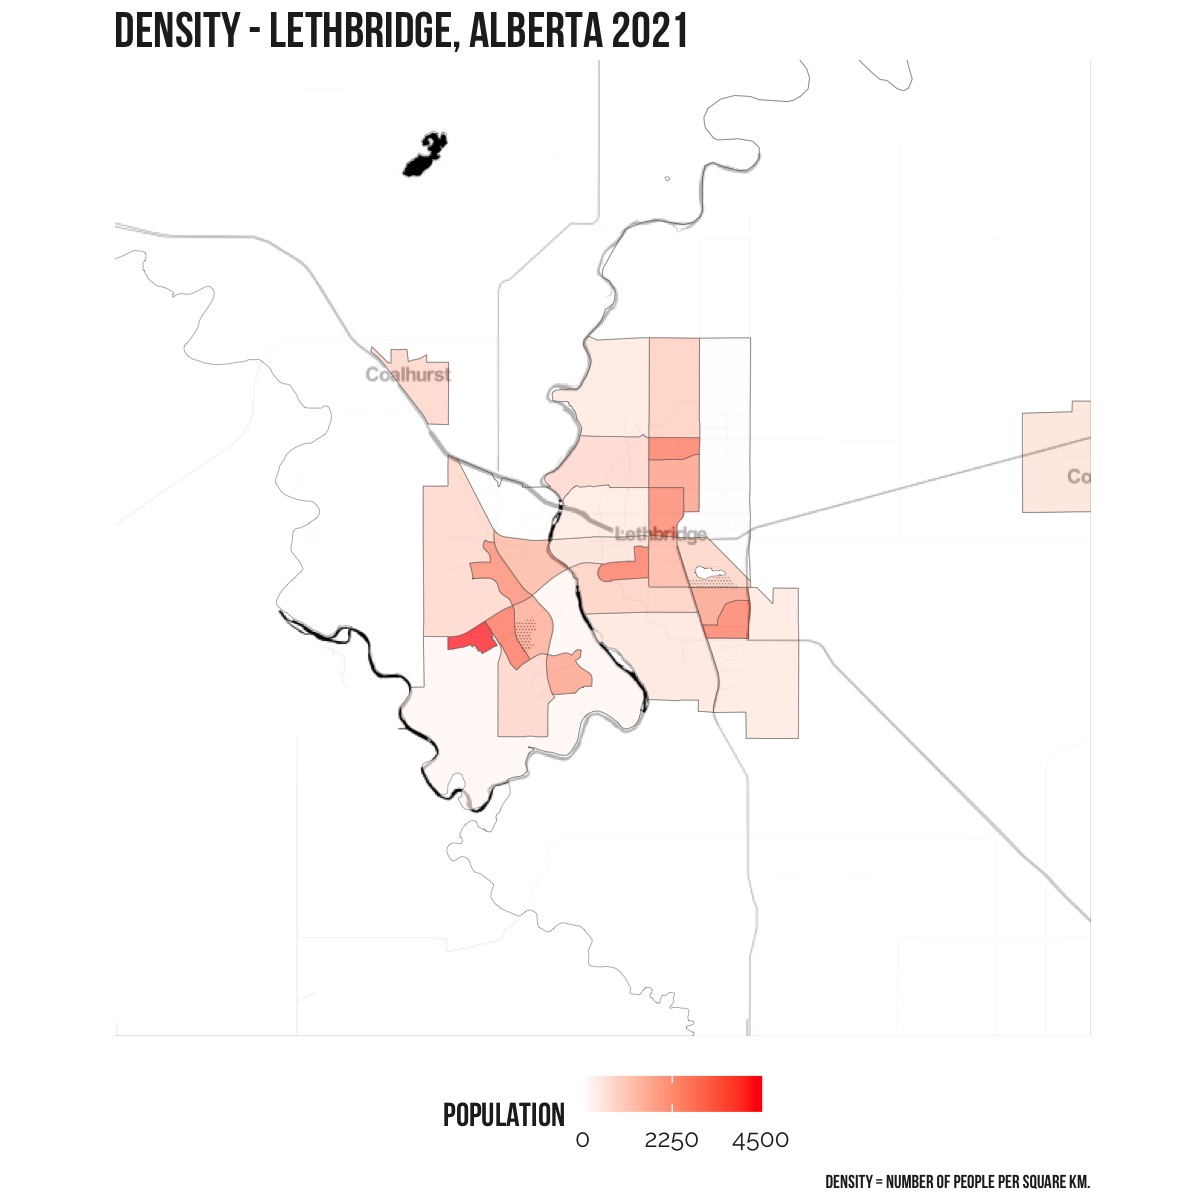
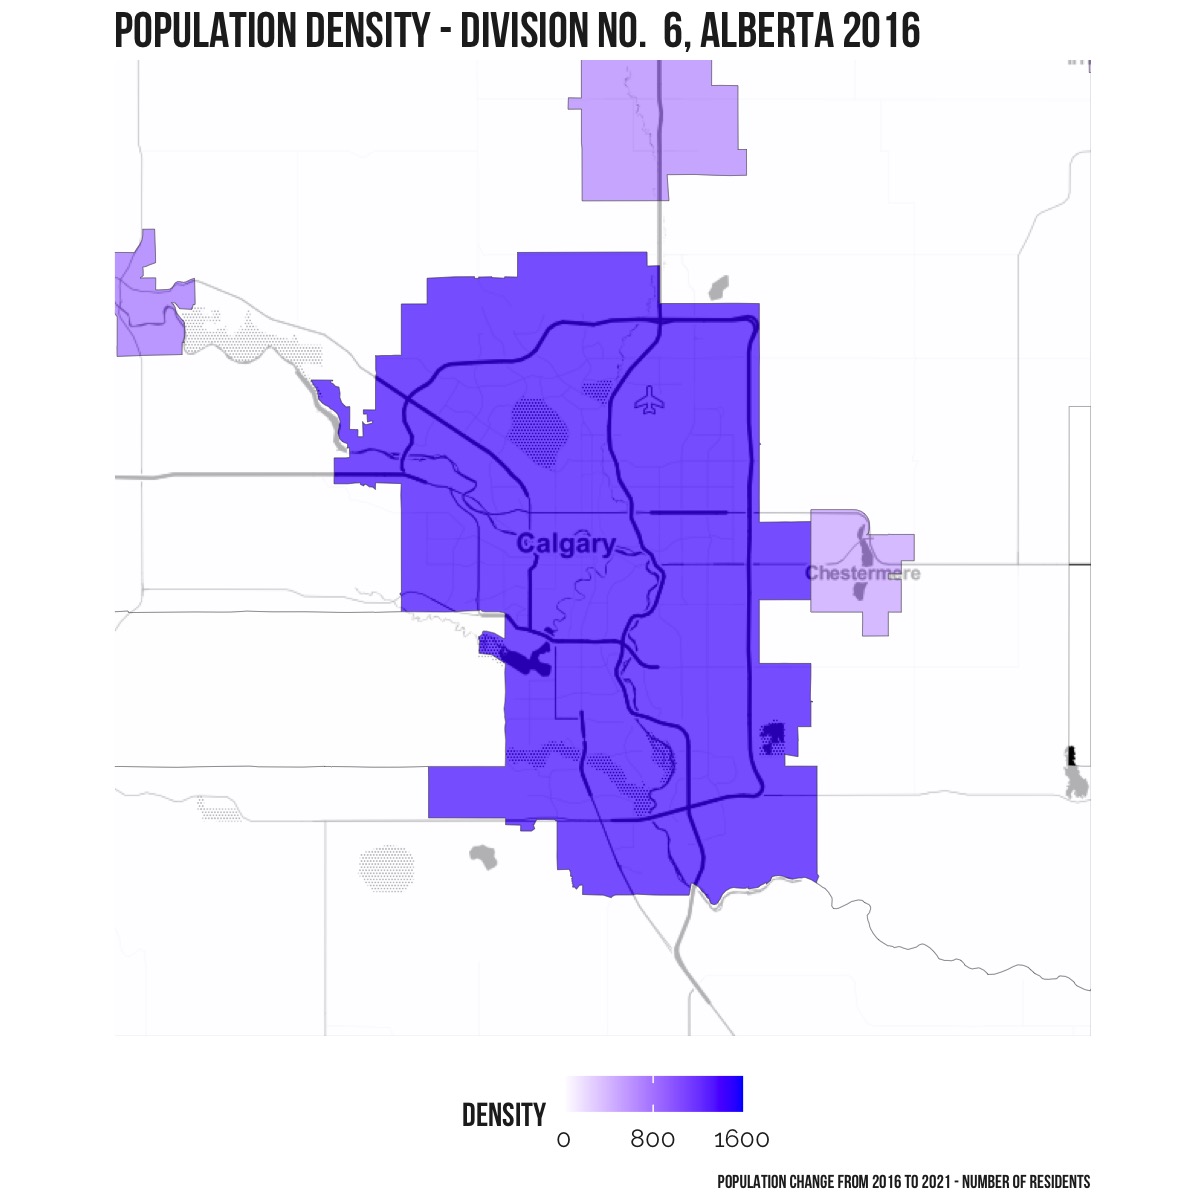
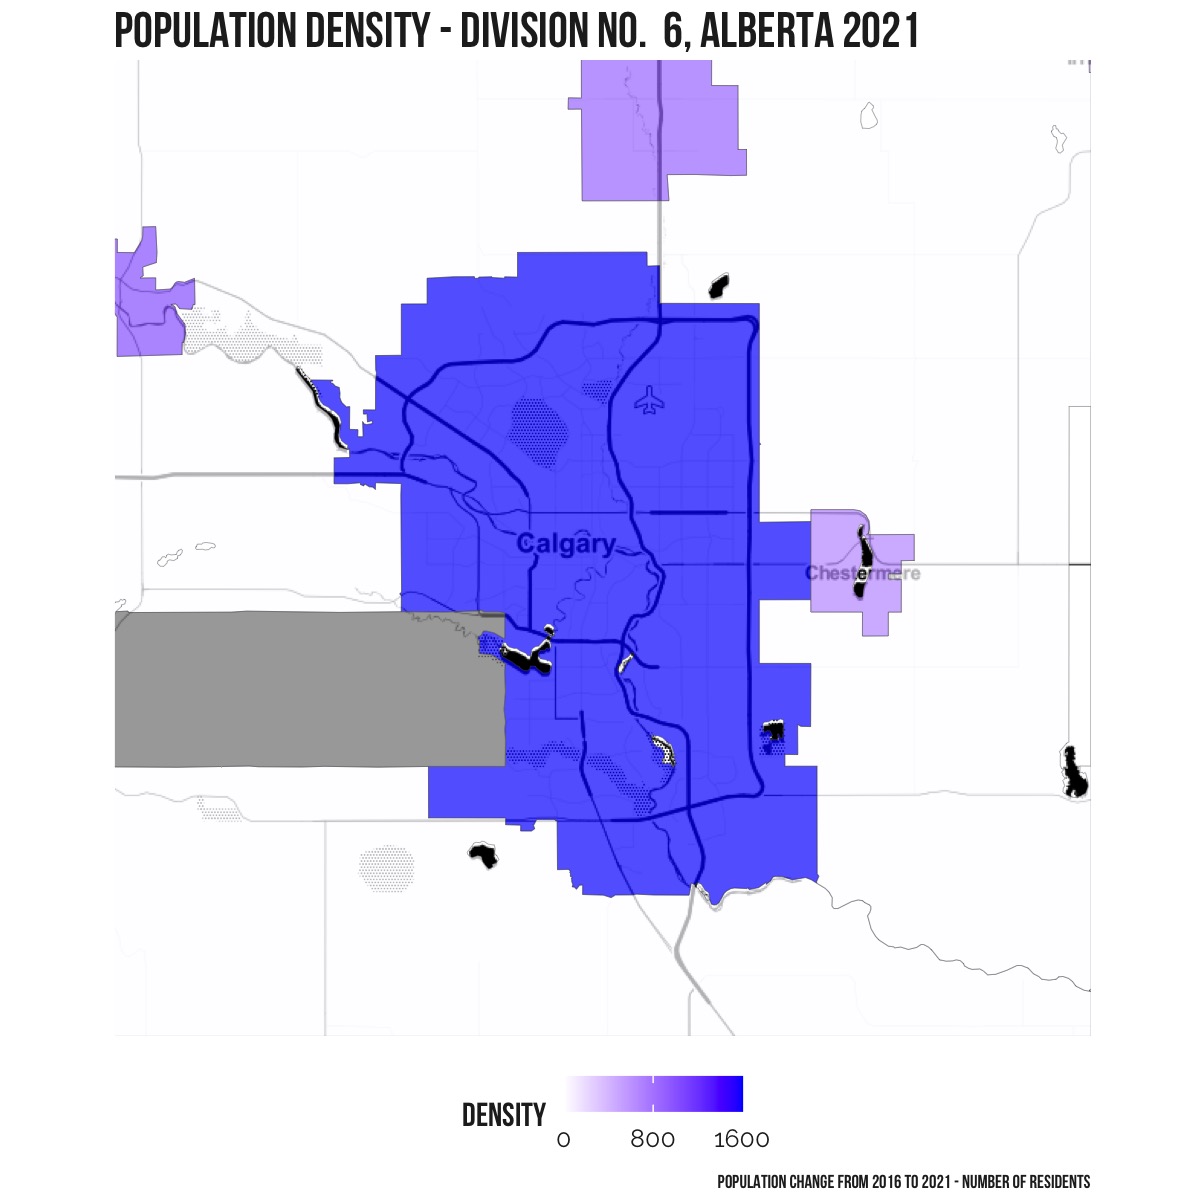
Overall population density