The 2021 census has been released and that means it is time to dive right into some population trends. Population numbers all across Canada have changed substantially between 2016 and 2021 – you can read more about provincial level changes here.
At a local level, it is interesting to see how population and density has changed within cities. This post will go into more detail about the changes in Sudbury between 2016 and 2021.
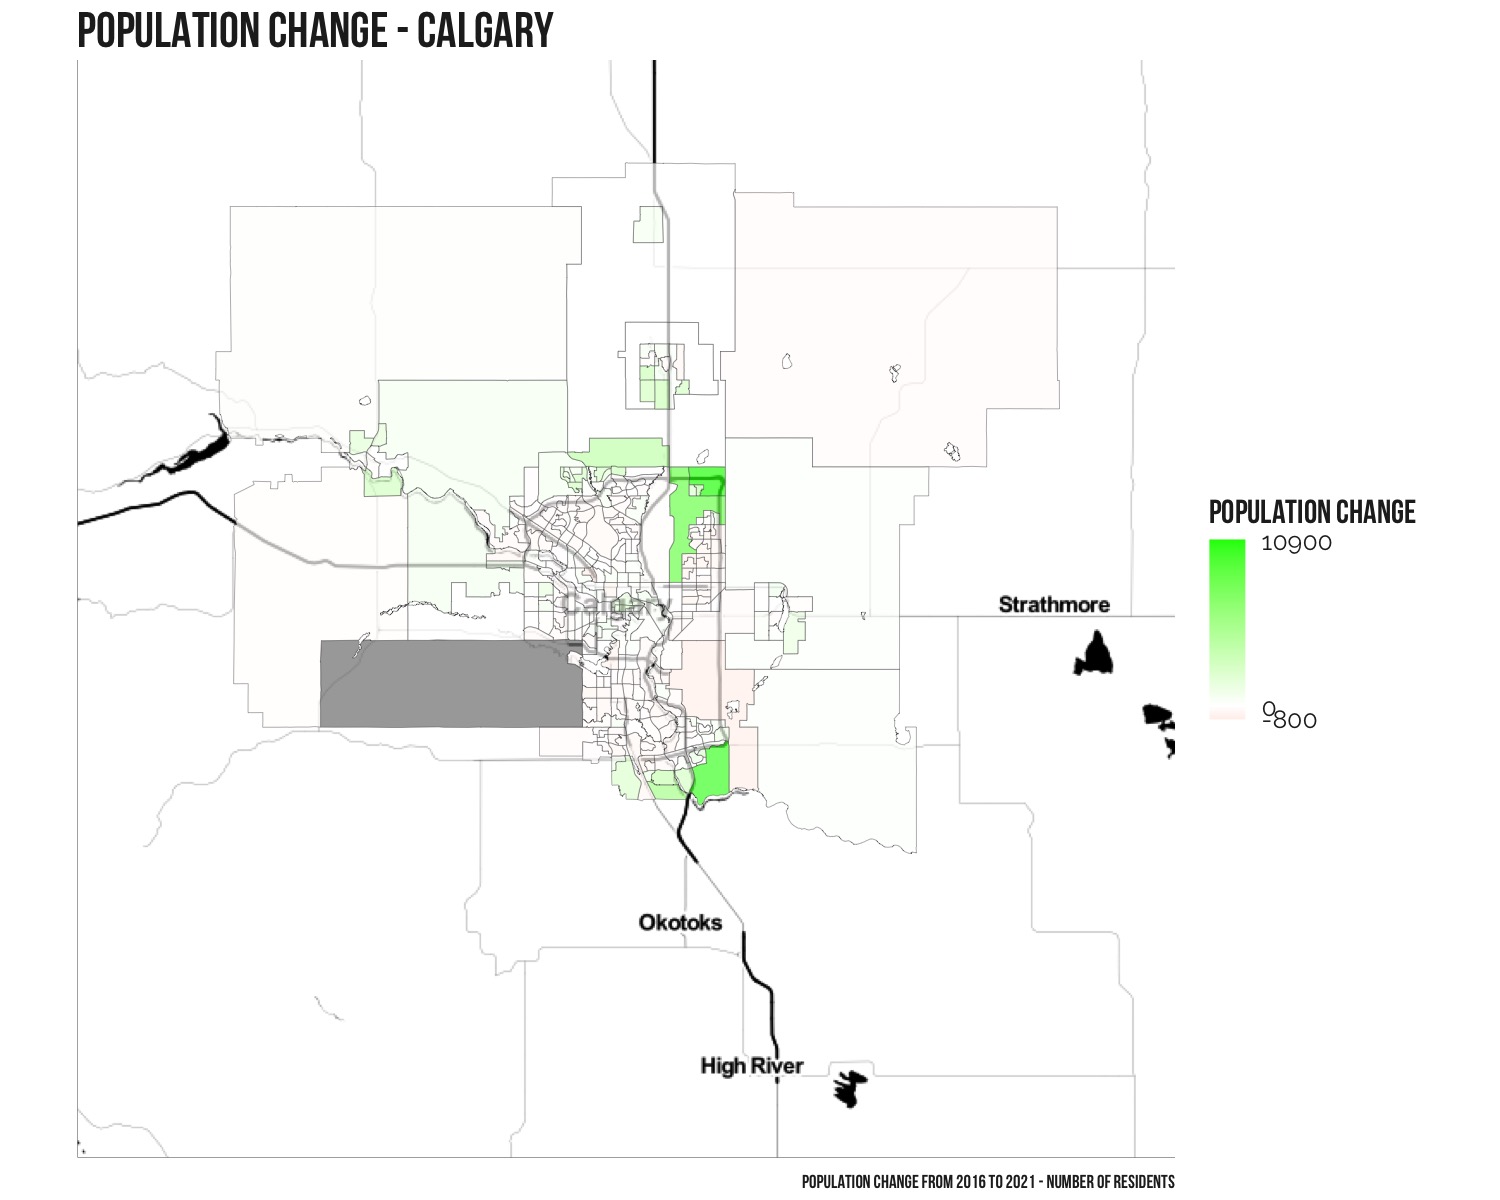
This post specifically looks at the CMA of Calgary. Statistics Canada defines a census metropolitan area (CMA) as “…one or more adjacent municipalities centred on a population centre (known as the core). A CMA must have a total population of at least 100,000 of which 50,000 or more must live in the core.”
Overall Sudbury has seen an increase of 89,197 residents, from 1,392,609 in 2016 to 1,481,806. The map below shows how population has changed across the 328 different Census Tracts across Calgary with green an increase, white no change, and red a decrease. Note that population data is not currently available for the grey area to the south-west.
Highest Growth Areas
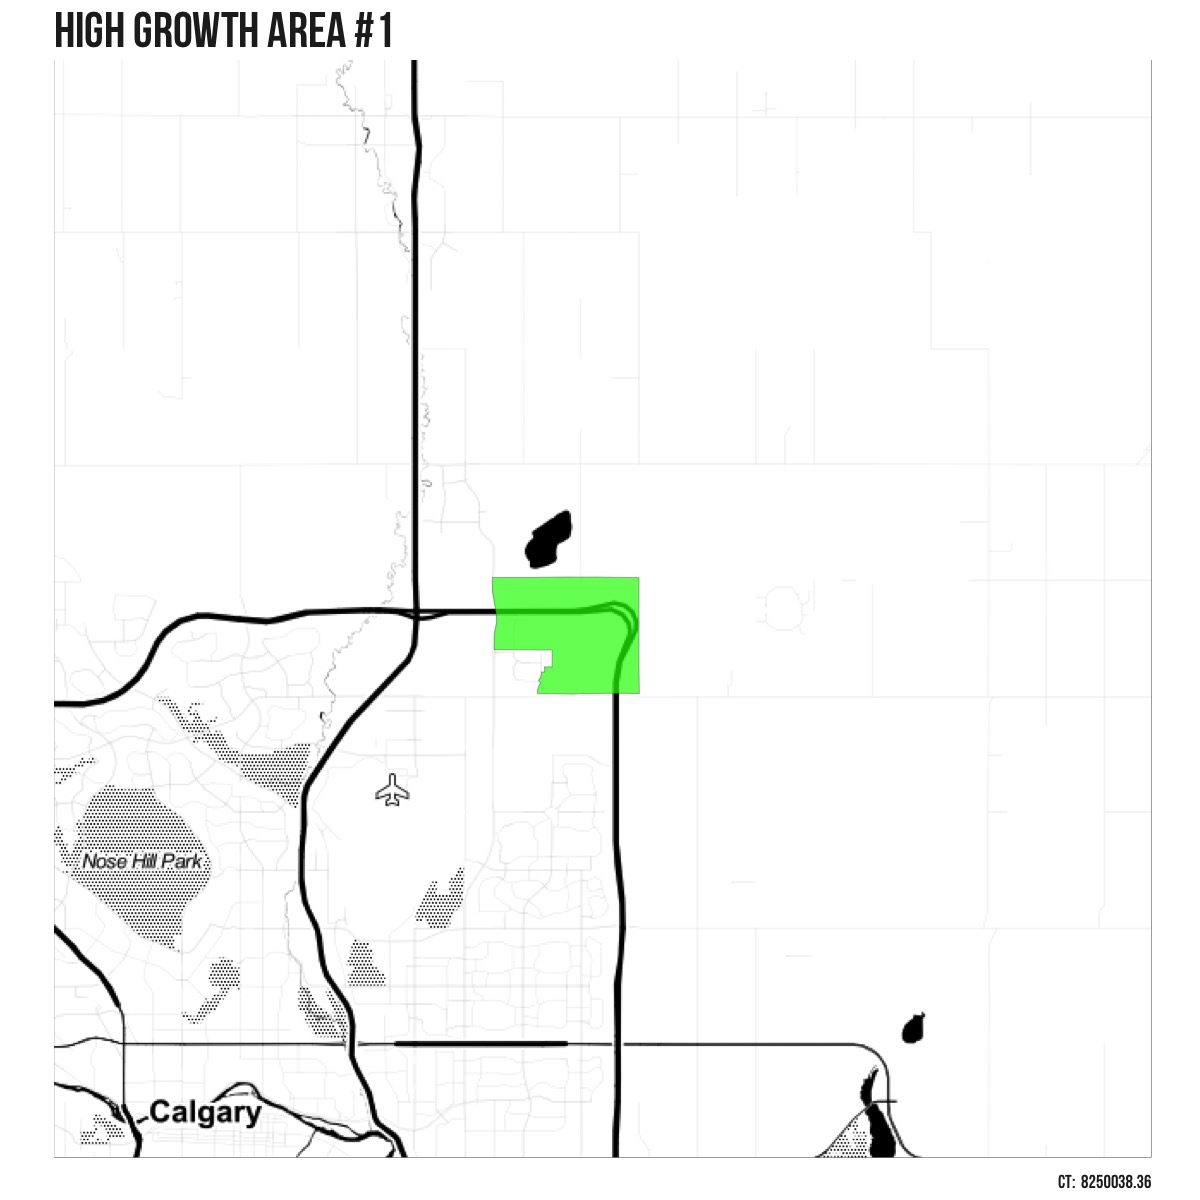
High Growth Area #1
The area in the north-east of Calgary has seen the largest amount of growth in people (not percent).
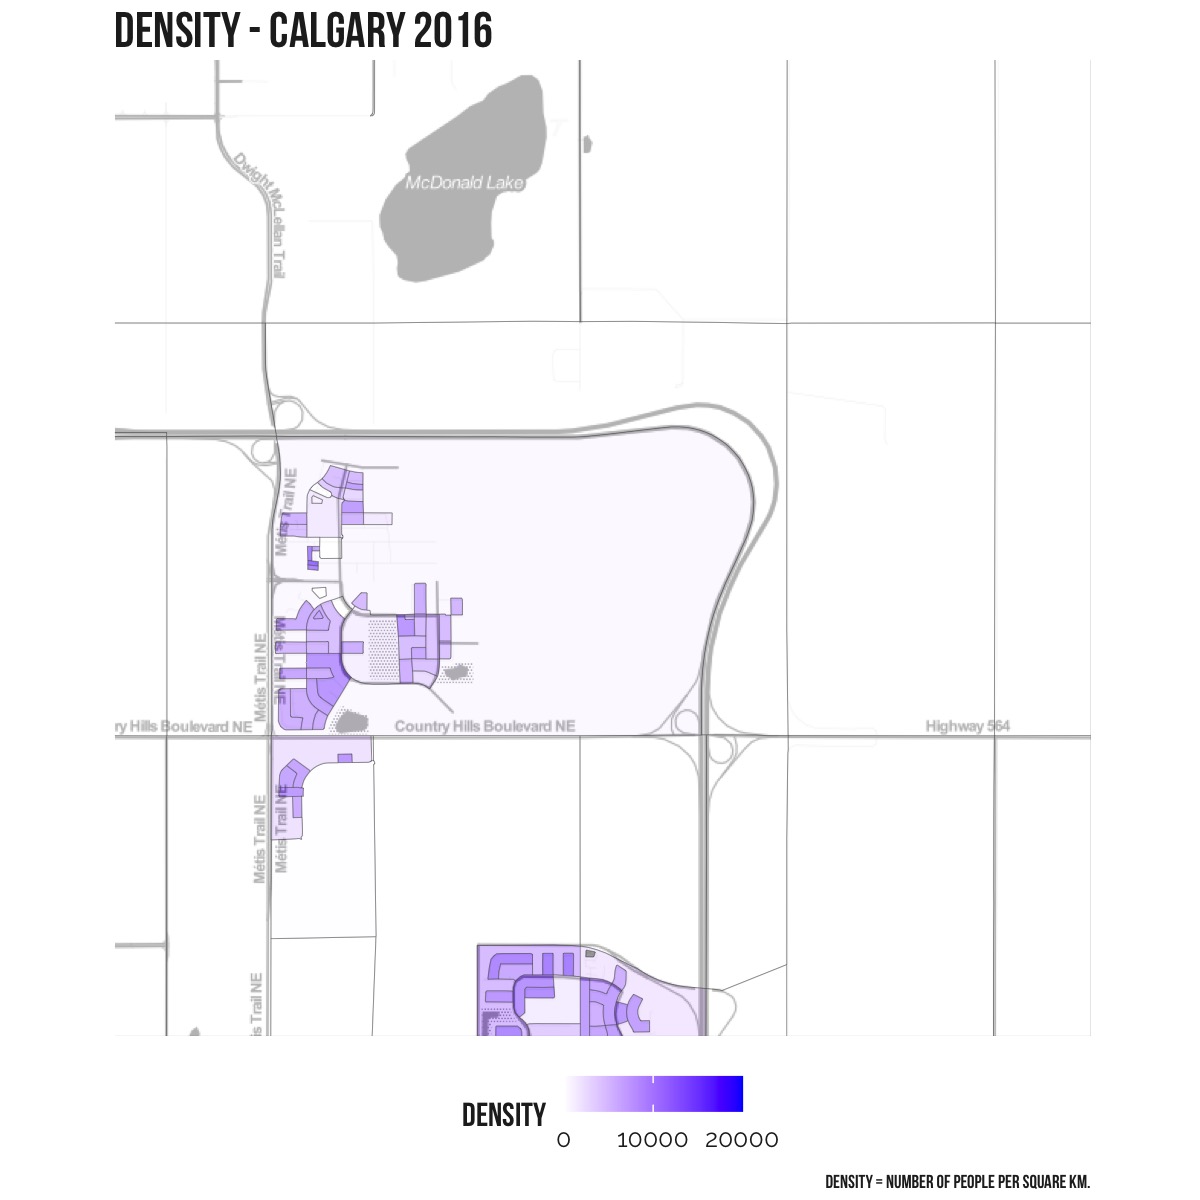
Drag the slider on the map below to see how population density has changed in this area between 2016 and 2021.
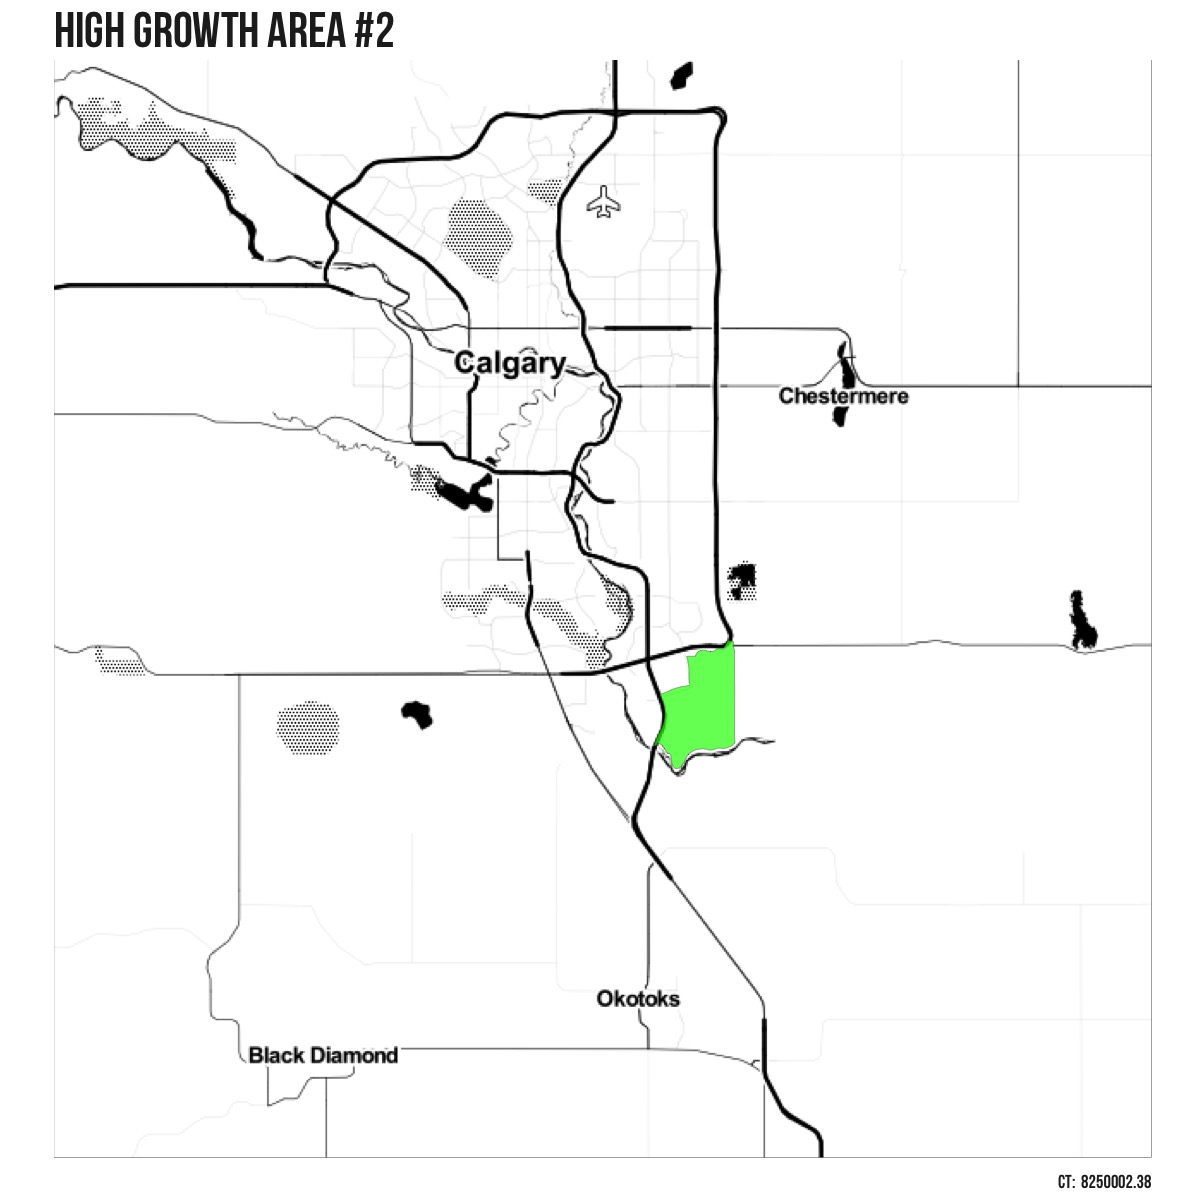
High Growth Area #2
The second highest area of growth is shown in the map to the right.
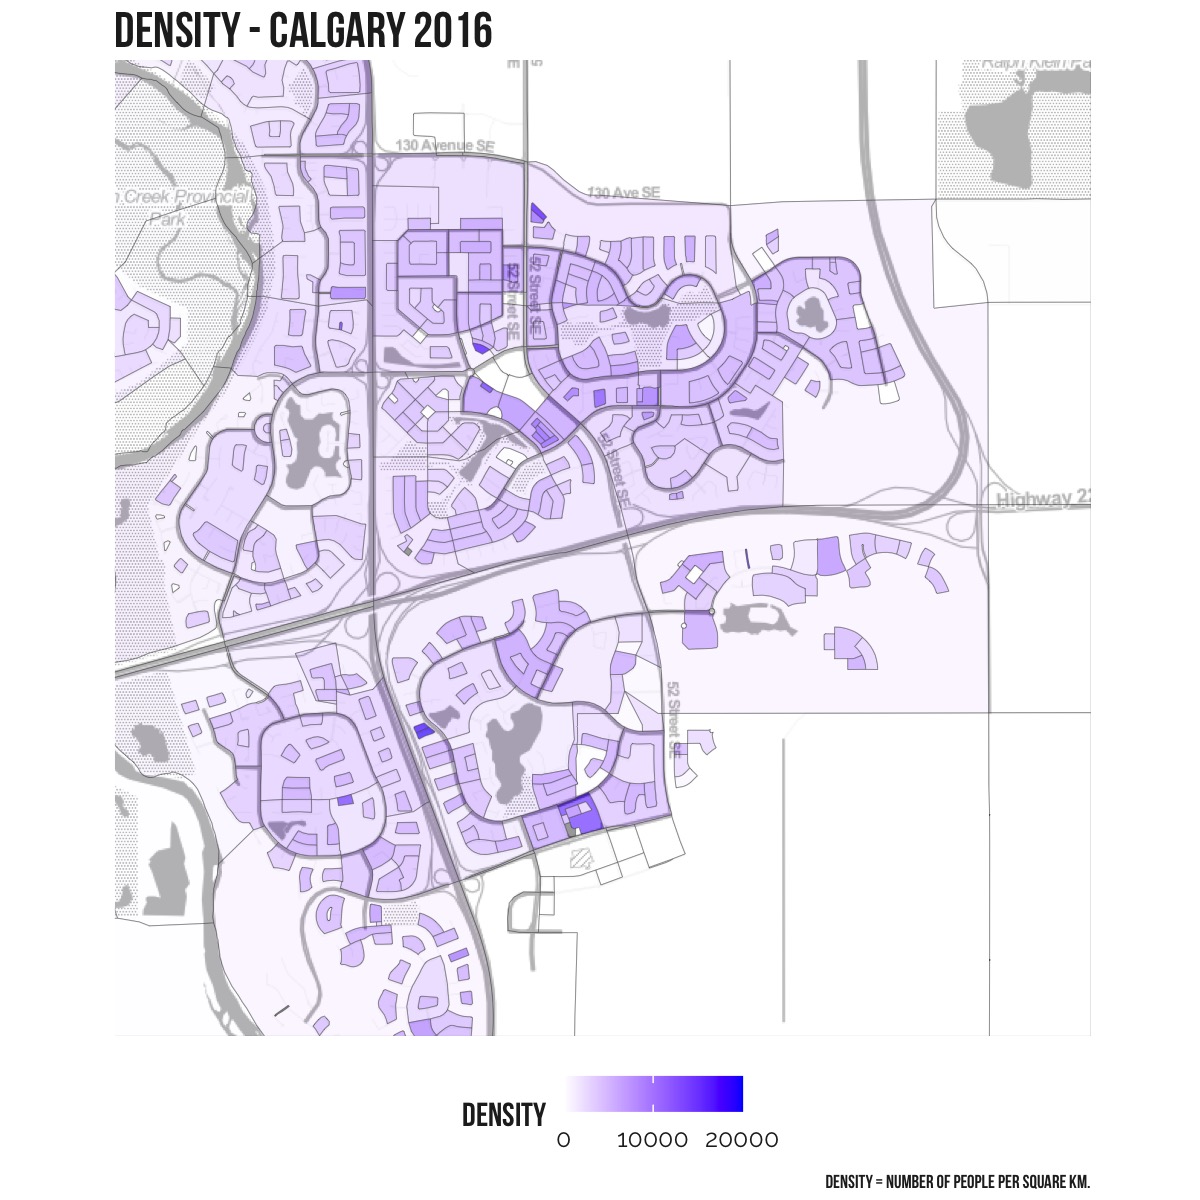
Drag the slider on the map below to see how population density has changed in this area between 2016 and 2021.
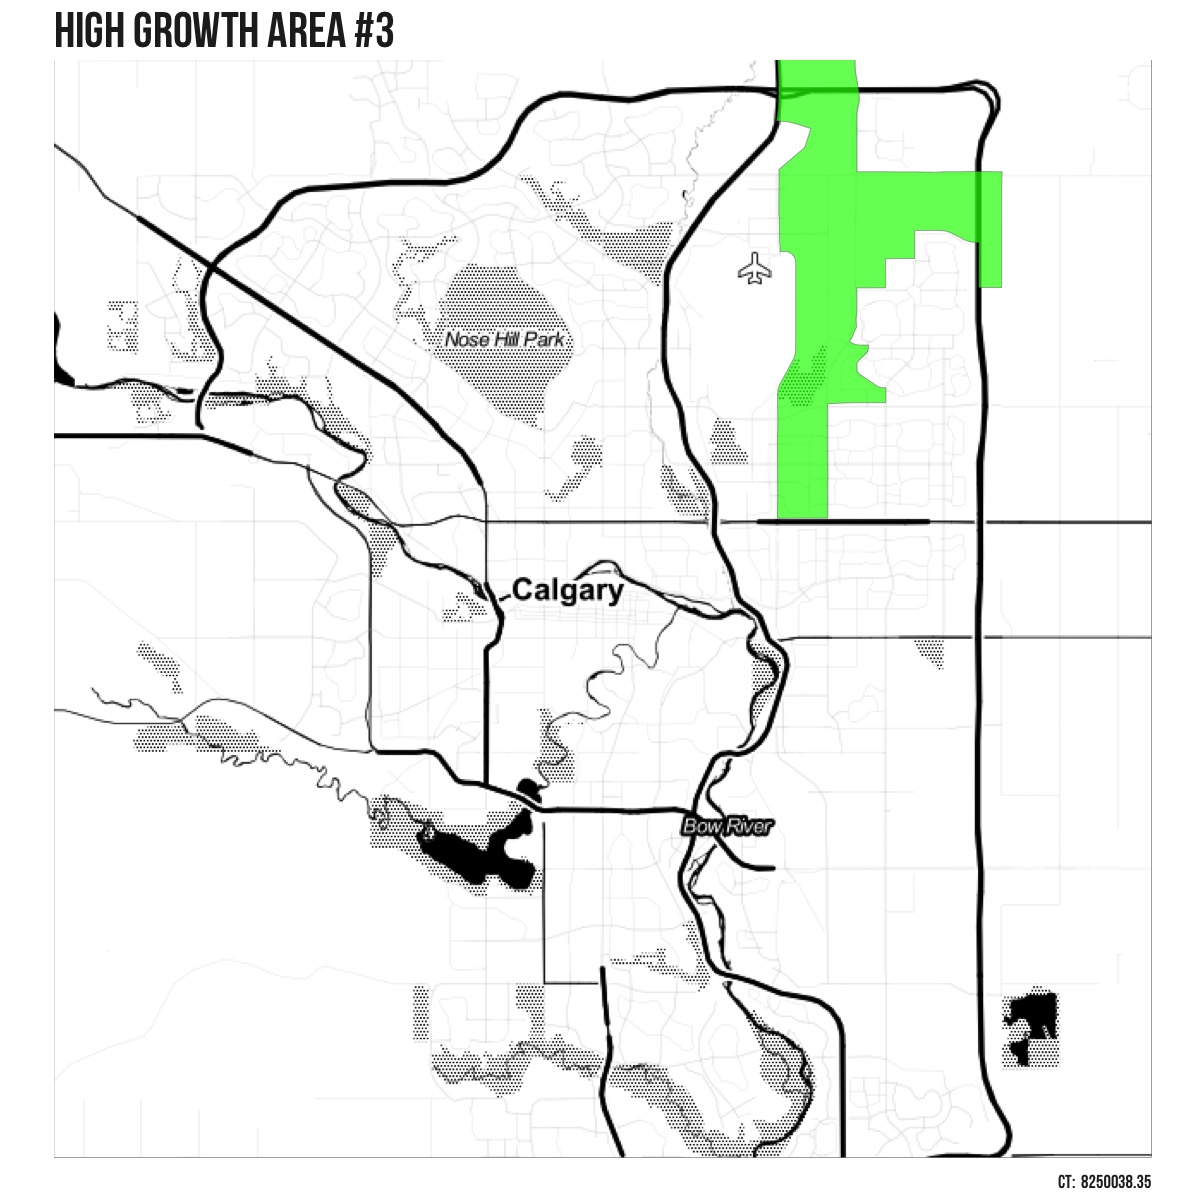
High Growth Area #3
The third highest area of growth (north-east) is shown in the map to the right.
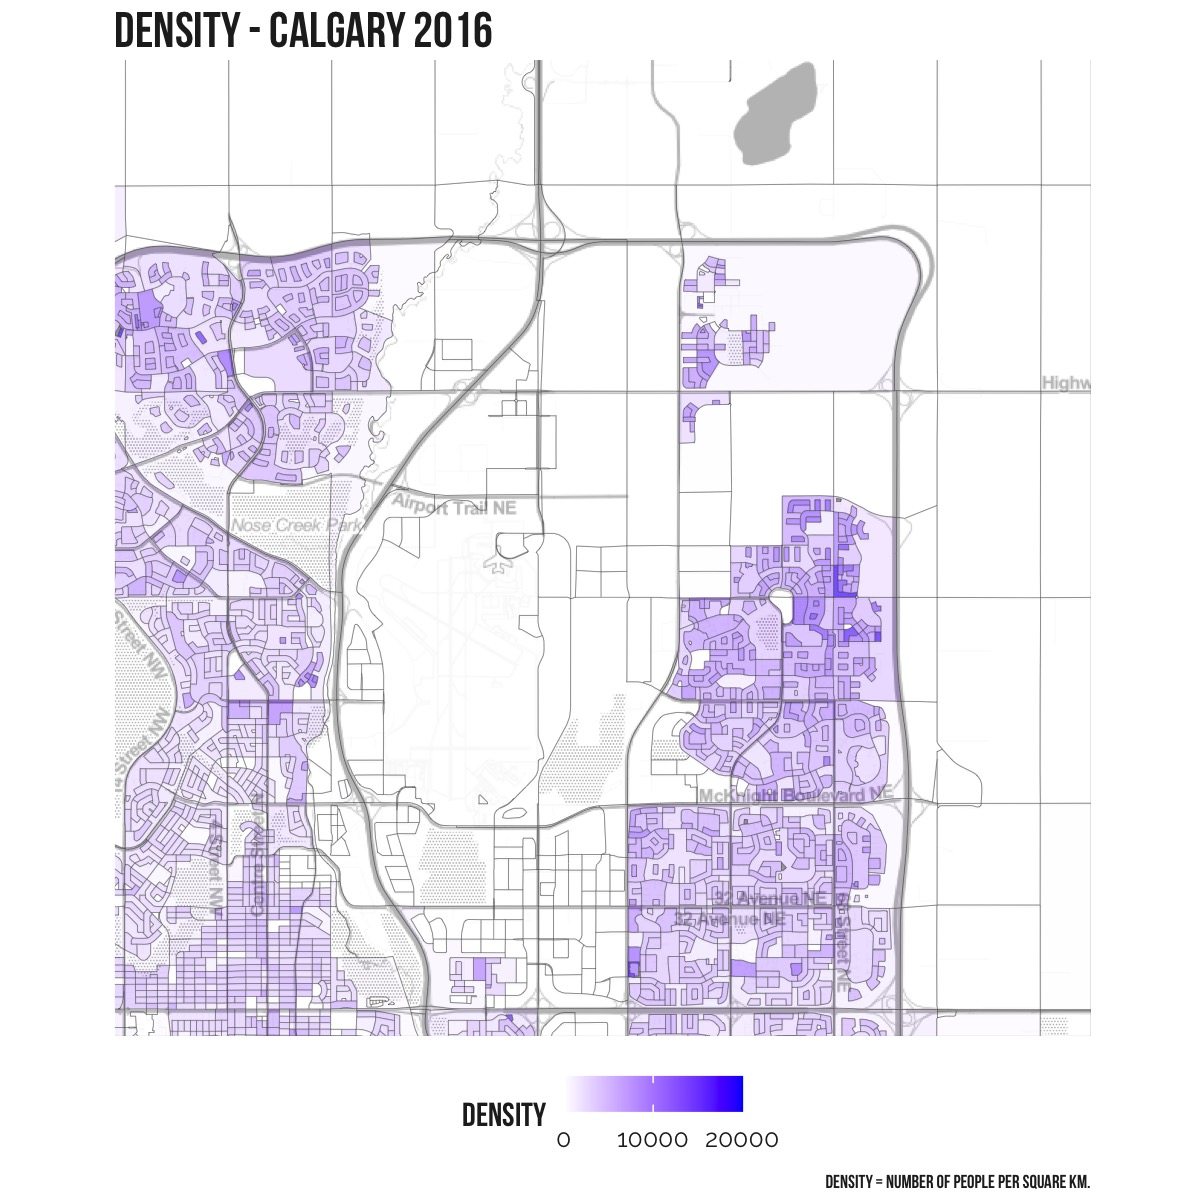
Drag the slider on the map below to see how population density has changed in this area between 2016 and 2021.
What else do you want to see?
Is there other info you want to see? Or other locations? Get in touch – Contact Me
