The 2021 census has been released and that means it is time to dive right into some population trends. Canadian population numbers have changed substantially between 2016 and 2021 and this post will go into more detail about Quebec. You can also read more about the population changes in Nova Scotia, New Brunswick, Newfoundland, and PEI.
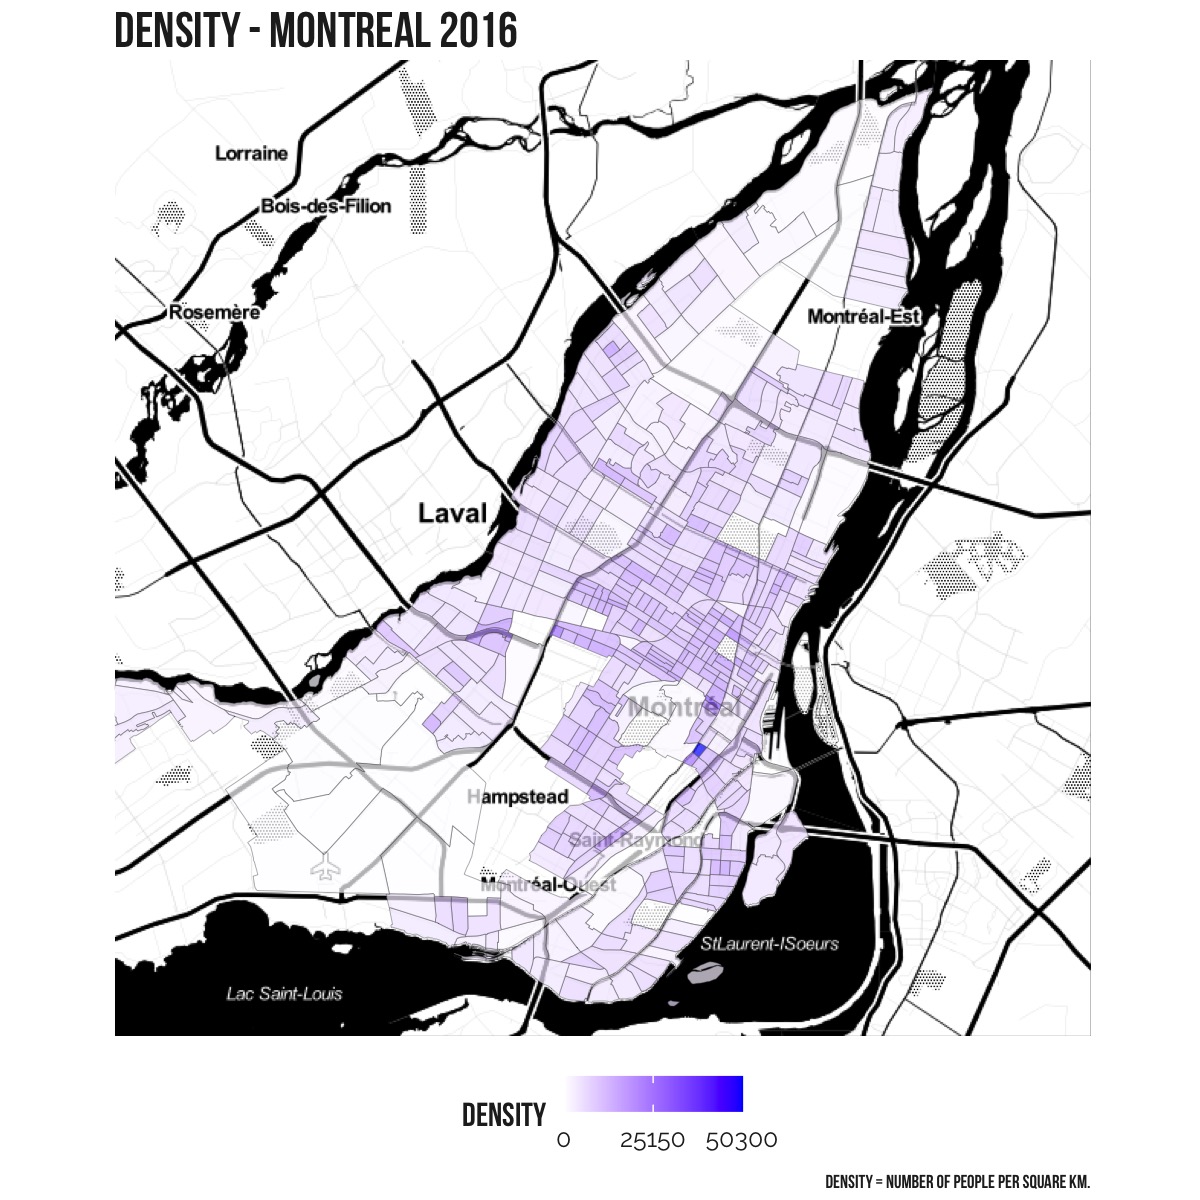
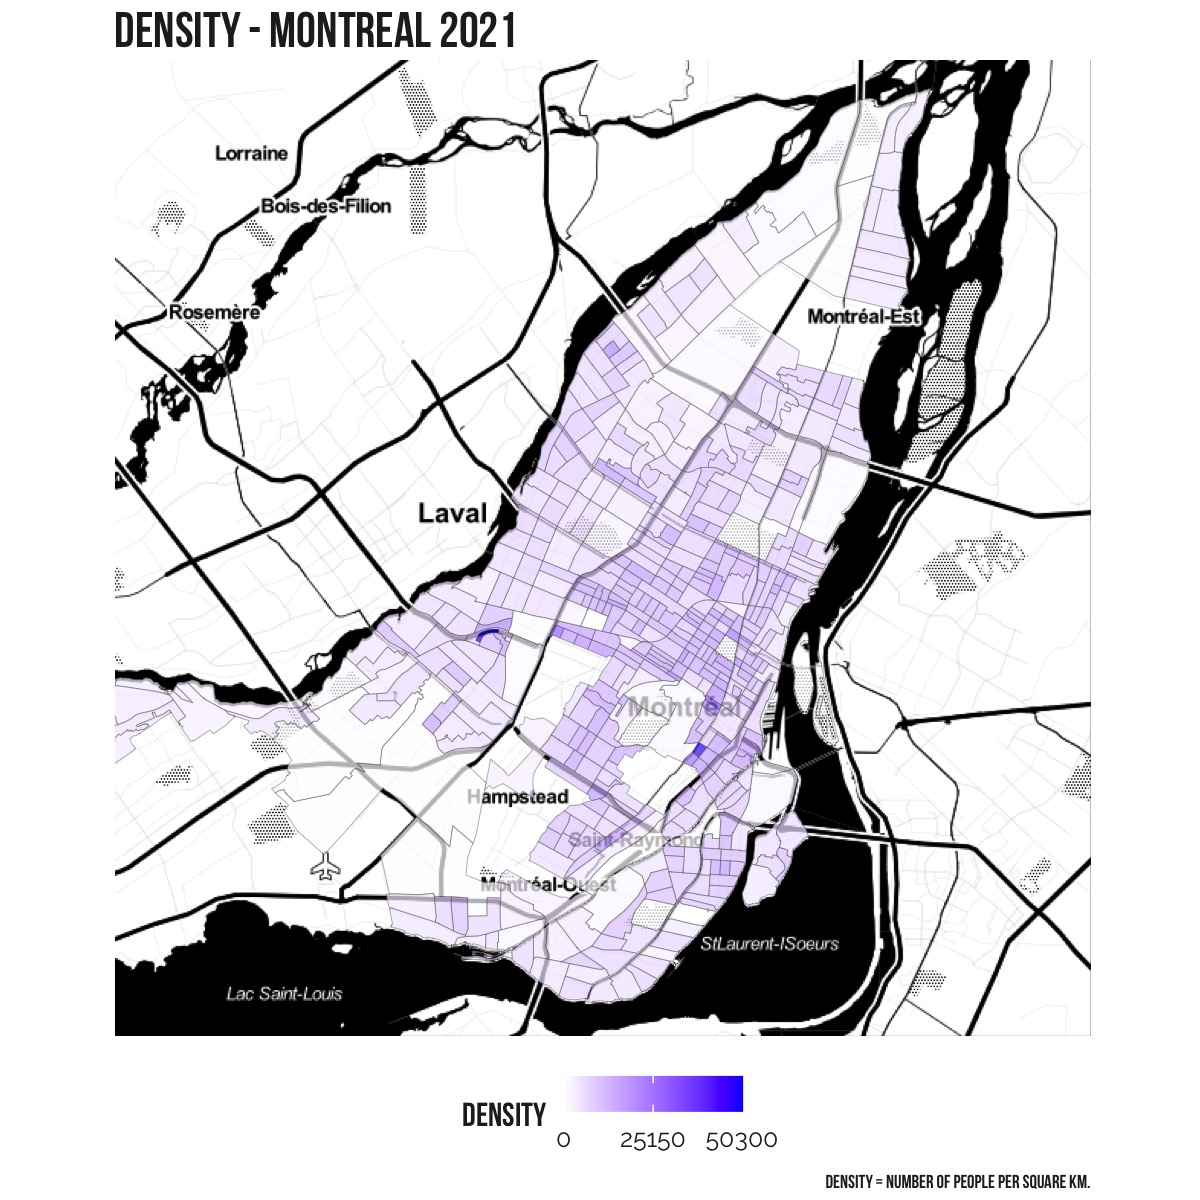
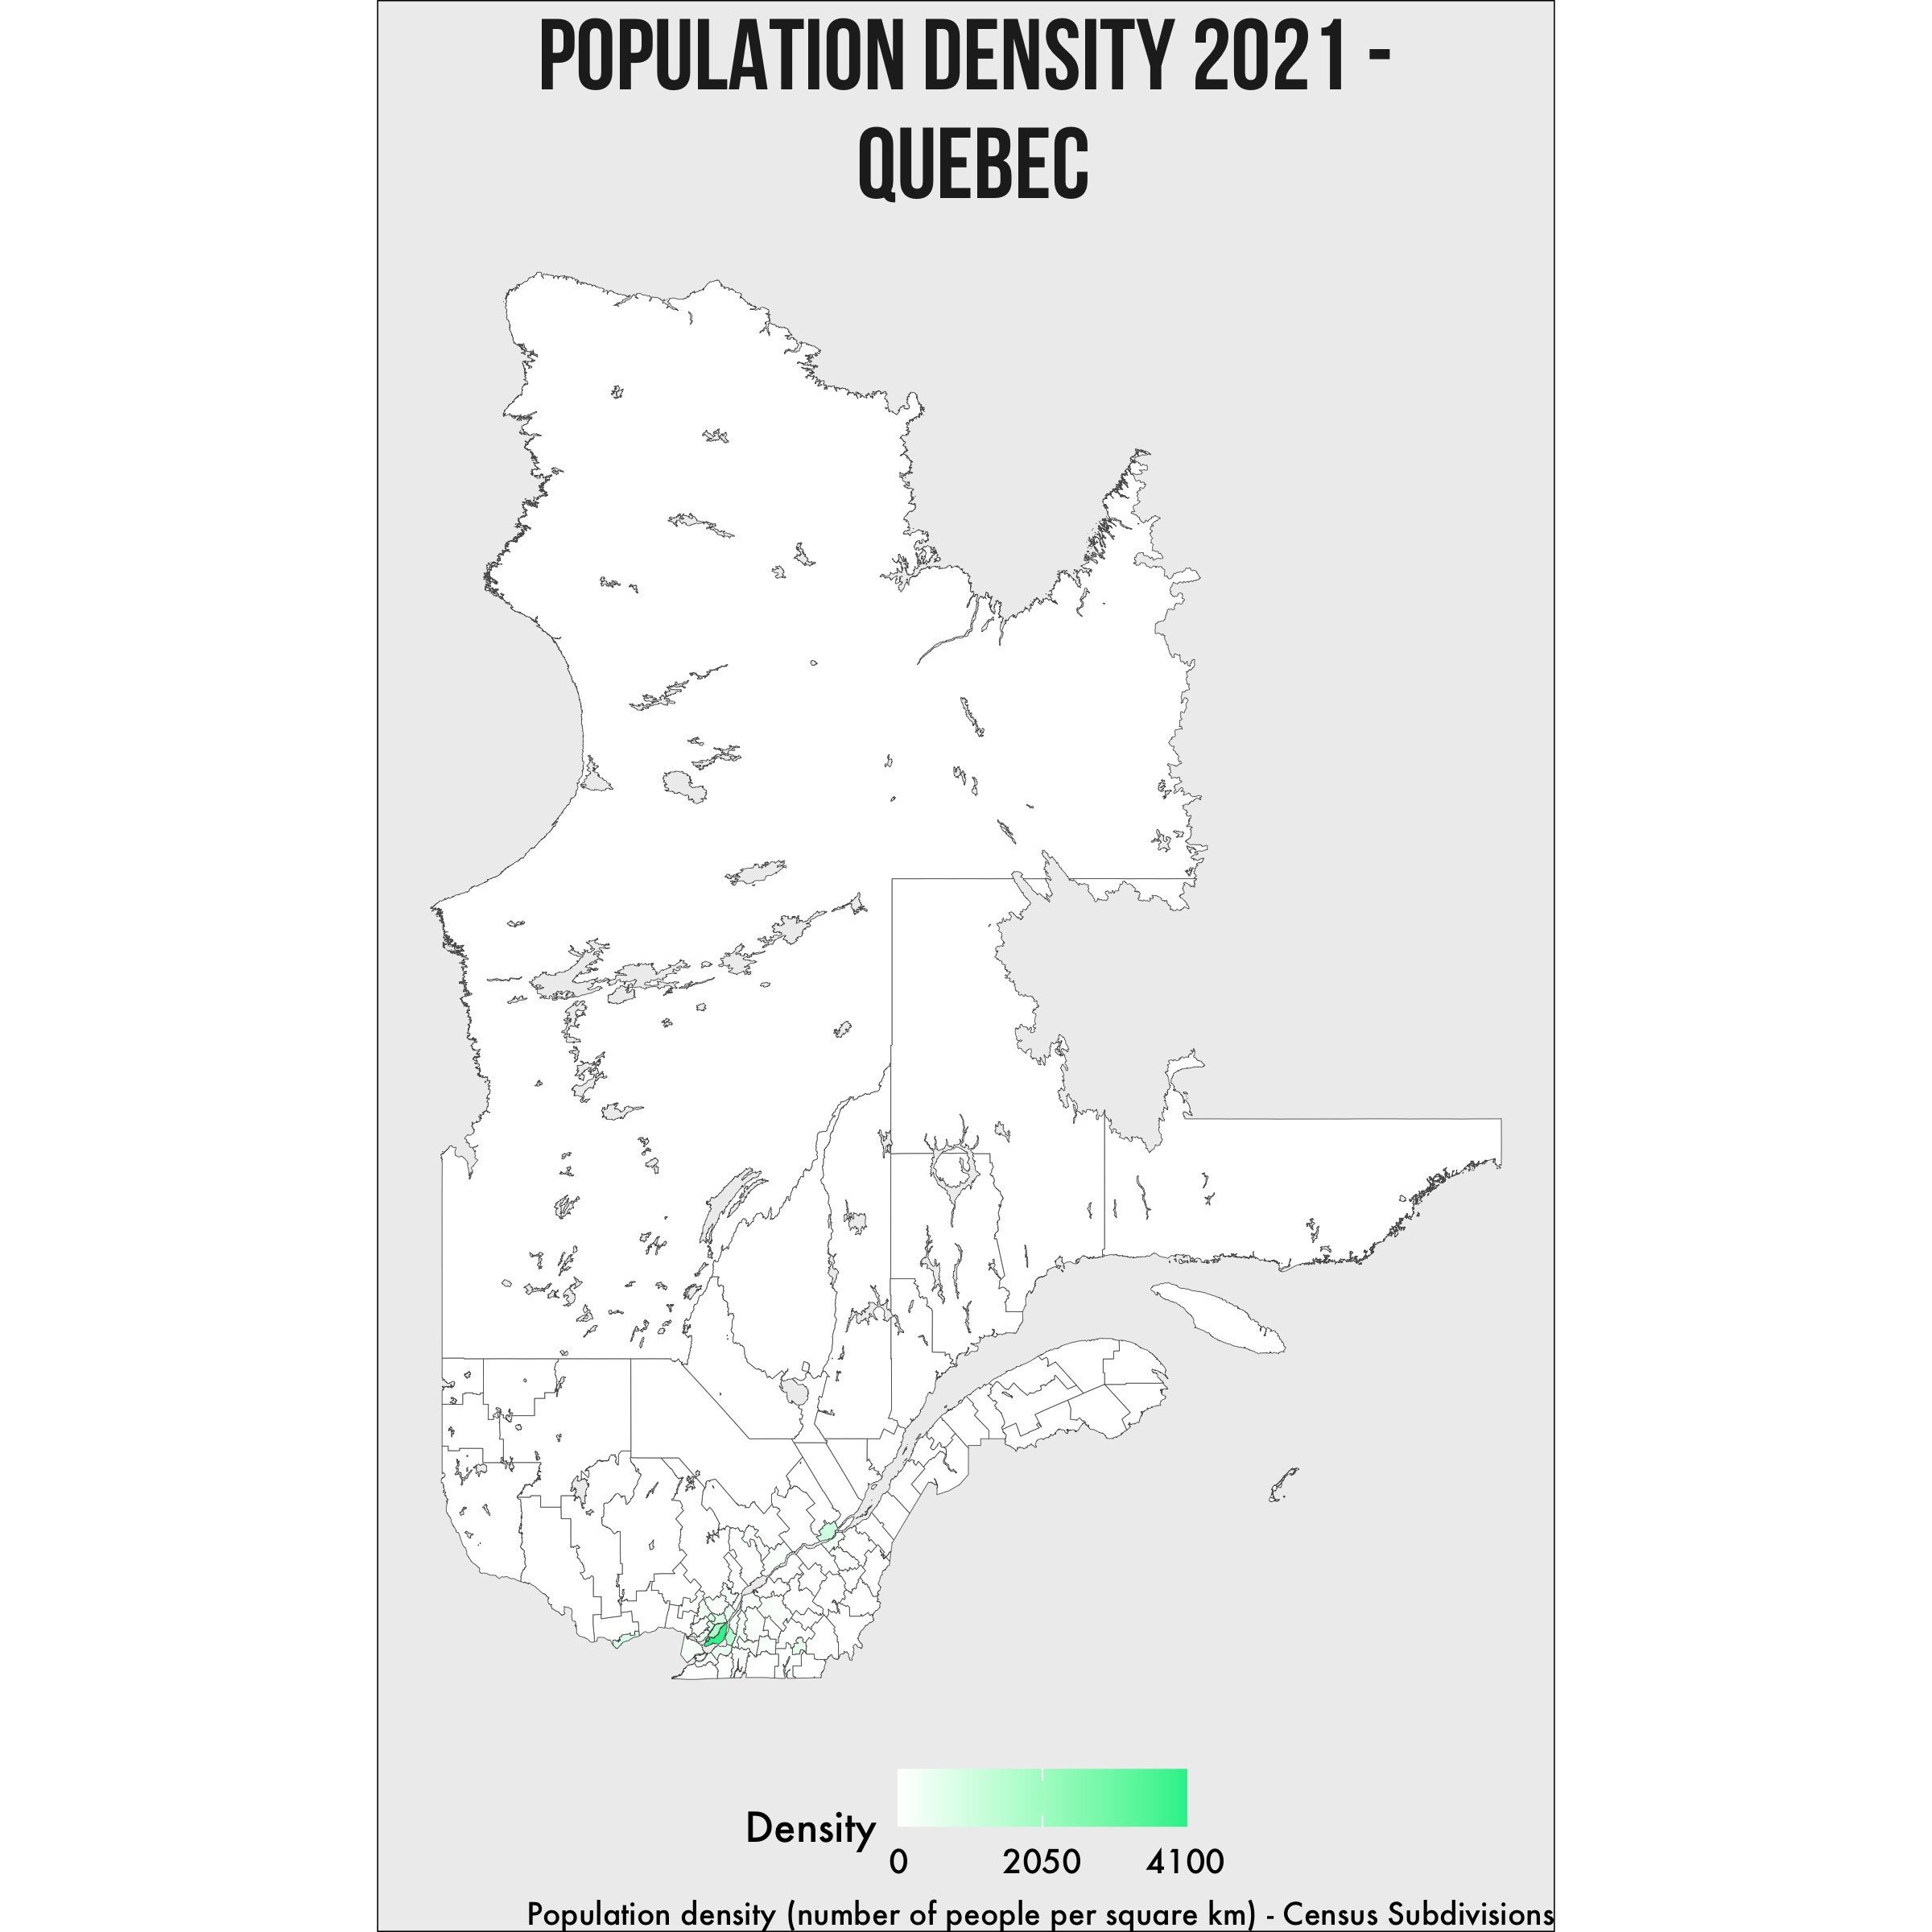
There are 98 different census division in Quebec. A census division is defined by Statistics Canada as a “group of neighbouring municipalities joined together for the purposes of regional planning and managing common services”. The boundaries and population density of each of those 98 census divisions is shown on the map above.
As a province, Quebec’s population grew by 337,472 from 8,164,361 in 2016 to 8,501,833 in 2021. Most of the 98 census divisions in the province saw growth.
Mirabel saw the highest percentage increase in population at nearly 21%, but for absolute increases, Montreal saw the largest increase in population of 62,221 residents from 1,942,044 in 2016 to 2,004,265 in 2021 (3.2%).
This table shows the top 10 census divisions by population growth. For the full list of all 98 census divisions, see the end of this post.
| Region | Population 2016 | Population 2021 | Population Difference | Population Difference Percent |
|---|---|---|---|---|
| Montréal | 1,942,044 | 2,004,265 | 62,221 | 3.2 |
| Longueuil | 415,347 | 436,785 | 21,438 | 5.16 |
| Québec | 569,717 | 588,777 | 19,060 | 3.35 |
| Laval | 422,993 | 438,366 | 15,373 | 3.63 |
| Gatineau | 276,245 | 291,041 | 14,796 | 5.36 |
| Roussillon | 171,443 | 185,568 | 14,125 | 8.24 |
| Vaudreuil-Soulanges | 149,349 | 162,600 | 13,251 | 8.87 |
| Les Moulins | 158,267 | 171,127 | 12,860 | 8.13 |
| La Rivière-du-Nord | 128,170 | 140,394 | 12,224 | 9.54 |
| Sherbrooke | 161,323 | 172,950 | 11,627 | 7.21 |
Which areas have seen high growth?
Of the 98 census subdivisions in Quebec, 76 saw population increases between 2016 and 2021. Montreal saw the largest increase of 62,221, from 1,942,044 residents in 2016 to 2,004,265 residents in 2021 for an increase of 3.2%.
The next level down to consider is the census subdivision, which Statistics Canada defines as “the general term for municipalities”.
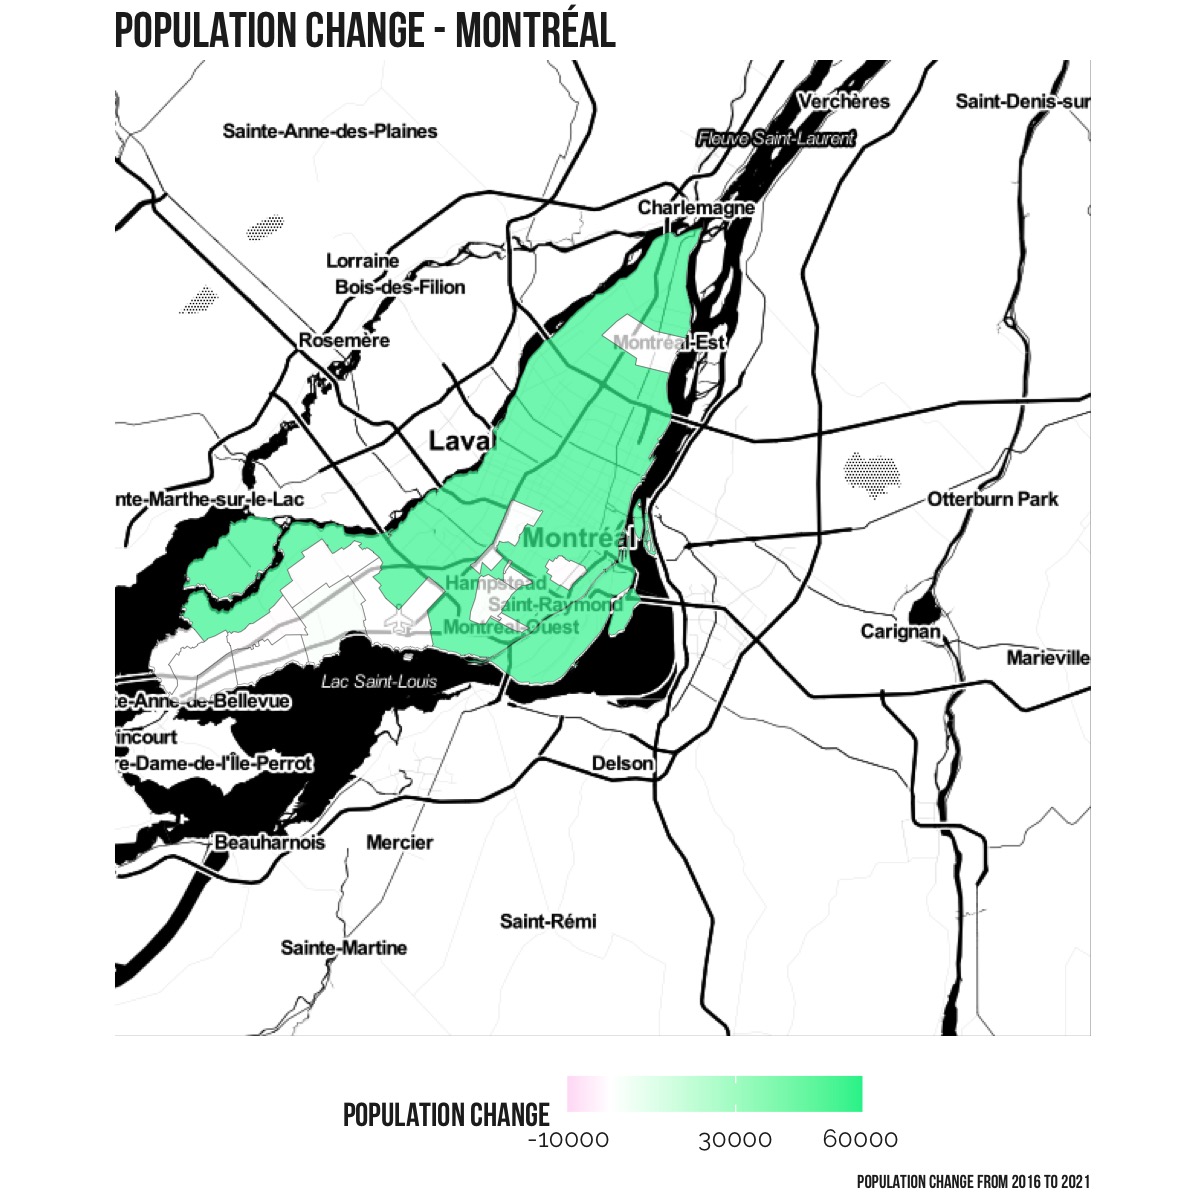
High growth area #1
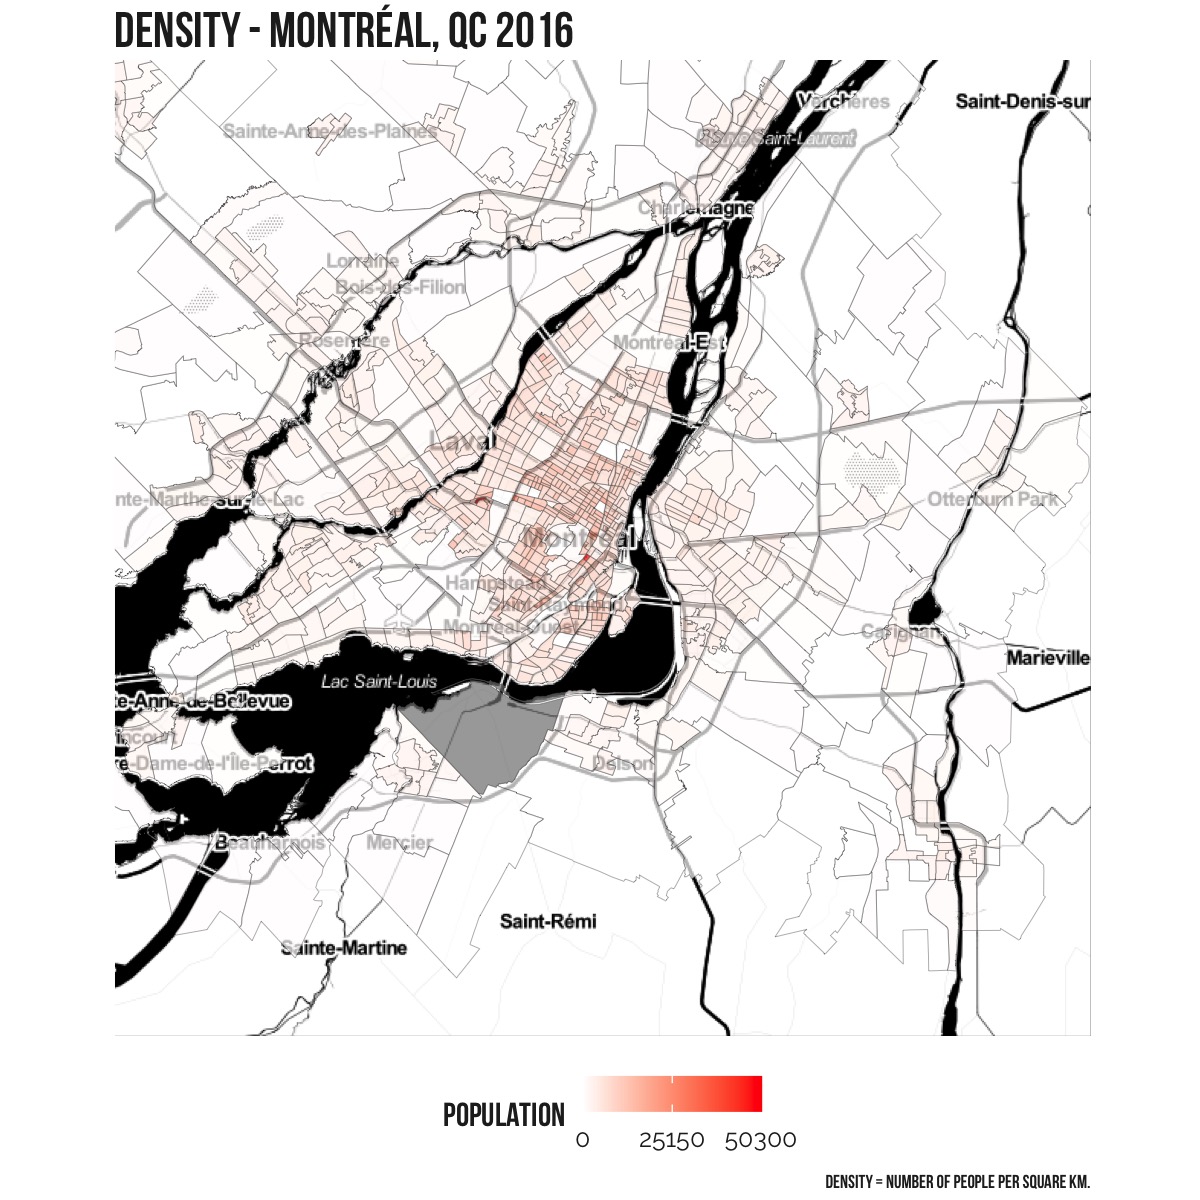
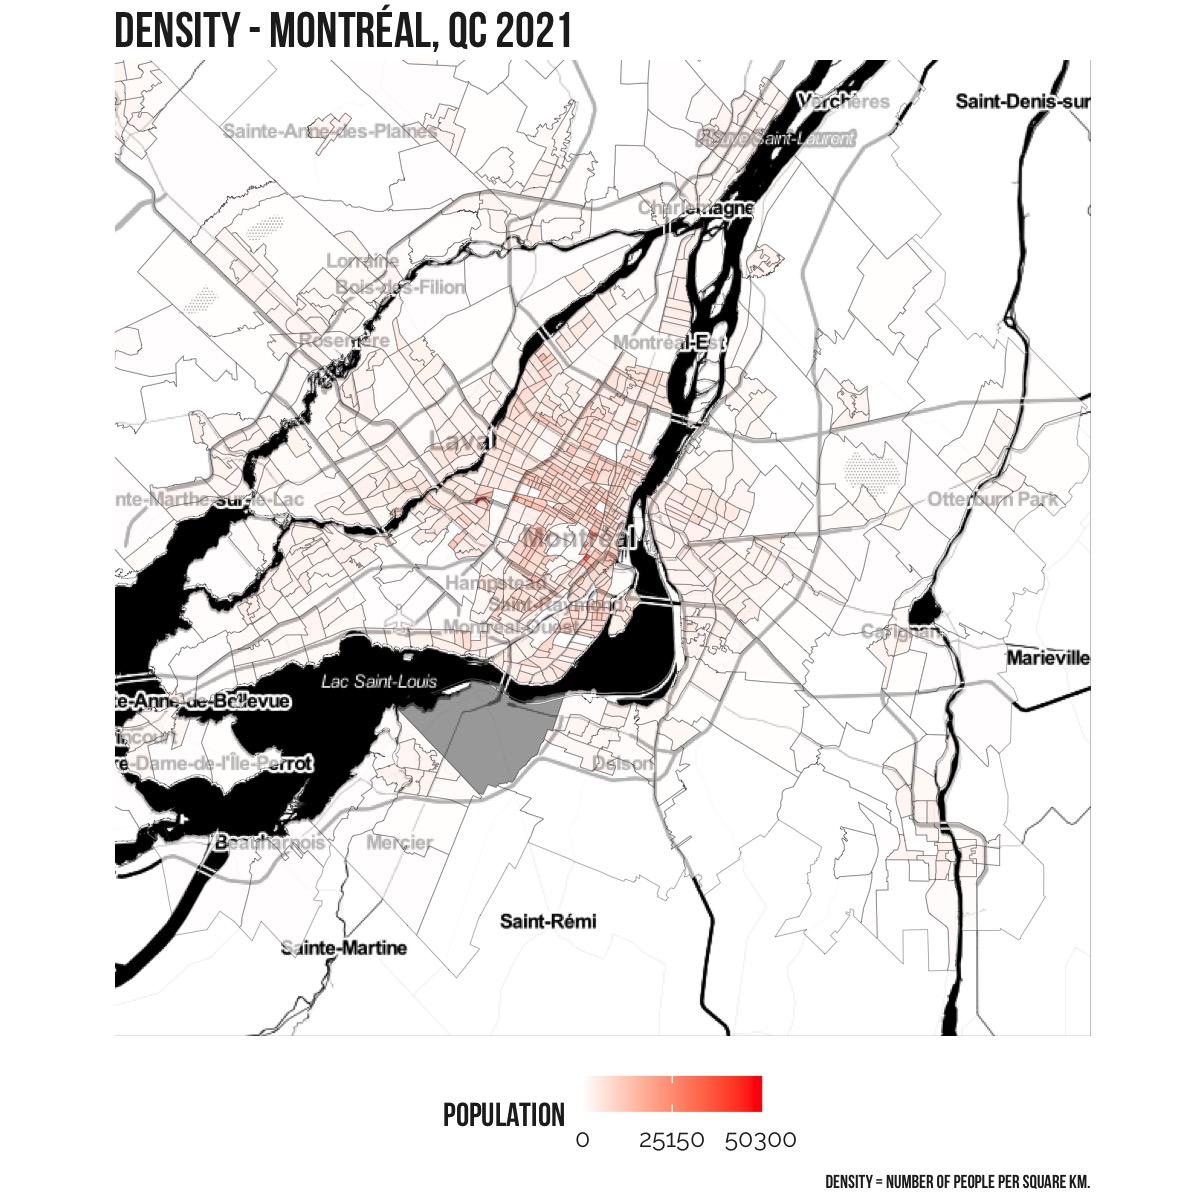
The census subdivision that includes much of the city of Montreal saw the most amount of growth within this census division. This area grew by 60,356 residents, from 1,702,593 in 2016 to 1,762,949 in 2021.
High growth area #2
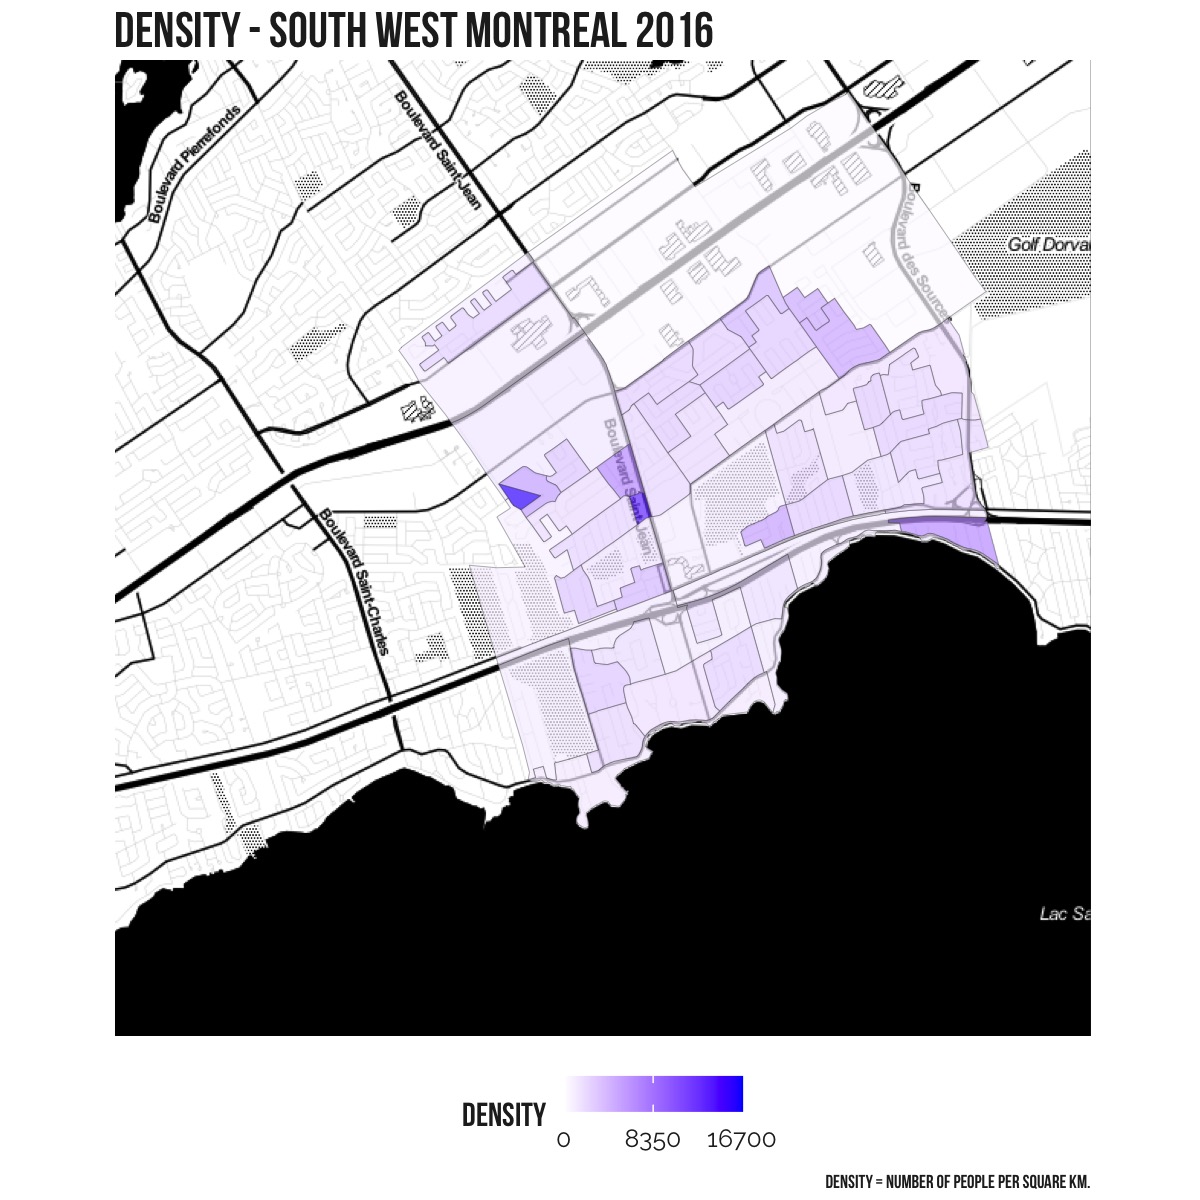
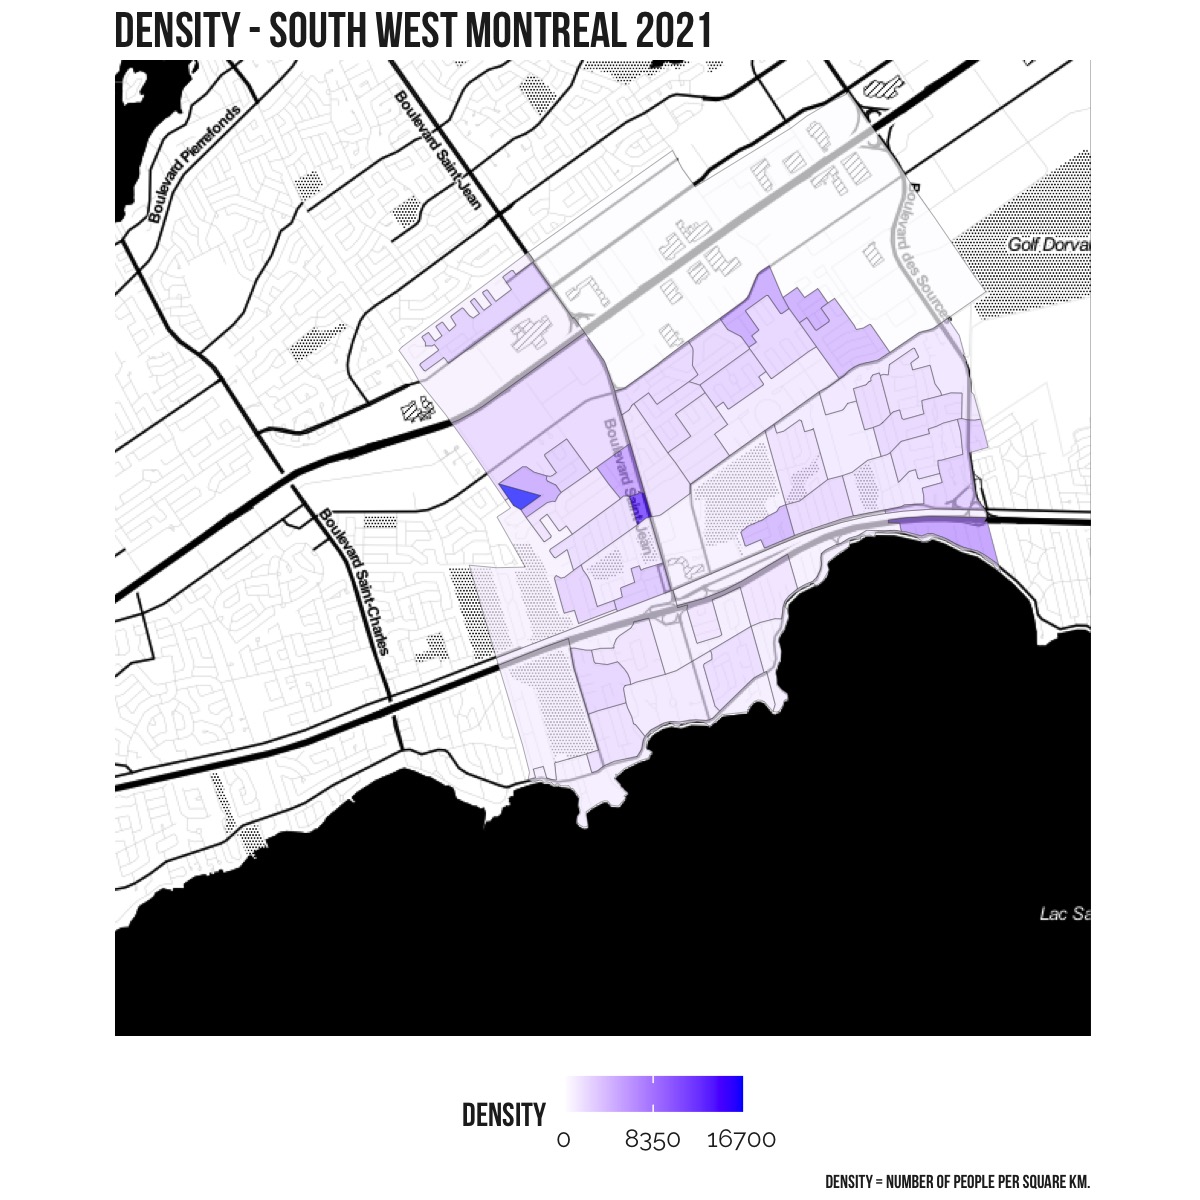
The census subdivision in the south west of the city of Montreal (including Lakeside Heights) saw the second highest amount of growth within this census division. This area grew by 2,108 residents, from 31,380 in 2016 to 33,488 in 2021.
High growth area #3
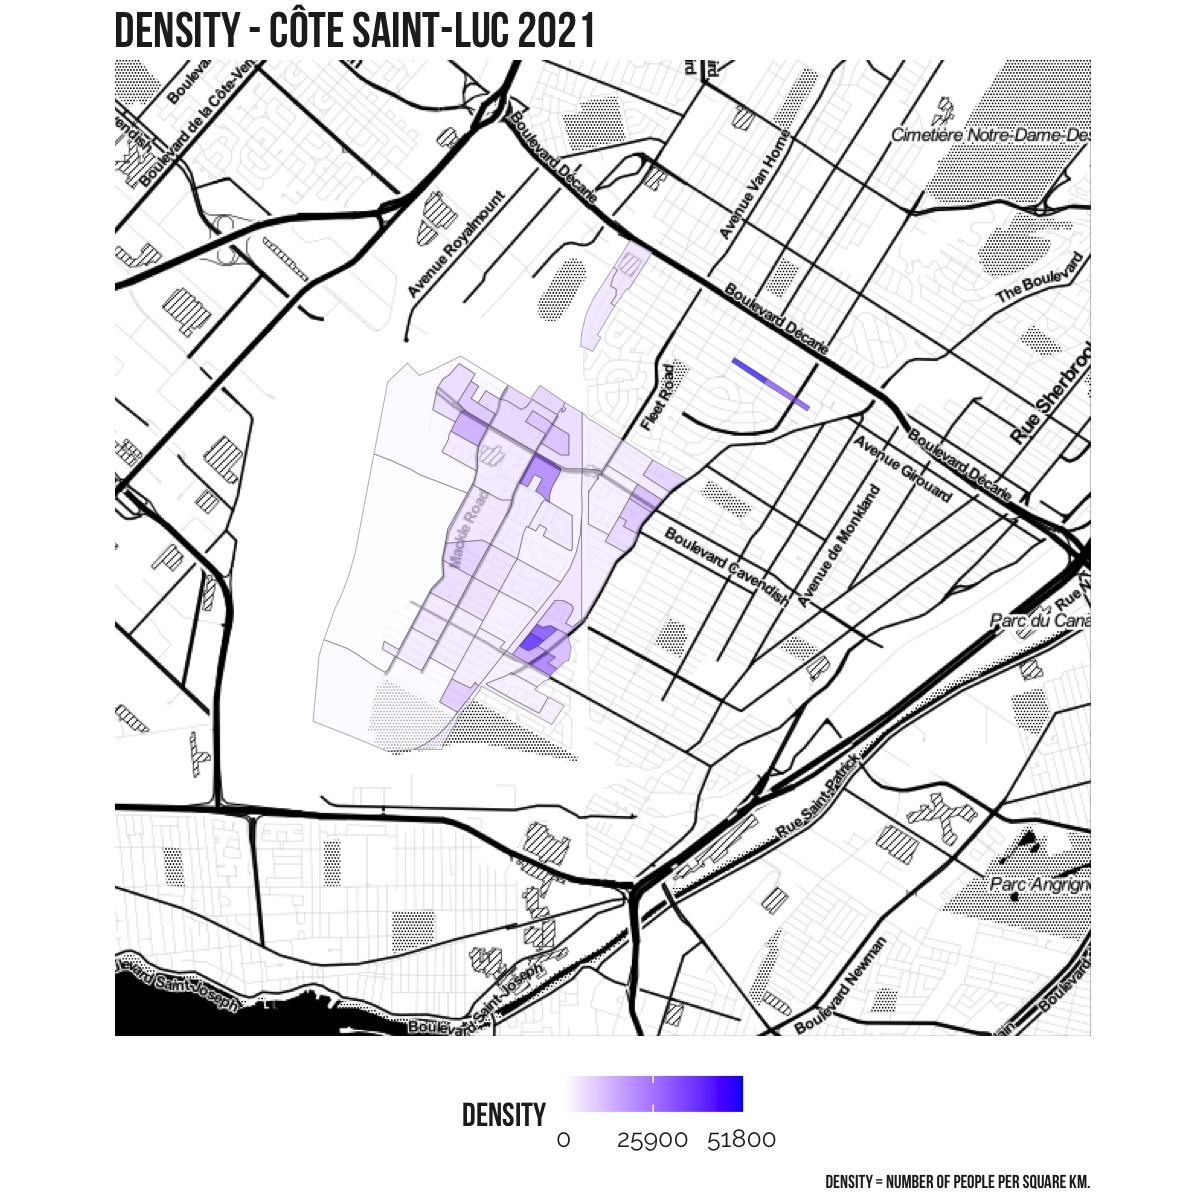
The census subdivision of Côte Saint-Luc in the city of Montreal saw the third highest amount of growth within this census division. This area grew by 2,056 residents, from 32,448 in 2016 to 34,504 in 2021.

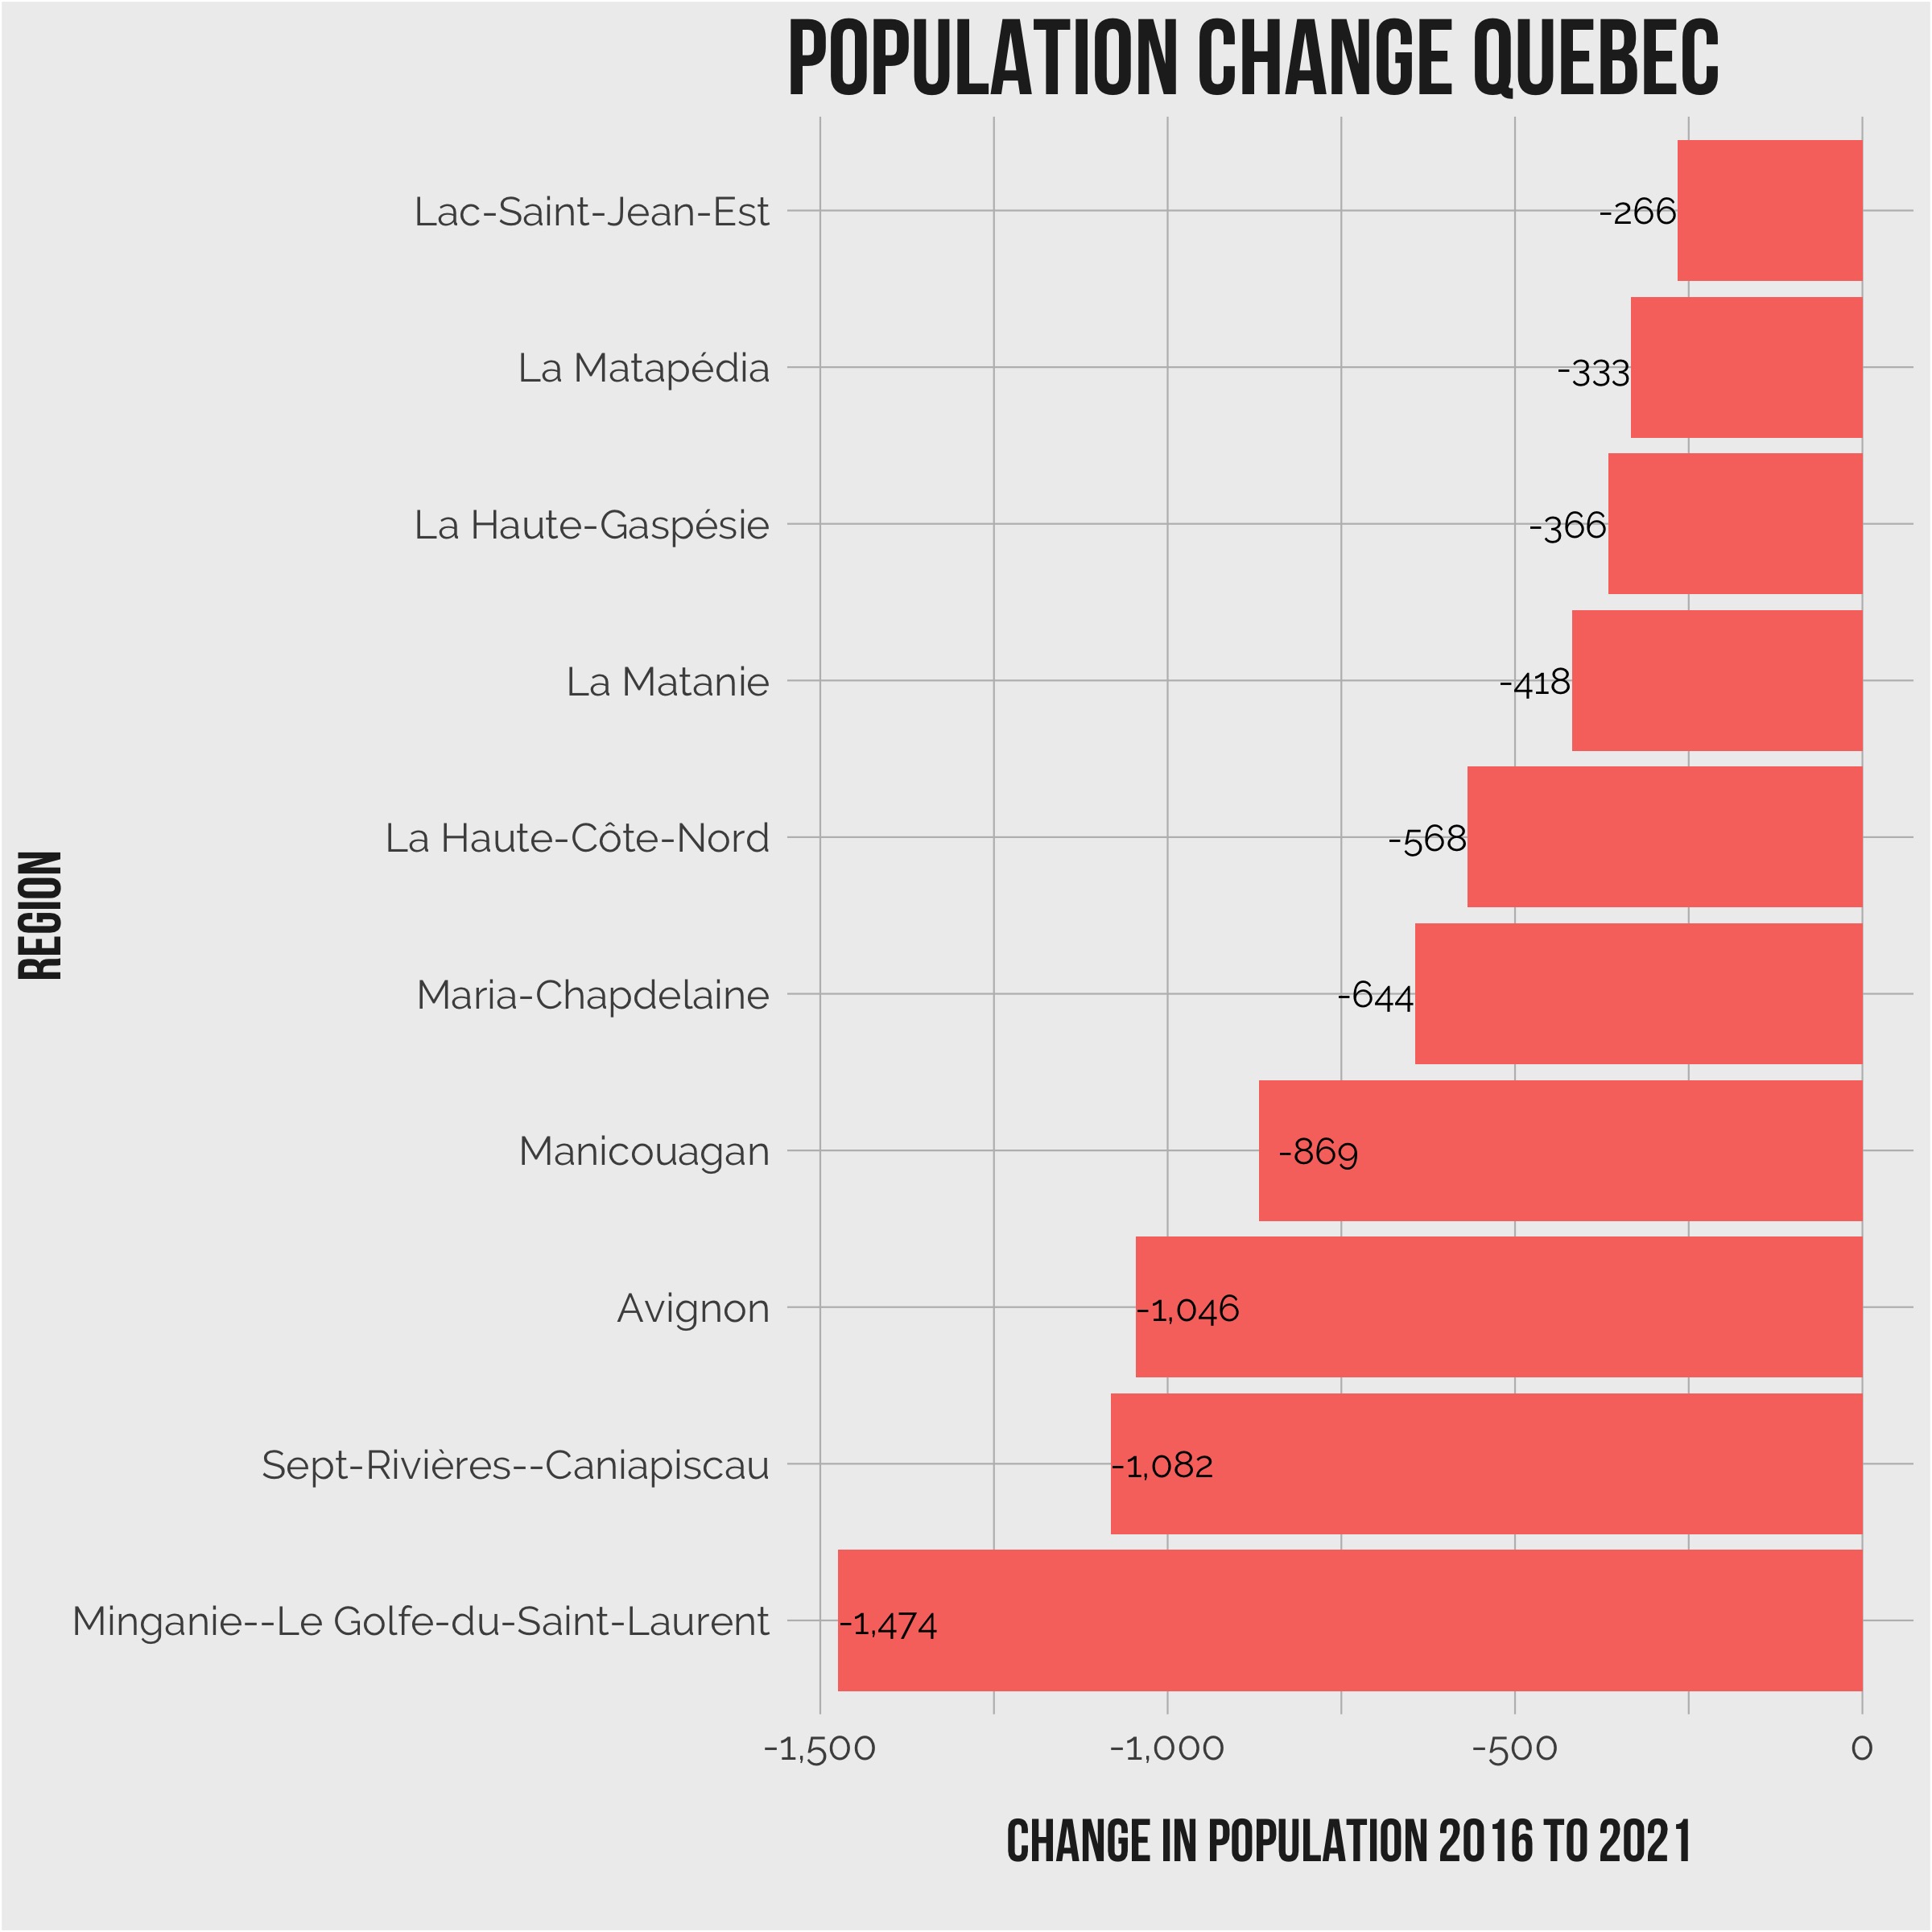
Which areas have seen the lowest growth?
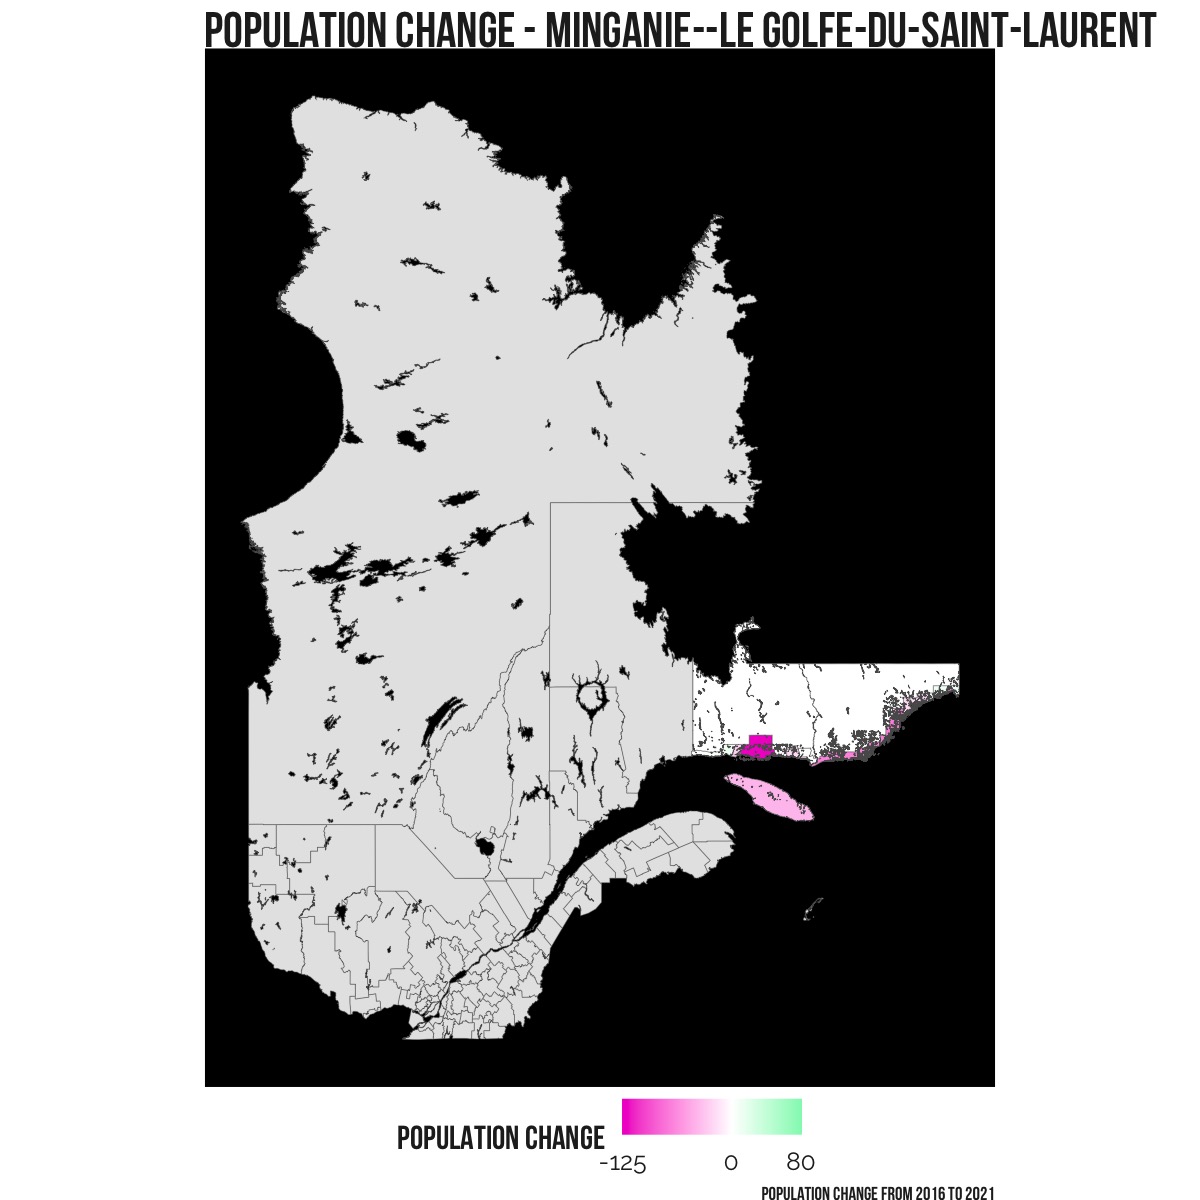
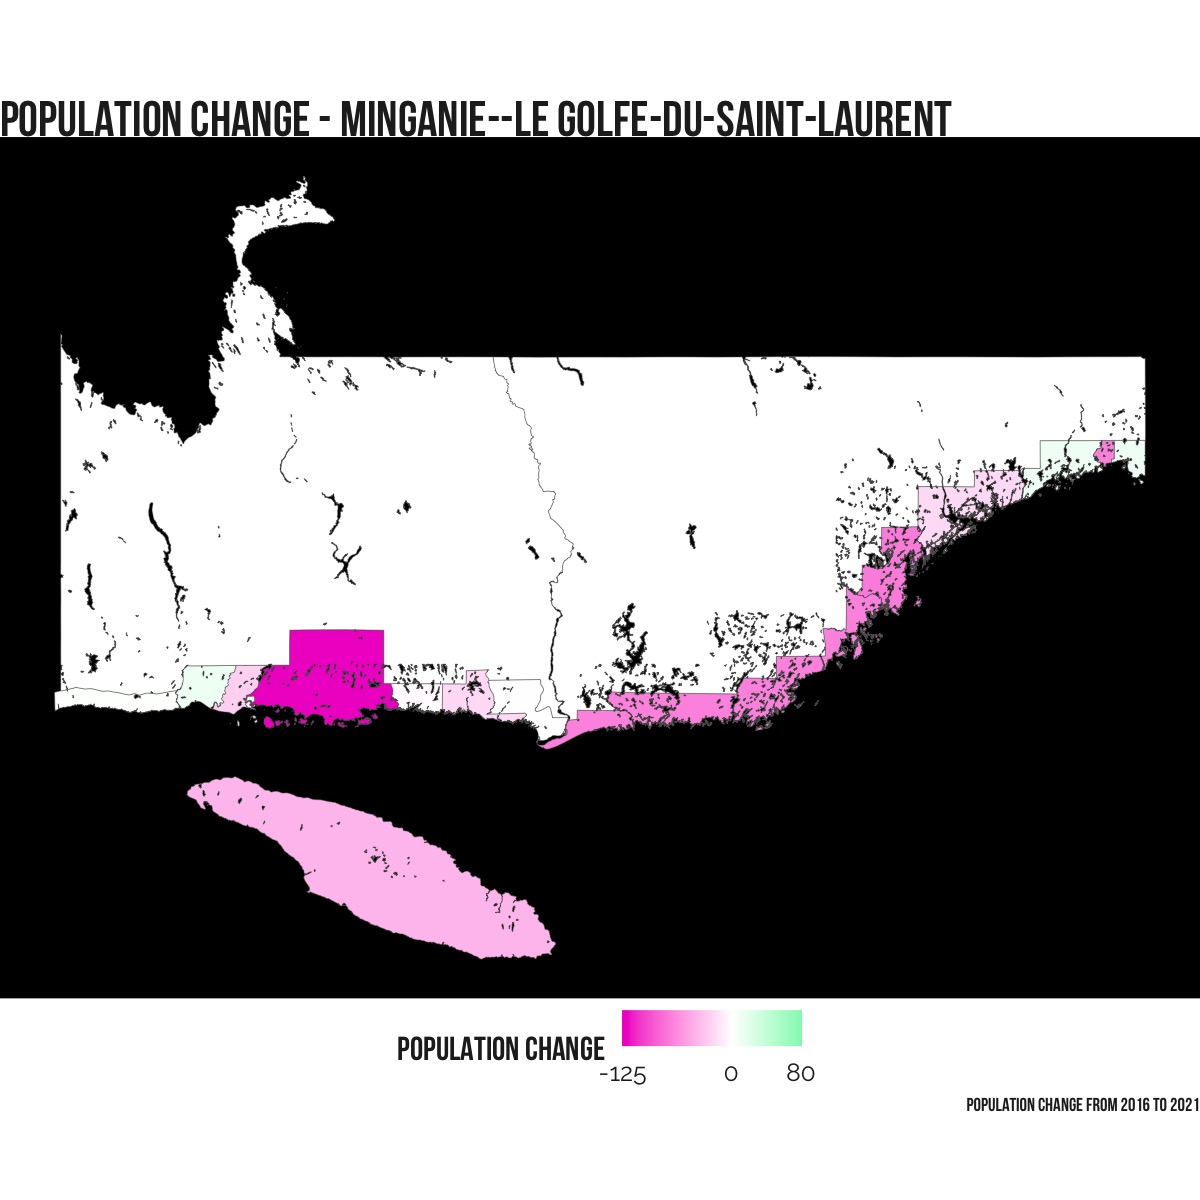
22 of the 98 census divisions in Quebec saw a reduction in overall population. The highest decline both in terms of number of residents and as a percentage was Minganie–Le Golfe-du-Saint-Laurent. This area saw a reduction of over 13%, or 1,474 people.
Population changes in major cities
There are 32 census metropolitan areas in Quebec. Statistics Canada defines a census metropolitan area (CMA) as “…one or more adjacent municipalities centred on a population centre (known as the core). A CMA must have a total population of at least 100,000 of which 50,000 or more must live in the core.”
The three largest CMAs in Quebec by population are Montreal, Quebec City, and Sherbrooke. Technically Ottawa/Gatineau is the second largest CMA, but most of the population is actually in Ontario.
CMA – Montreal
The census metropolitan area (CMA) of Montreal grew by 187,658 residents from 4,104,074 in 2016 to 4,291,732 in 2021.
CMA – Quebec City
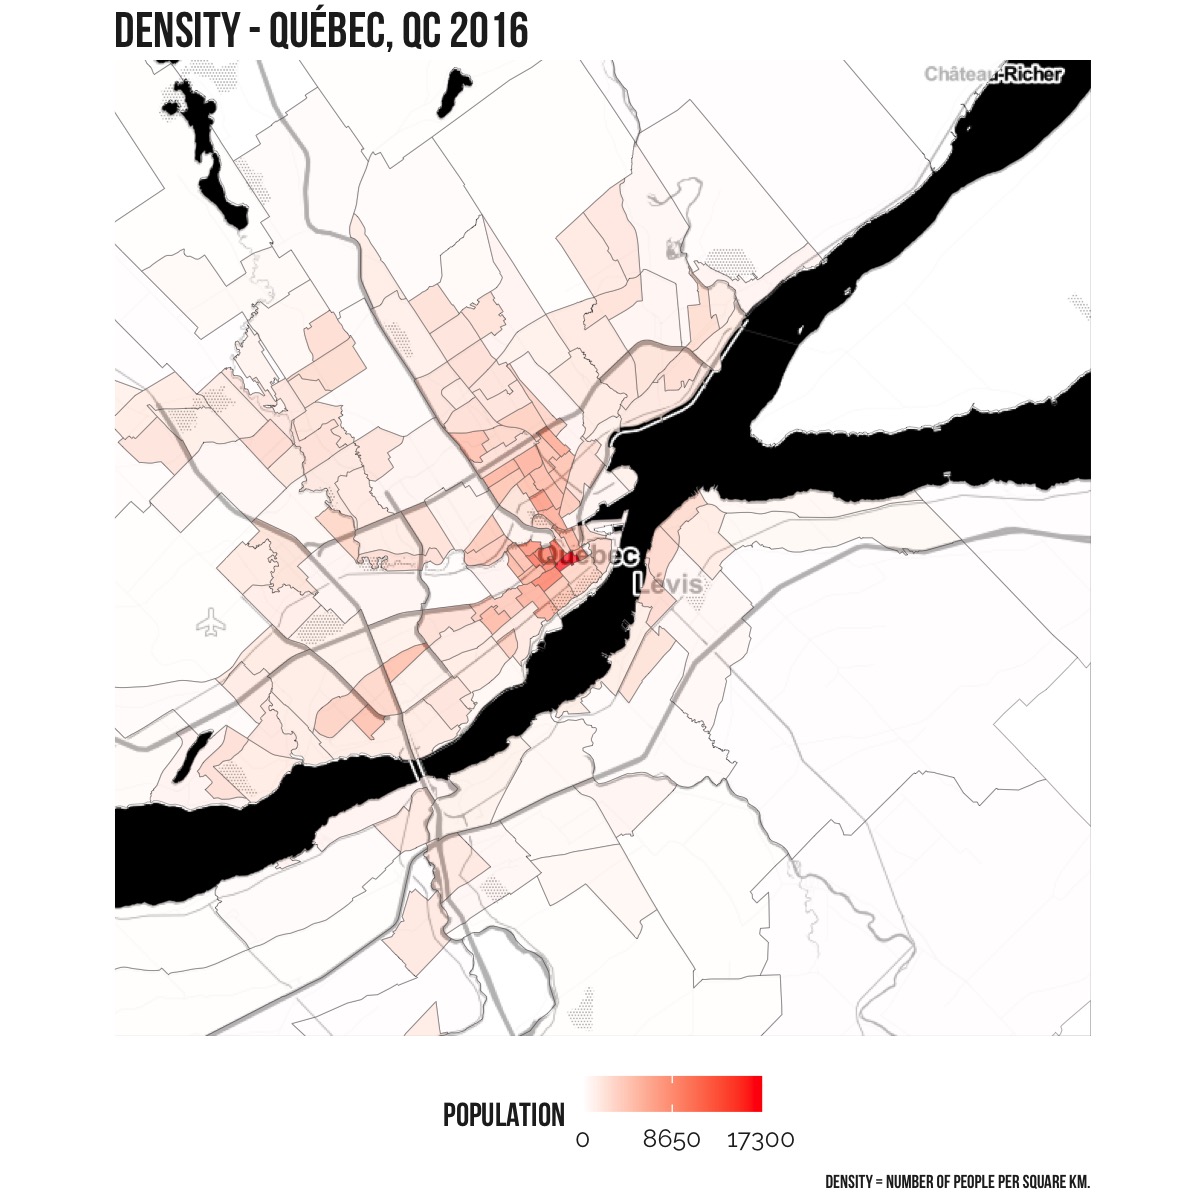
The census metropolitan area (CMA) of Quebec City grew by 32,905 residents from 806,406 in 2016 to 839,311 in 2021.

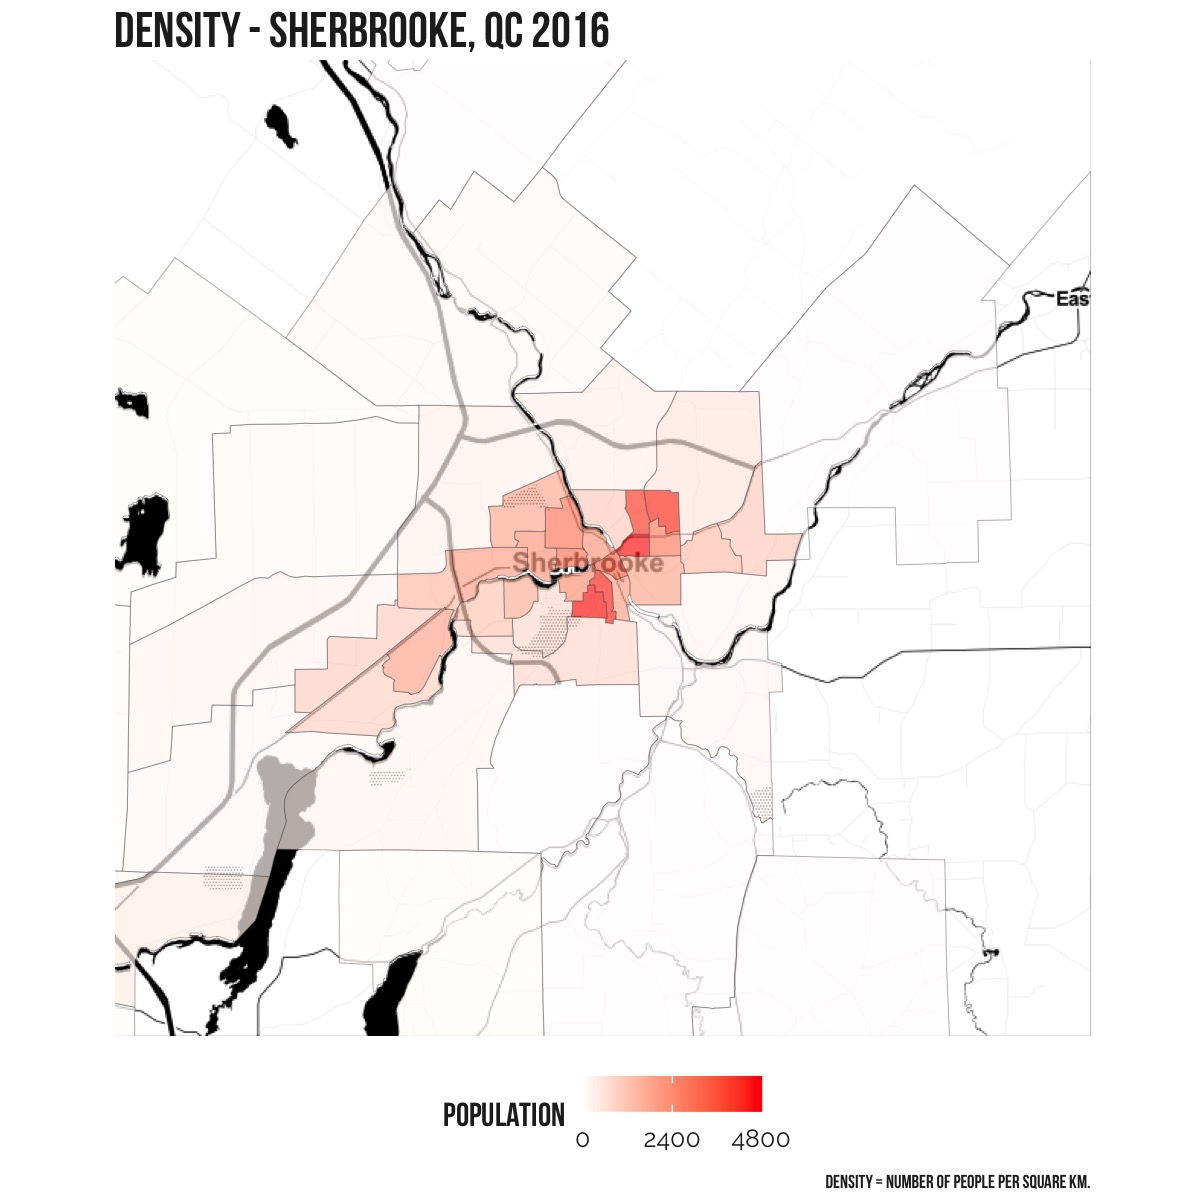
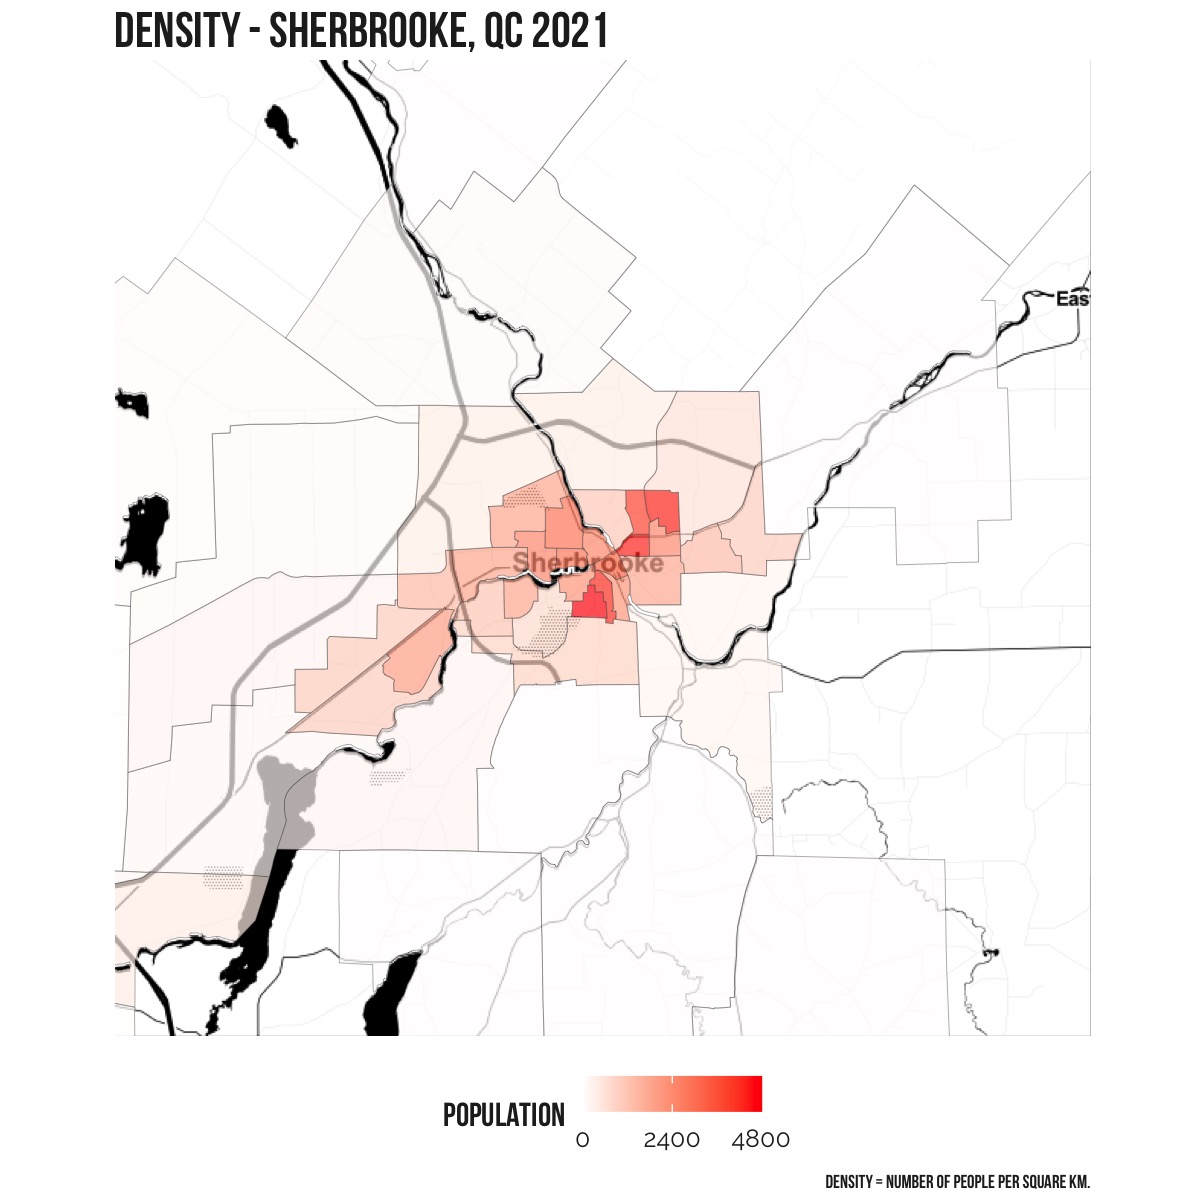
CMA – Sherbrooke
The census metropolitan area (CMA) of Sherbrooke grew by 15,293 residents from 212,105 in 2016 to 227,398 in 2021.
Overall population density
Full list of census divisions in Quebec and population changes.
| Region | Population 2016 | Population 2021 | Population Difference | Population Difference Percent |
|---|---|---|---|---|
| Montréal | 1,942,044 | 2,004,265 | 62,221 | 3.2 |
| Longueuil | 415,347 | 436,785 | 21,438 | 5.16 |
| Québec | 569,717 | 588,777 | 19,060 | 3.35 |
| Laval | 422,993 | 438,366 | 15,373 | 3.63 |
| Gatineau | 276,245 | 291,041 | 14,796 | 5.36 |
| Roussillon | 171,443 | 185,568 | 14,125 | 8.24 |
| Vaudreuil-Soulanges | 149,349 | 162,600 | 13,251 | 8.87 |
| Les Moulins | 158,267 | 171,127 | 12,860 | 8.13 |
| La Rivière-du-Nord | 128,170 | 140,394 | 12,224 | 9.54 |
| Sherbrooke | 161,323 | 172,950 | 11,627 | 7.21 |
| Mirabel | 50,513 | 61,108 | 10,595 | 20.97 |
| La Vallée-du-Richelieu | 124,420 | 131,803 | 7,383 | 5.93 |
| Thérèse-De Blainville | 157,103 | 163,632 | 6,529 | 4.16 |
| Brome-Missisquoi | 58,314 | 64,786 | 6,472 | 11.1 |
| Lévis | 143,414 | 149,683 | 6,269 | 4.37 |
| Montcalm | 52,596 | 58,680 | 6,084 | 11.57 |
| Les Collines-de-l’Outaouais | 49,094 | 54,498 | 5,404 | 11.01 |
| Francheville | 153,030 | 158,343 | 5,313 | 3.47 |
| Matawinie | 50,435 | 55,500 | 5,065 | 10.04 |
| Les Pays-d’en-Haut | 41,877 | 46,906 | 5,029 | 12.01 |
| Les Laurentides | 45,902 | 50,777 | 4,875 | 10.62 |
| Joliette | 66,550 | 71,124 | 4,574 | 6.87 |
| Drummond | 103,397 | 107,967 | 4,570 | 4.42 |
| La Haute-Yamaska | 88,306 | 92,796 | 4,490 | 5.08 |
| Memphrémagog | 50,415 | 54,797 | 4,382 | 8.69 |
| La Jacques-Cartier | 43,485 | 47,813 | 4,328 | 9.95 |
| Beauharnois-Salaberry | 64,320 | 68,322 | 4,002 | 6.22 |
| Deux-Montagnes | 98,203 | 102,052 | 3,849 | 3.92 |
| Le Haut-Richelieu | 117,443 | 121,277 | 3,834 | 3.26 |
| L’Assomption | 124,759 | 128,087 | 3,328 | 2.67 |
| Lotbinière | 31,741 | 34,586 | 2,845 | 8.96 |
| Marguerite-D’Youville | 77,550 | 80,313 | 2,763 | 3.56 |
| Portneuf | 53,008 | 55,523 | 2,515 | 4.74 |
| Les Jardins-de-Napierville | 27,870 | 30,339 | 2,469 | 8.86 |
| Argenteuil | 32,389 | 34,752 | 2,363 | 7.3 |
| Arthabaska | 72,014 | 74,348 | 2,334 | 3.24 |
| Les Maskoutains | 87,099 | 89,432 | 2,333 | 2.68 |
| La Côte-de-Beaupré | 28,199 | 30,240 | 2,041 | 7.24 |
| D’Autray | 42,189 | 44,080 | 1,891 | 4.48 |
| Papineau | 22,832 | 24,308 | 1,476 | 6.46 |
| Rivière-du-Loup | 33,958 | 35,338 | 1,380 | 4.06 |
| Rouville | 36,536 | 37,889 | 1,353 | 3.7 |
| Antoine-Labelle | 35,243 | 36,462 | 1,219 | 3.46 |
| La Nouvelle-Beauce | 36,785 | 37,988 | 1,203 | 3.27 |
| Nord-du-Québec | 44,561 | 45,740 | 1,179 | 2.65 |
| Les Appalaches | 42,346 | 43,412 | 1,066 | 2.52 |
| Beauce-Sartigan | 52,406 | 53,384 | 978 | 1.87 |
| Maskinongé | 36,316 | 37,292 | 976 | 2.69 |
| Le Val-Saint-François | 30,686 | 31,551 | 865 | 2.82 |
| Pierre-De Saurel | 51,025 | 51,843 | 818 | 1.6 |
| Bellechasse | 37,233 | 38,000 | 767 | 2.06 |
| Nicolet-Yamaska | 23,159 | 23,848 | 689 | 2.98 |
| Le Haut-Saint-François | 22,335 | 22,926 | 591 | 2.65 |
| Rimouski-Neigette | 56,650 | 57,191 | 541 | 0.95 |
| Pontiac | 14,251 | 14,764 | 513 | 3.6 |
| Le Granit | 21,462 | 21,948 | 486 | 2.26 |
| La Côte-de-Gaspé | 17,117 | 17,547 | 430 | 2.51 |
| Coaticook | 18,497 | 18,906 | 409 | 2.21 |
| Mékinac | 12,358 | 12,762 | 404 | 3.27 |
| Les Etchemins | 16,536 | 16,927 | 391 | 2.36 |
| Charlevoix | 12,997 | 13,371 | 374 | 2.88 |
| La Vallée-de-la-Gatineau | 20,182 | 20,547 | 365 | 1.81 |
| Bécancour | 20,404 | 20,748 | 344 | 1.69 |
| Les Sources | 14,286 | 14,623 | 337 | 2.36 |
| Le Saguenay-et-son-Fjord | 167,549 | 167,833 | 284 | 0.17 |
| Shawinigan | 49,349 | 49,620 | 271 | 0.55 |
| Kamouraska | 21,073 | 21,307 | 234 | 1.11 |
| Communauté maritime des Îles-de-la-Madeleine | 12,475 | 12,654 | 179 | 1.43 |
| Les Basques | 8,694 | 8,873 | 179 | 2.06 |
| La Mitis | 18,210 | 18,363 | 153 | 0.84 |
| Témiscamingue | 15,980 | 16,132 | 152 | 0.95 |
| Robert-Cliche | 19,125 | 19,253 | 128 | 0.67 |
| Abitibi | 24,639 | 24,764 | 125 | 0.51 |
| La Vallée-de-l’Or | 43,226 | 43,347 | 121 | 0.28 |
| L’Érable | 23,425 | 23,534 | 109 | 0.47 |
| Acton | 15,594 | 15,654 | 60 | 0.38 |
| Abitibi-Ouest | 20,538 | 20,526 | -12 | -0.06 |
| Rouyn-Noranda | 42,334 | 42,313 | -21 | -0.05 |
| La Tuque | 15,059 | 15,038 | -21 | -0.14 |
| Le Rocher-Percé | 17,282 | 17,219 | -63 | -0.36 |
| Témiscouata | 19,574 | 19,492 | -82 | -0.42 |
| Charlevoix-Est | 15,509 | 15,409 | -100 | -0.64 |
| Bonaventure | 17,660 | 17,557 | -103 | -0.58 |
| Le Domaine-du-Roy | 31,285 | 31,095 | -190 | -0.61 |
| L’Islet | 17,798 | 17,598 | -200 | -1.12 |
| Montmagny | 22,698 | 22,481 | -217 | -0.96 |
| Le Haut-Saint-Laurent | 22,454 | 22,213 | -241 | -1.07 |
| L’Île-d’Orléans | 7,082 | 6,817 | -265 | -3.74 |
| Lac-Saint-Jean-Est | 52,741 | 52,475 | -266 | -0.5 |
| La Matapédia | 17,925 | 17,592 | -333 | -1.86 |
| La Haute-Gaspésie | 11,316 | 10,950 | -366 | -3.23 |
| La Matanie | 21,301 | 20,883 | -418 | -1.96 |
| La Haute-Côte-Nord | 10,846 | 10,278 | -568 | -5.24 |
| Maria-Chapdelaine | 24,793 | 24,149 | -644 | -2.6 |
| Manicouagan | 31,027 | 30,158 | -869 | -2.8 |
| Avignon | 14,461 | 13,415 | -1,046 | -7.23 |
| Sept-Rivières–Caniapiscau | 39,322 | 38,240 | -1,082 | -2.75 |
| Minganie–Le Golfe-du-Saint-Laurent | 11,323 | 9,849 | -1,474 | -13.02 |
