The 2021 census has been released and that means it is time to dive right into some population trends. The Atlantic provinces in general have seen a substantial amount of growth from 2016 to 2021 and this post will go into more detail about Newfoundland and Labrador. You can also read more about the population changes in Nova Scotia, New Brunswick, and PEI.
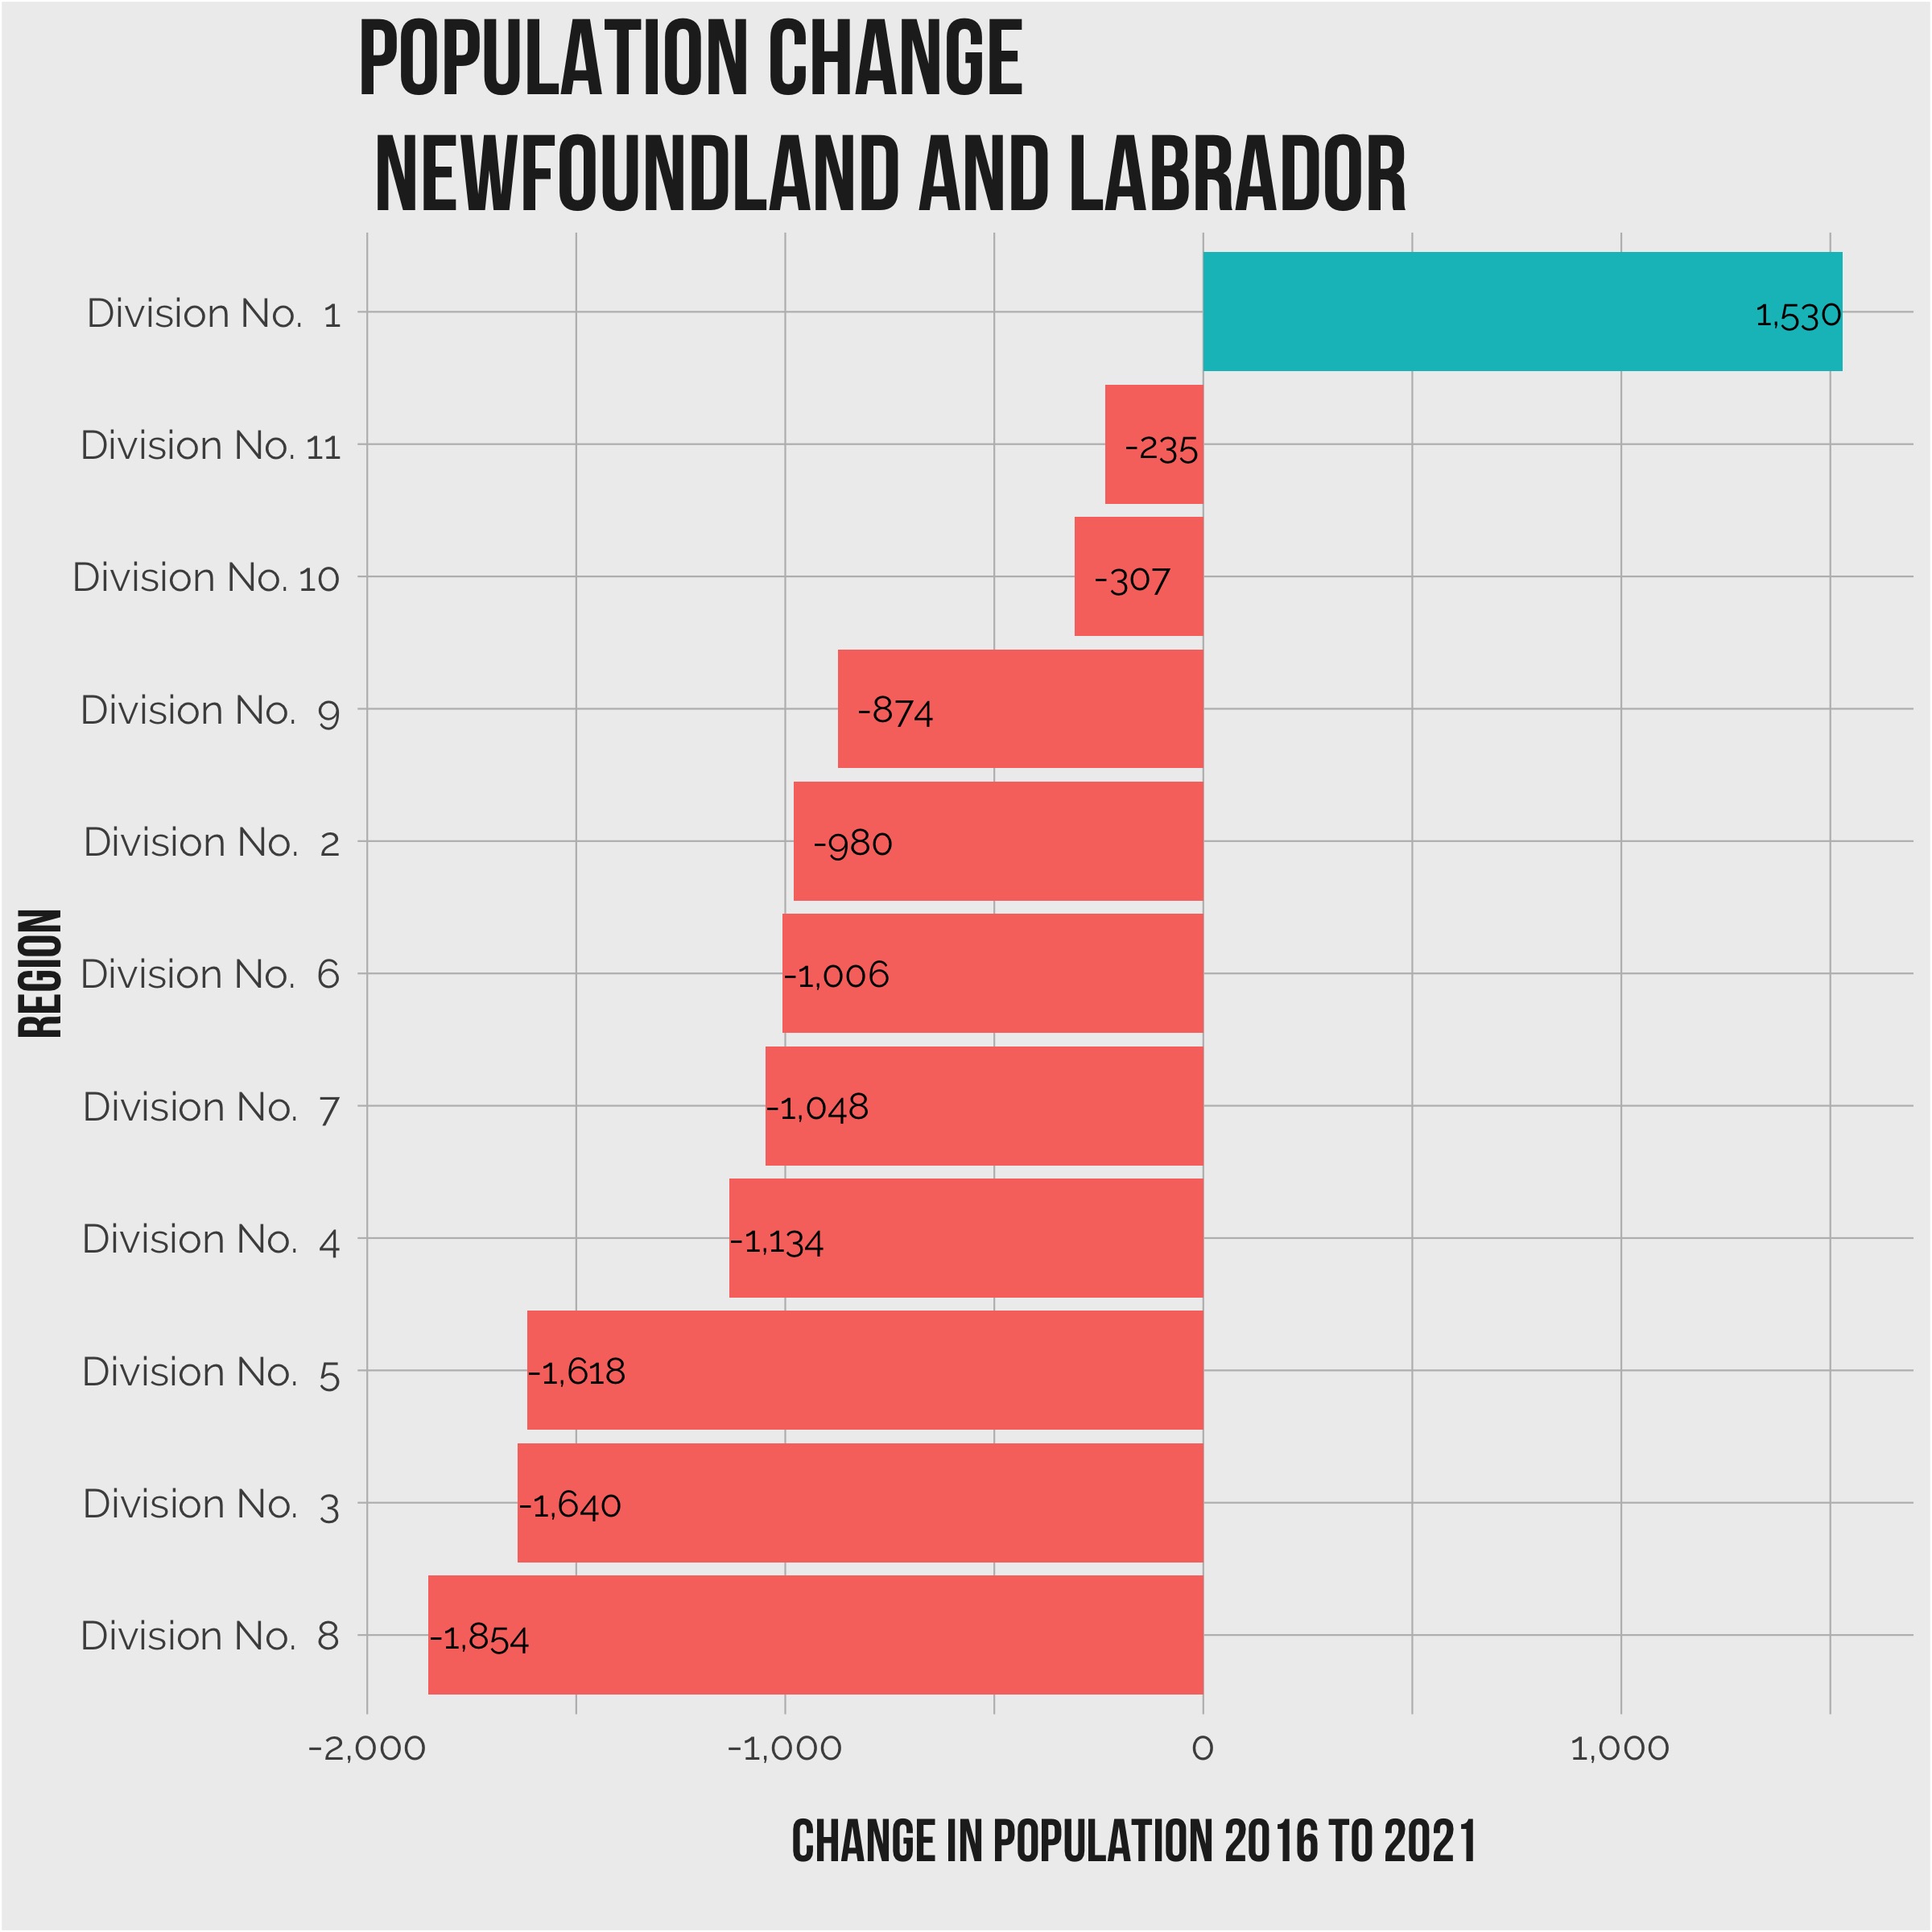
There are eleven different census divisions in Newfoundland and Labrador, creatively named Division No. 1 through Division No. 11. Of those eleven divisions, only one – Division No.1 saw population growth between 2016 and 2021. The overall population of Division No. 1 (which includes the area of St. John’s) grew by just over half a percent or 1,530 residents from 270,348 in 2016 to 271,878 in 2021.
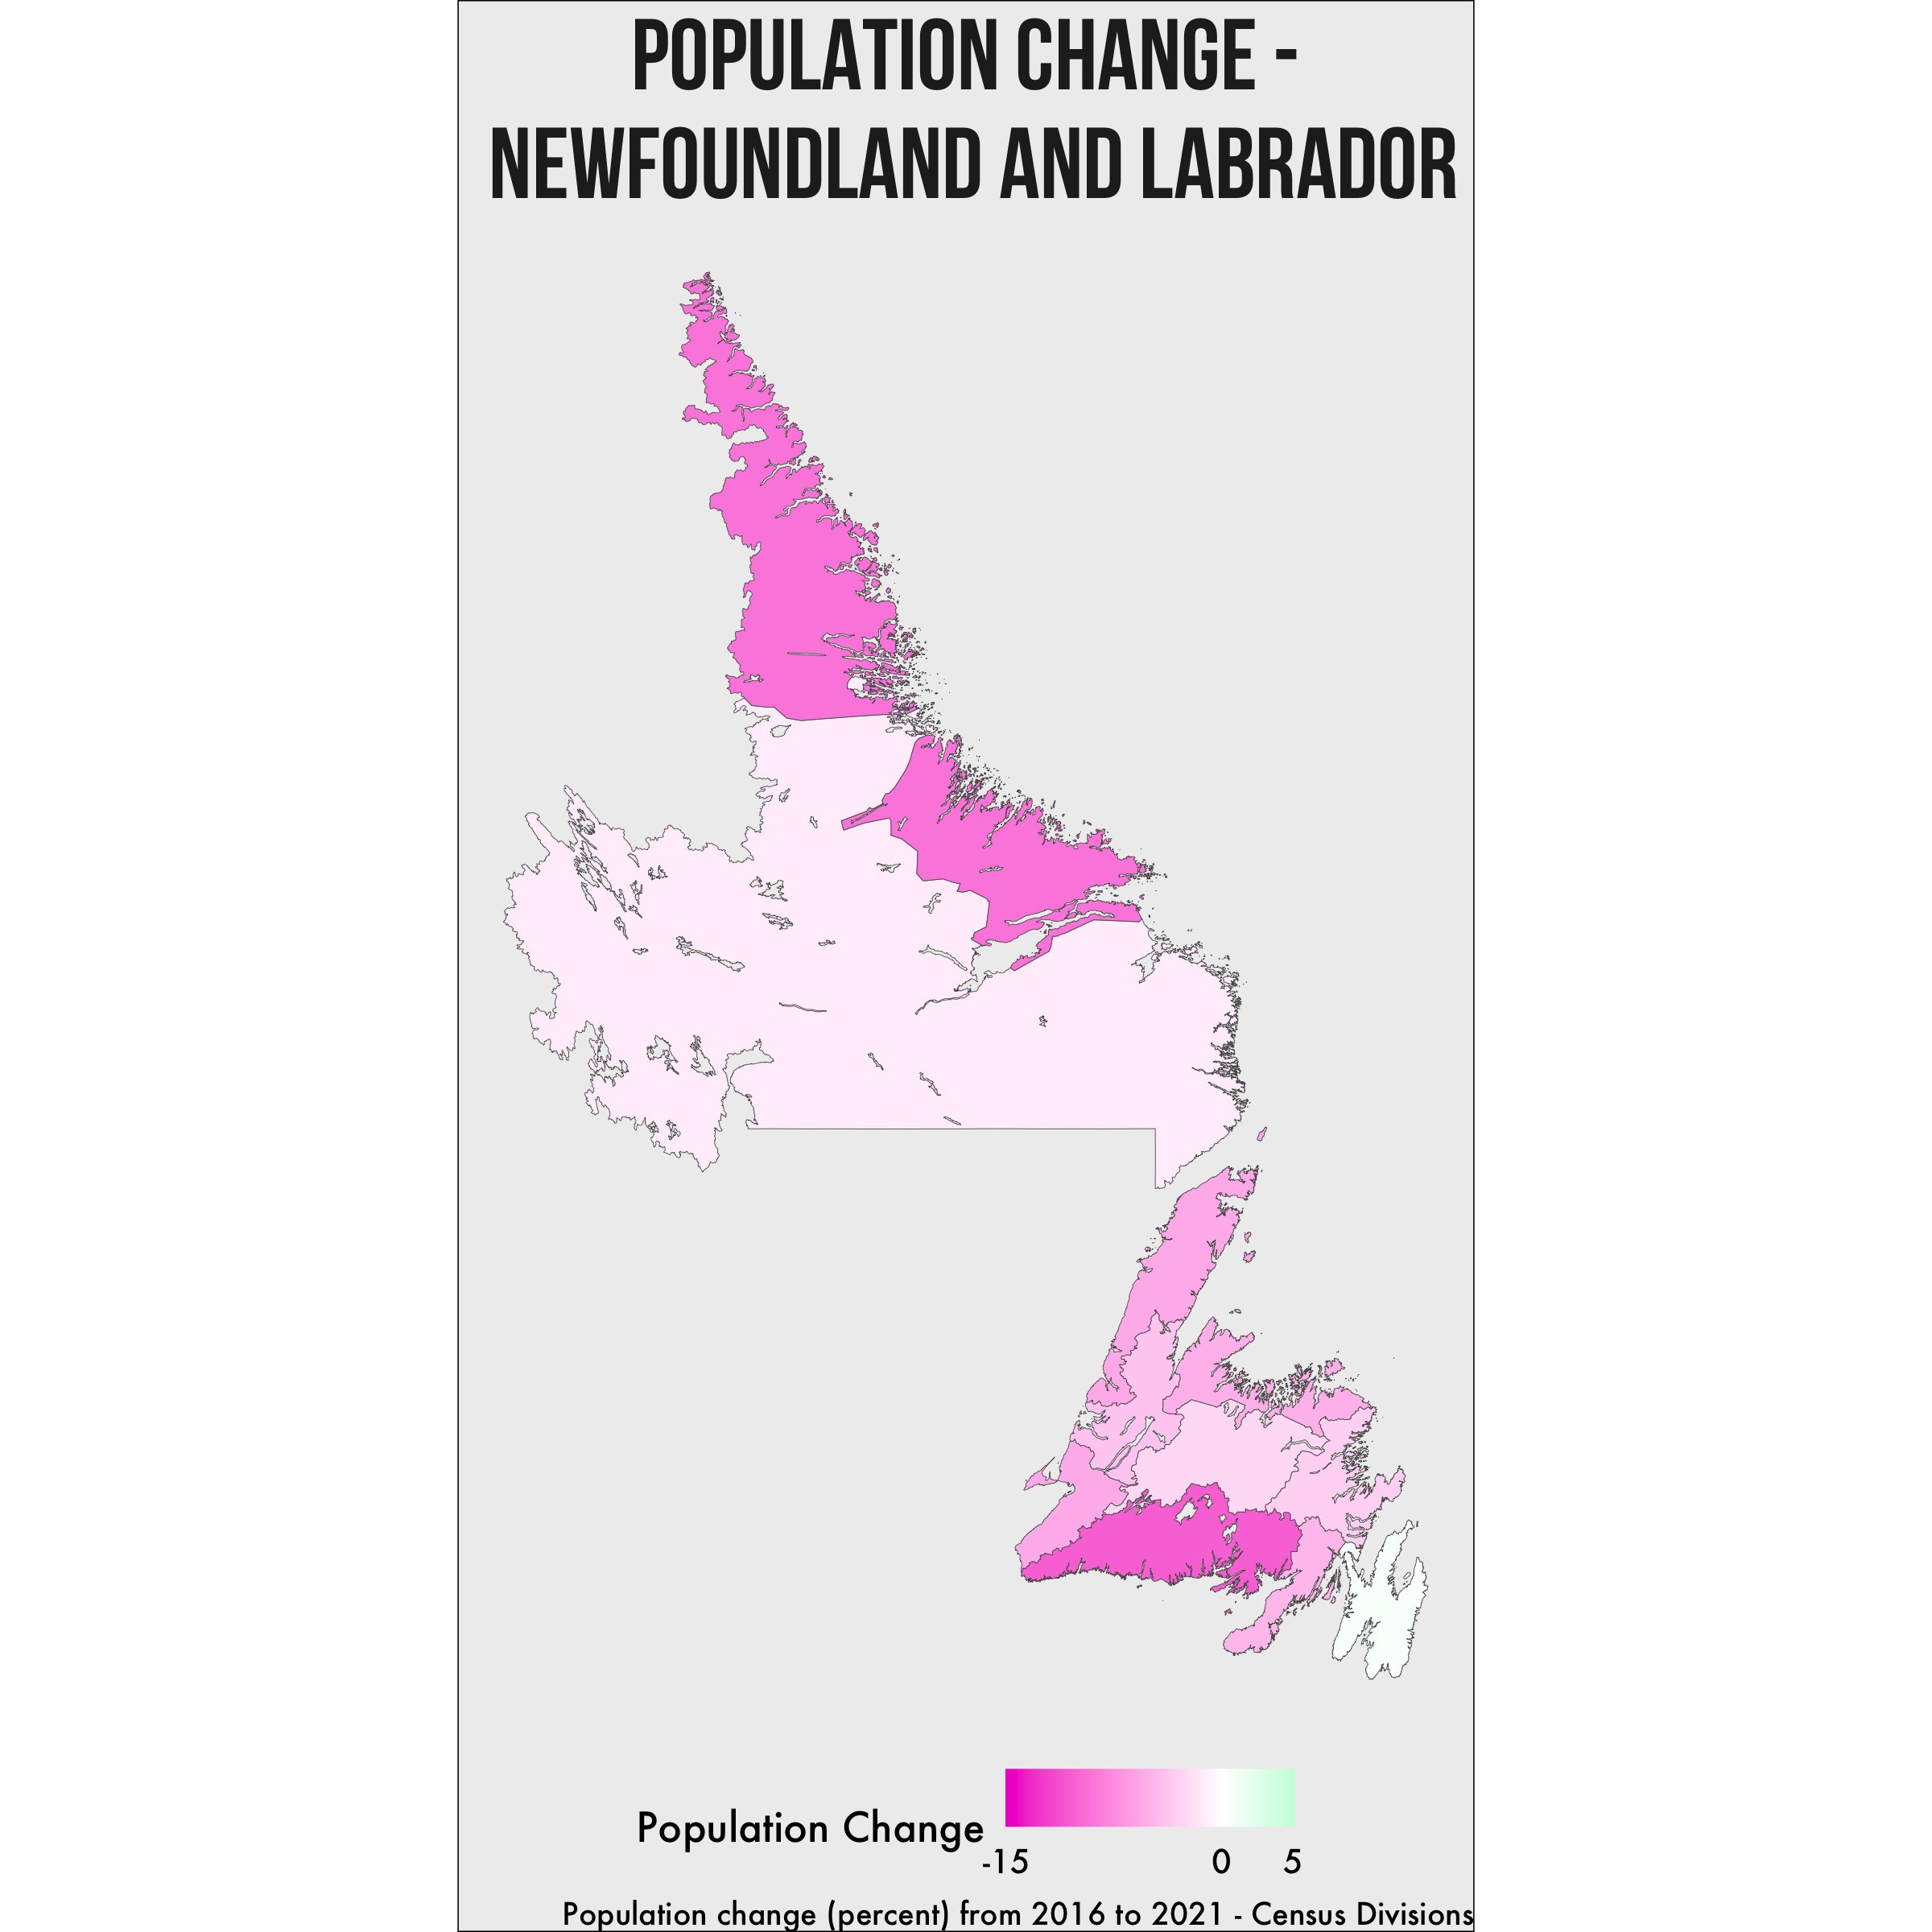
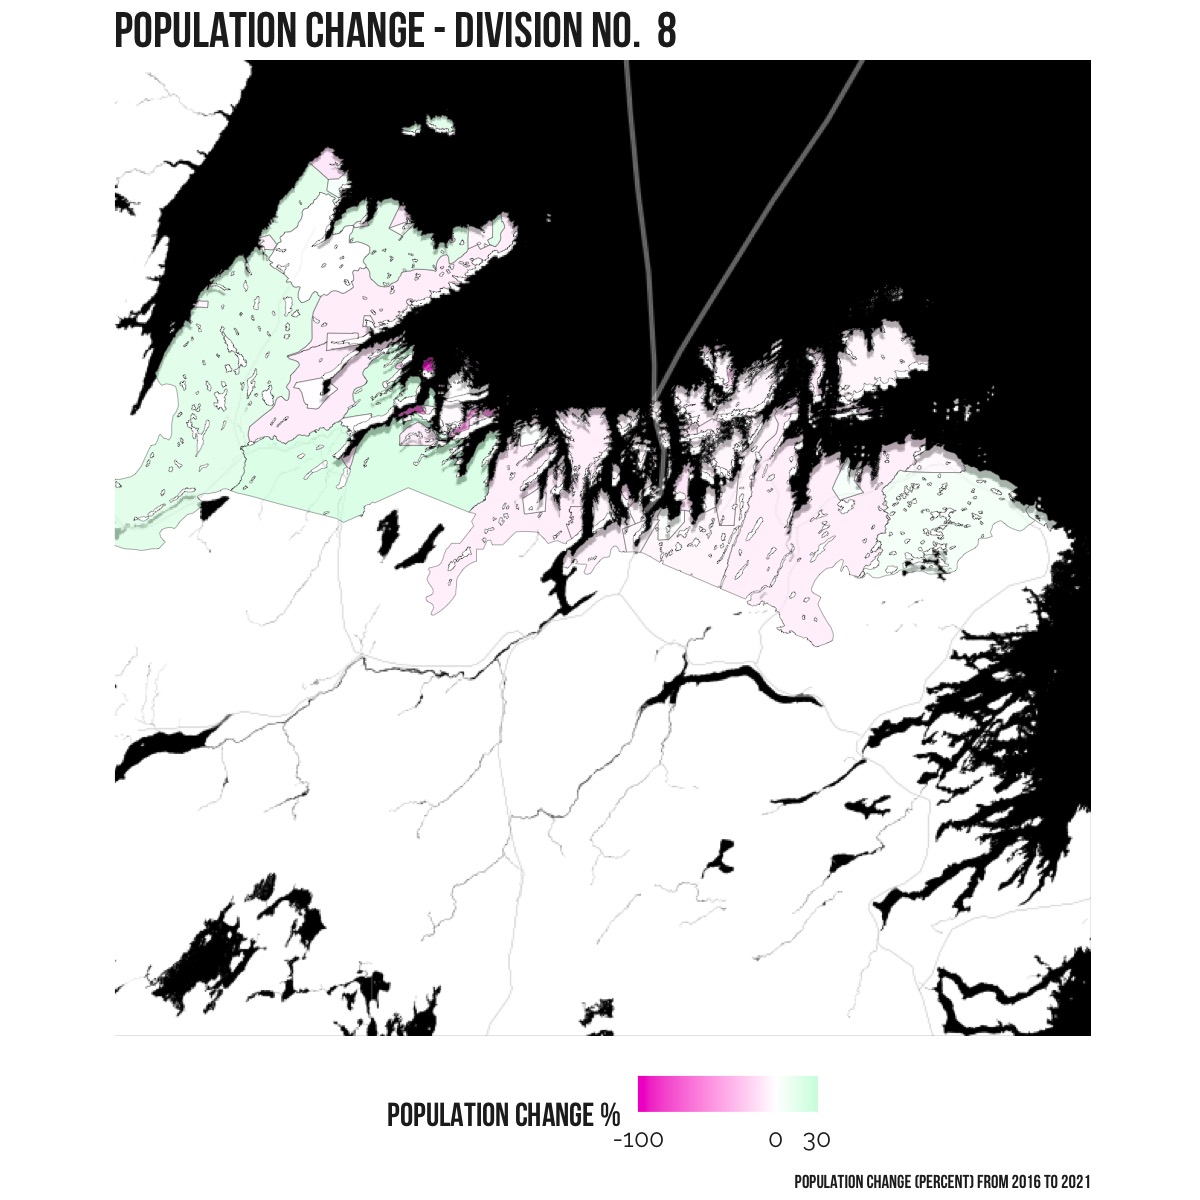
All other census divisions in Newfoundland and Labrador saw population decreases. As a percentage, the area with the most substantial drop was Division No. 3 on the south coast which decreased by 10.5% or 1,640 residents. In terms of actual number of residents, Division No. 8 on the north coast saw a decrease of 5.2% or 1,854 residents.
| Region | Population 2016 | Population 2021 | Population Difference | Population Difference Percent |
|---|---|---|---|---|
| Division No. 1 | 270,348 | 271,878 | 1,530 | 0.57 |
| Division No. 10 | 24,639 | 24,332 | -307 | -1.25 |
| Division No. 6 | 38,345 | 37,339 | -1,006 | -2.62 |
| Division No. 7 | 34,092 | 33,044 | -1,048 | -3.07 |
| Division No. 5 | 42,014 | 40,396 | -1,618 | -3.85 |
| Division No. 2 | 20,372 | 19,392 | -980 | -4.81 |
| Division No. 8 | 35,794 | 33,940 | -1,854 | -5.18 |
| Division No. 4 | 20,387 | 19,253 | -1,134 | -5.56 |
| Division No. 9 | 15,607 | 14,733 | -874 | -5.6 |
| Division No. 11 | 2,558 | 2,323 | -235 | -9.19 |
| Division No. 3 | 15,560 | 13,920 | -1,640 | -10.54 |
Which areas have seen high growth?
Of the eleven census divisions, only one saw an increase in the number of residents between 2016 and 2021. Division No. 1 (which includes the area of St. John’s) grew by just over half a percent or 1,530 residents from 270,348 in 2016 to 271,878 in 2021.
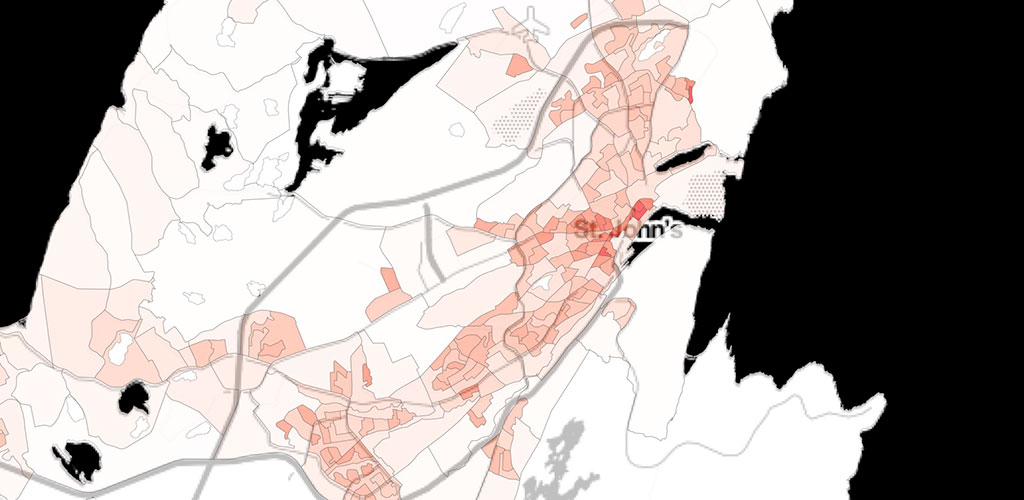
The next level down to consider is the census sub-divisions for this area, then break that down into the respective dissemination areas. The map below shows population change as a percentage between 2016 and 2021 for Division No. 1.
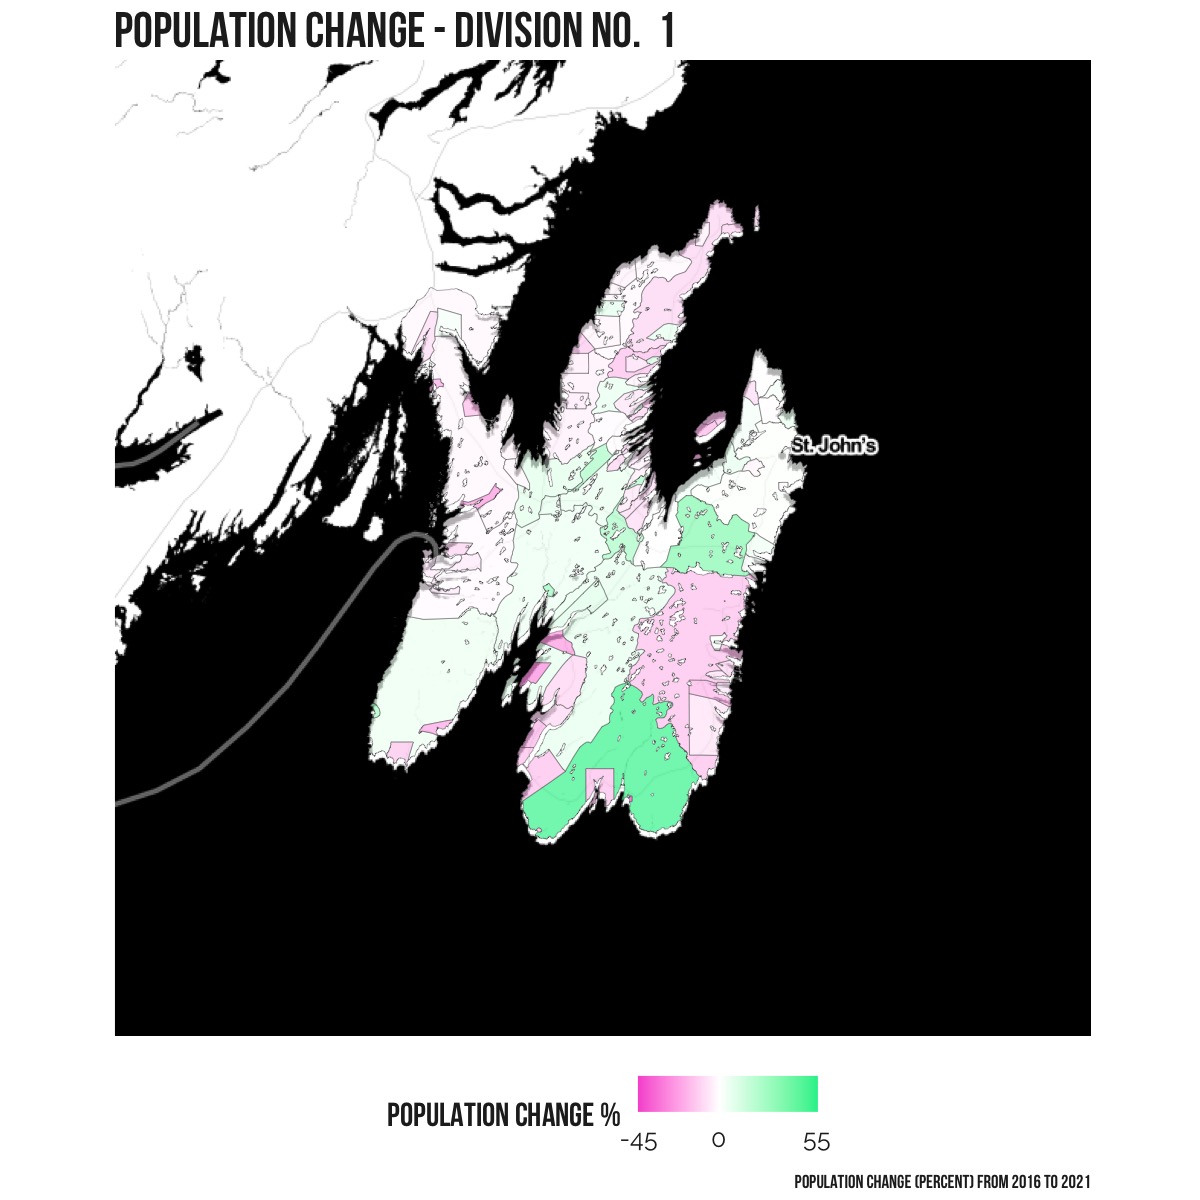
High growth area #1
The census subdivision that includes St John’s saw the most amount of growth within Division No. 1. This area grew by 1,665 residents, from 108,860 in 2016 to 110,525 in 2021.
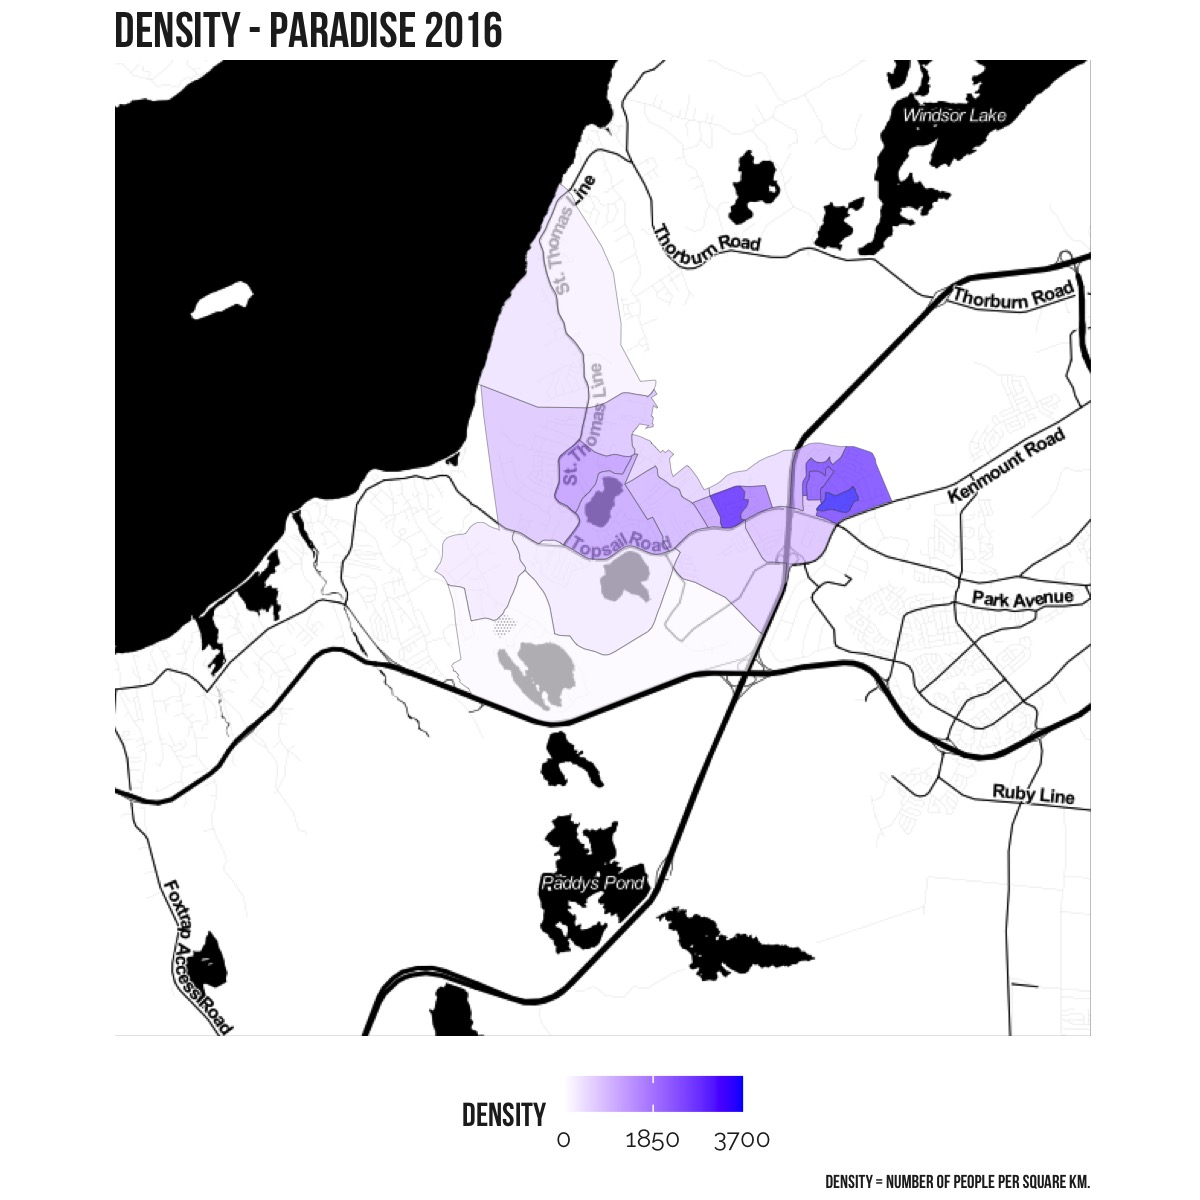
High growth area #2
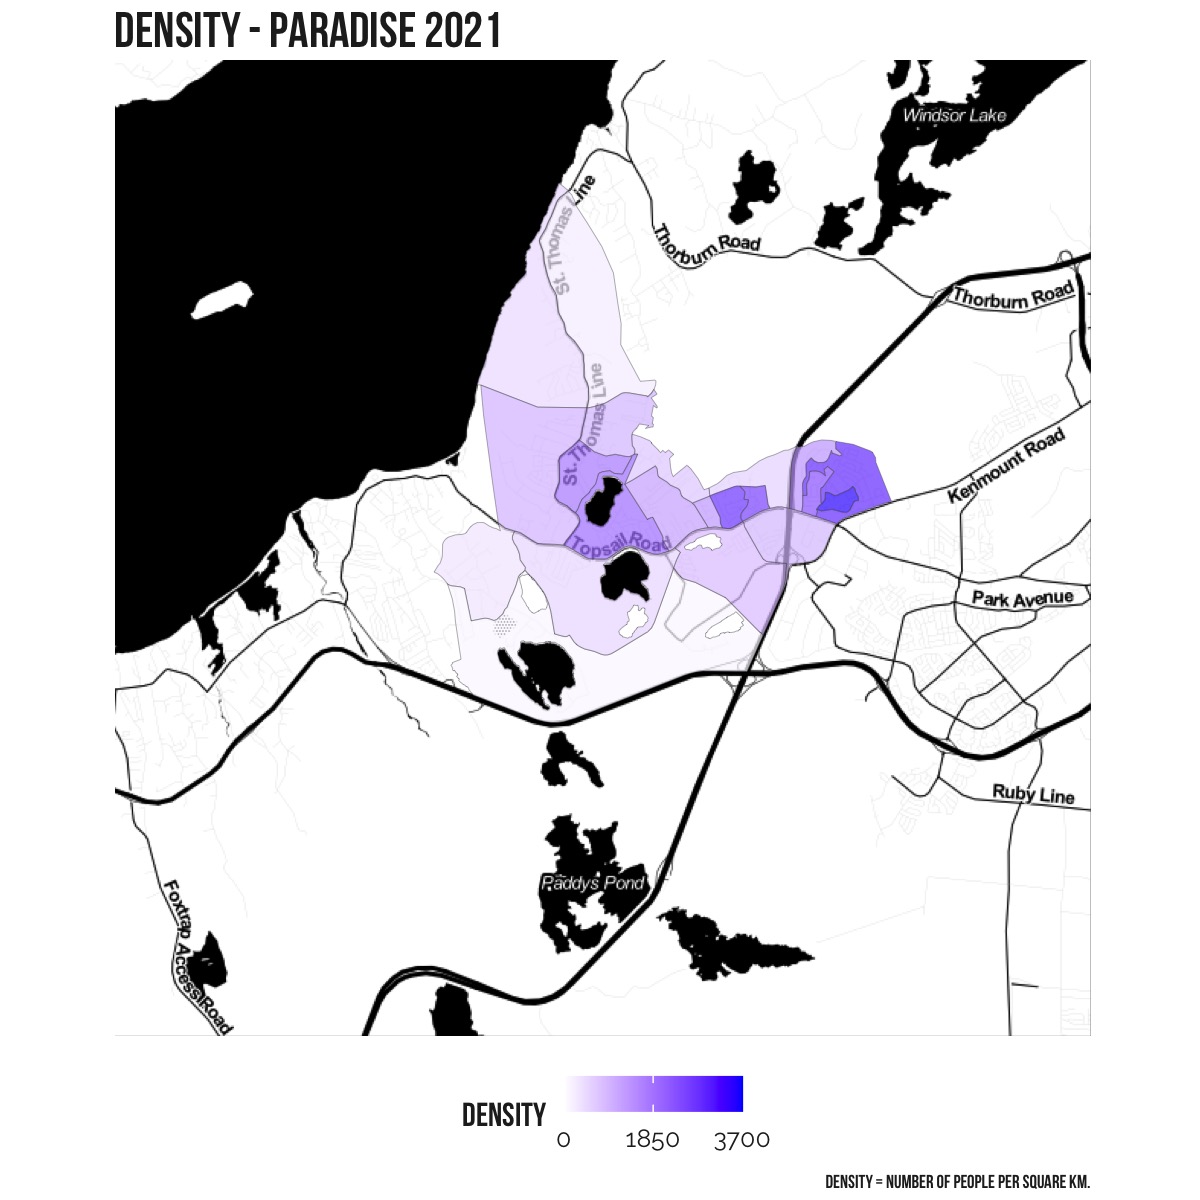
The census subdivision within Division No. 1 that had the second highest amount of growth was the area including Paradise. This area grew by 1,568 residents, from 21,389 in 2016 to 22,957 in 2021.
High growth area #3
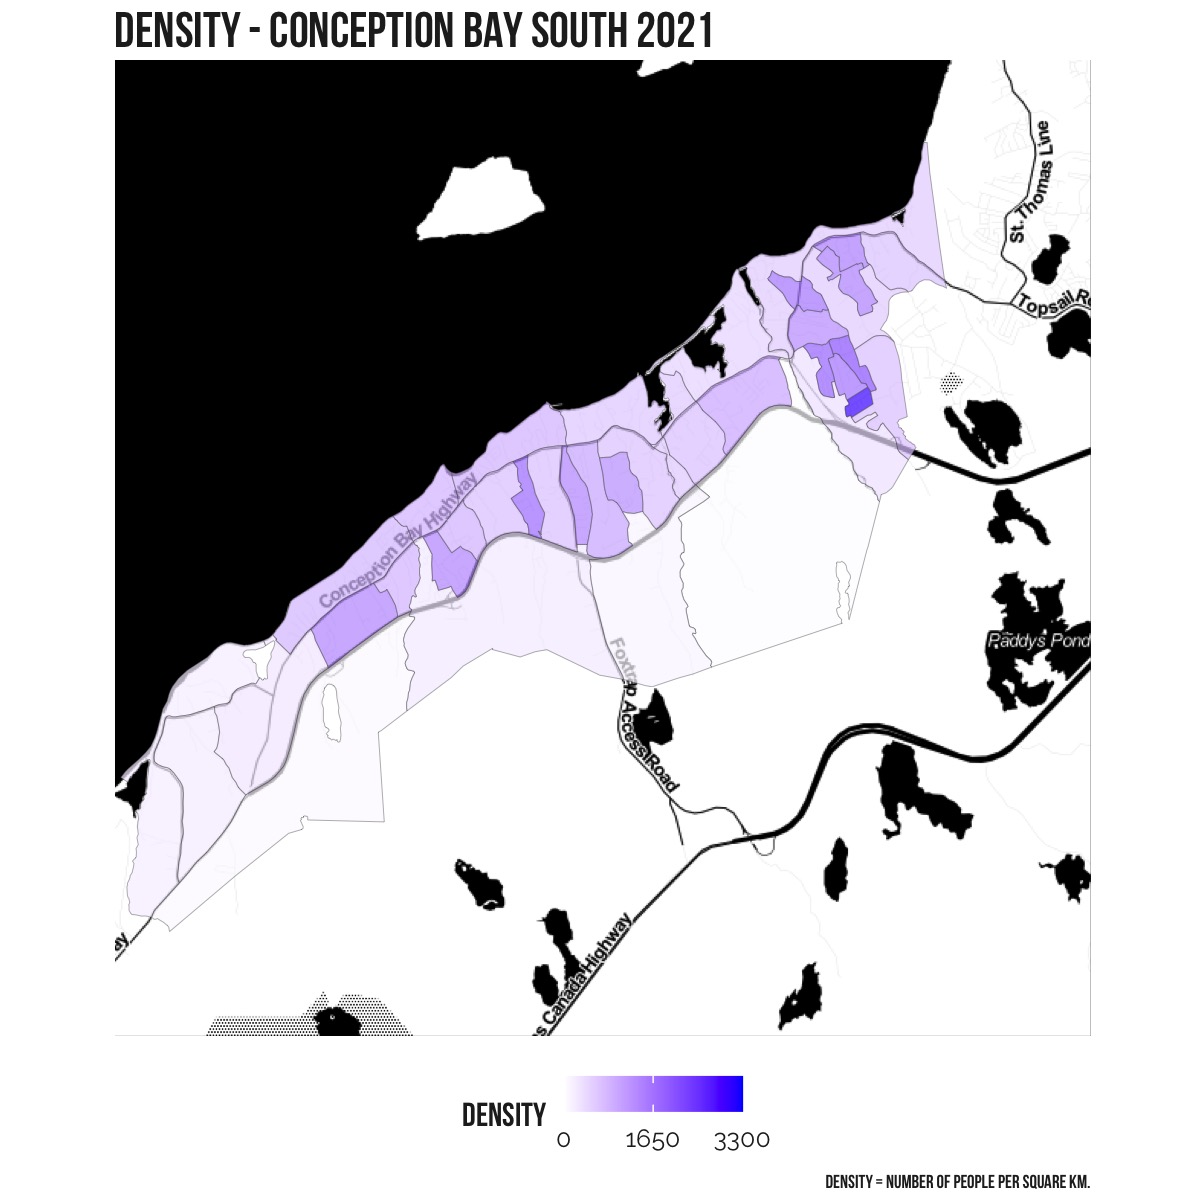
The census subdivision within Division No. 1 that had the third highest amount of growth was the area including Conception Bay South. This area grew by 969 residents, from 26,199 in 2016 to 27,168 in 2021.

Which areas have seen the lowest growth?
Ten out of the eleven census divisions saw population declines. The lowest growth by number of residents (or highest decline) was in Division No. 8 on the north coast which saw a decrease of 5.2% or 1,854 residents, from 35,794 in 2016 to 33,940 in 2021.
Population changes in the capital
The census metropolitan area (CMA) of St. John’s grew by 6,624 residents (or 3.2%) from 205,955 in 2016 to 212,579 in 2021.
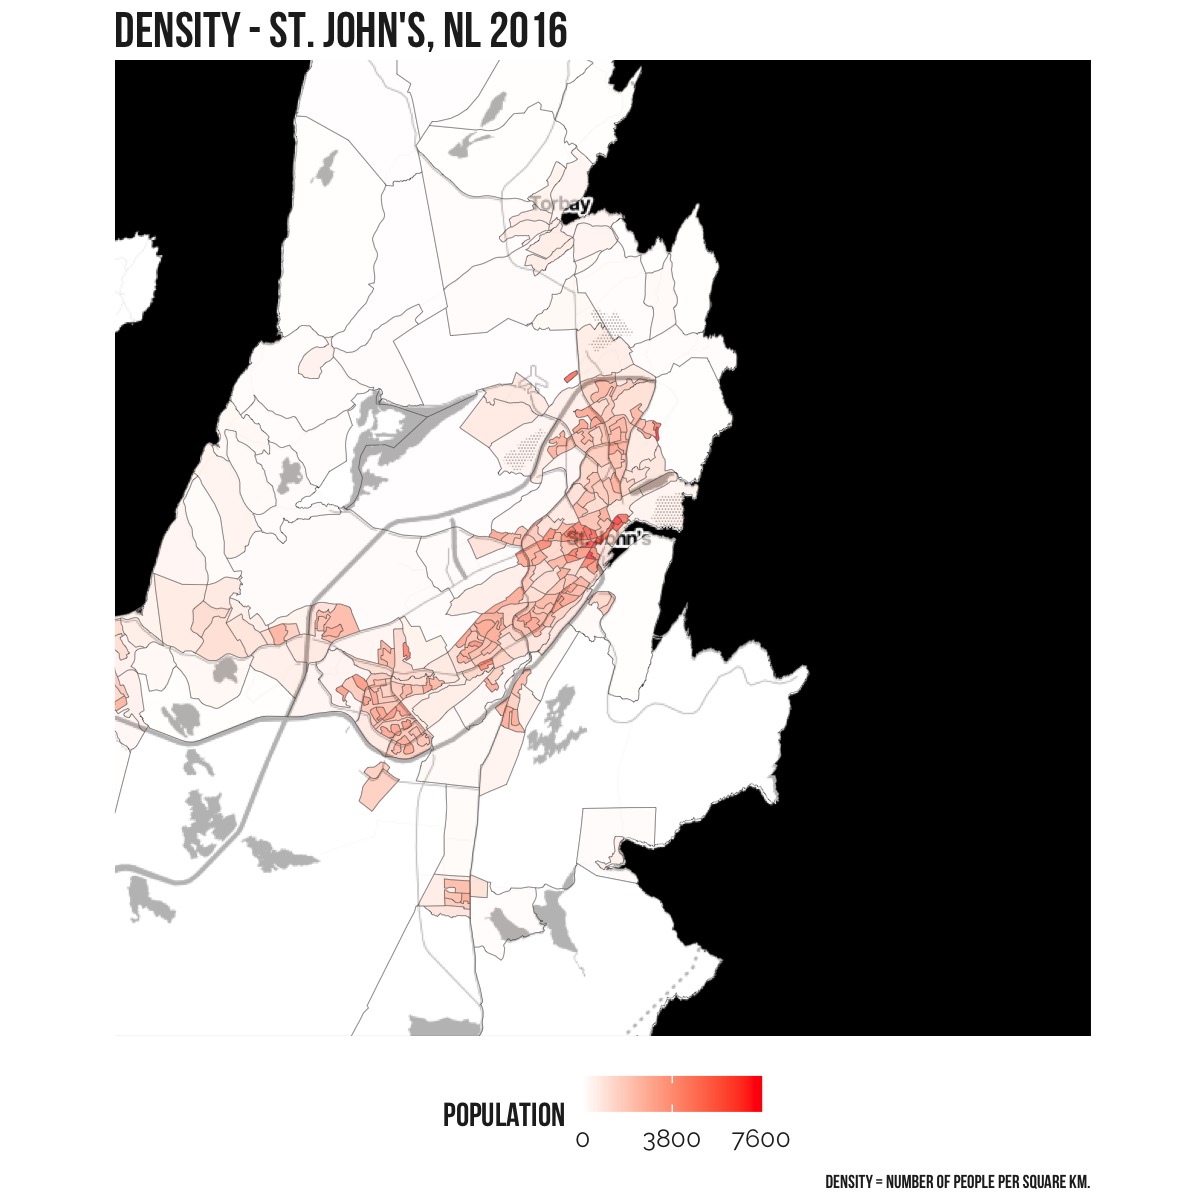
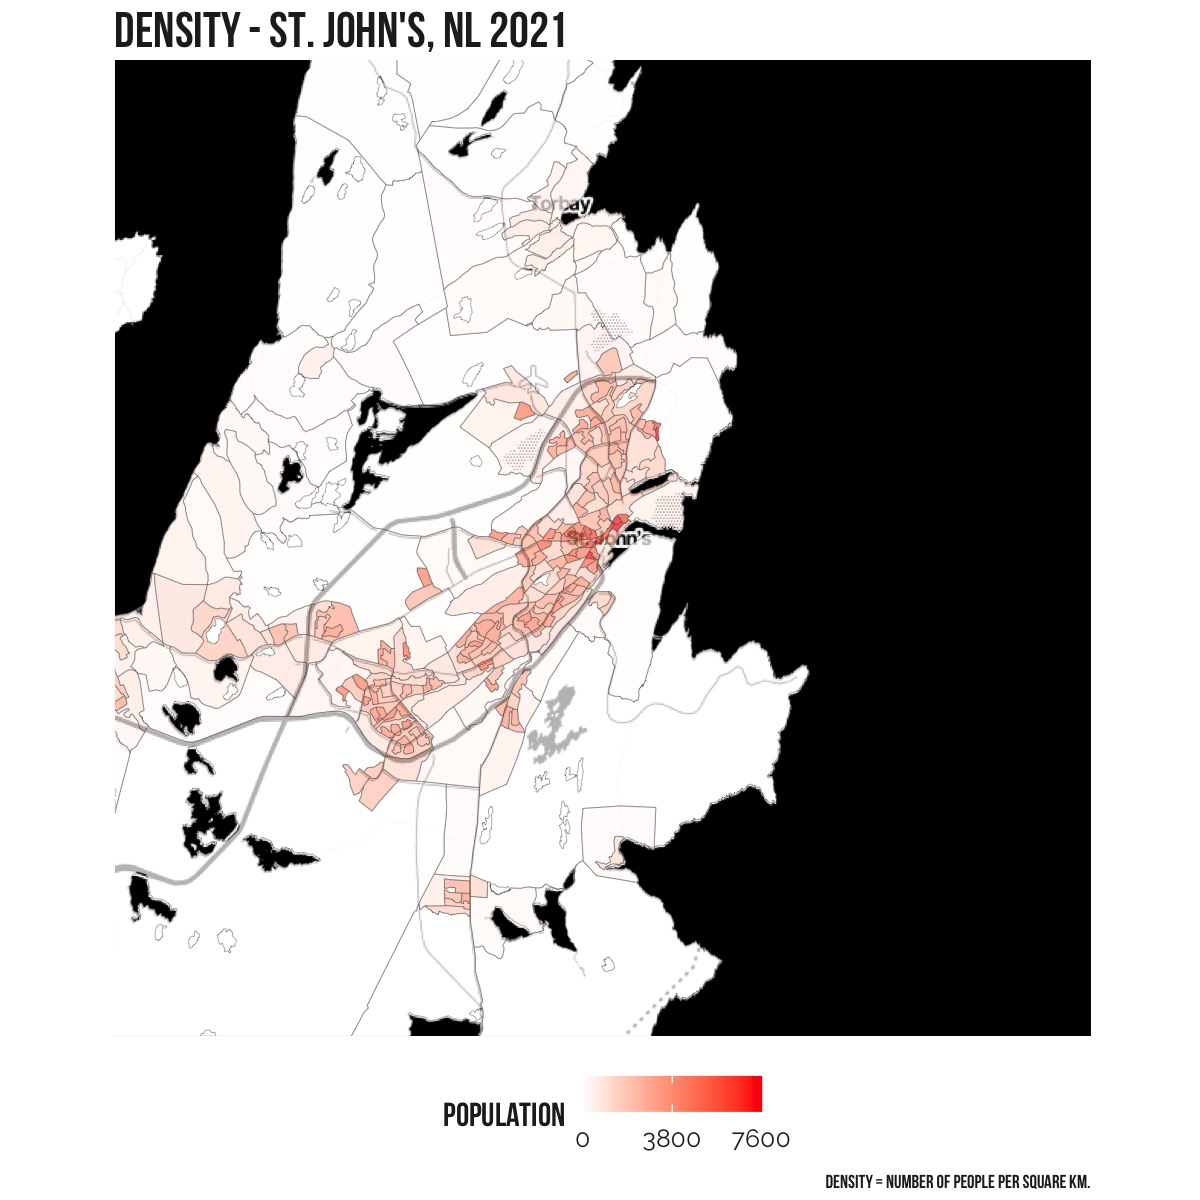
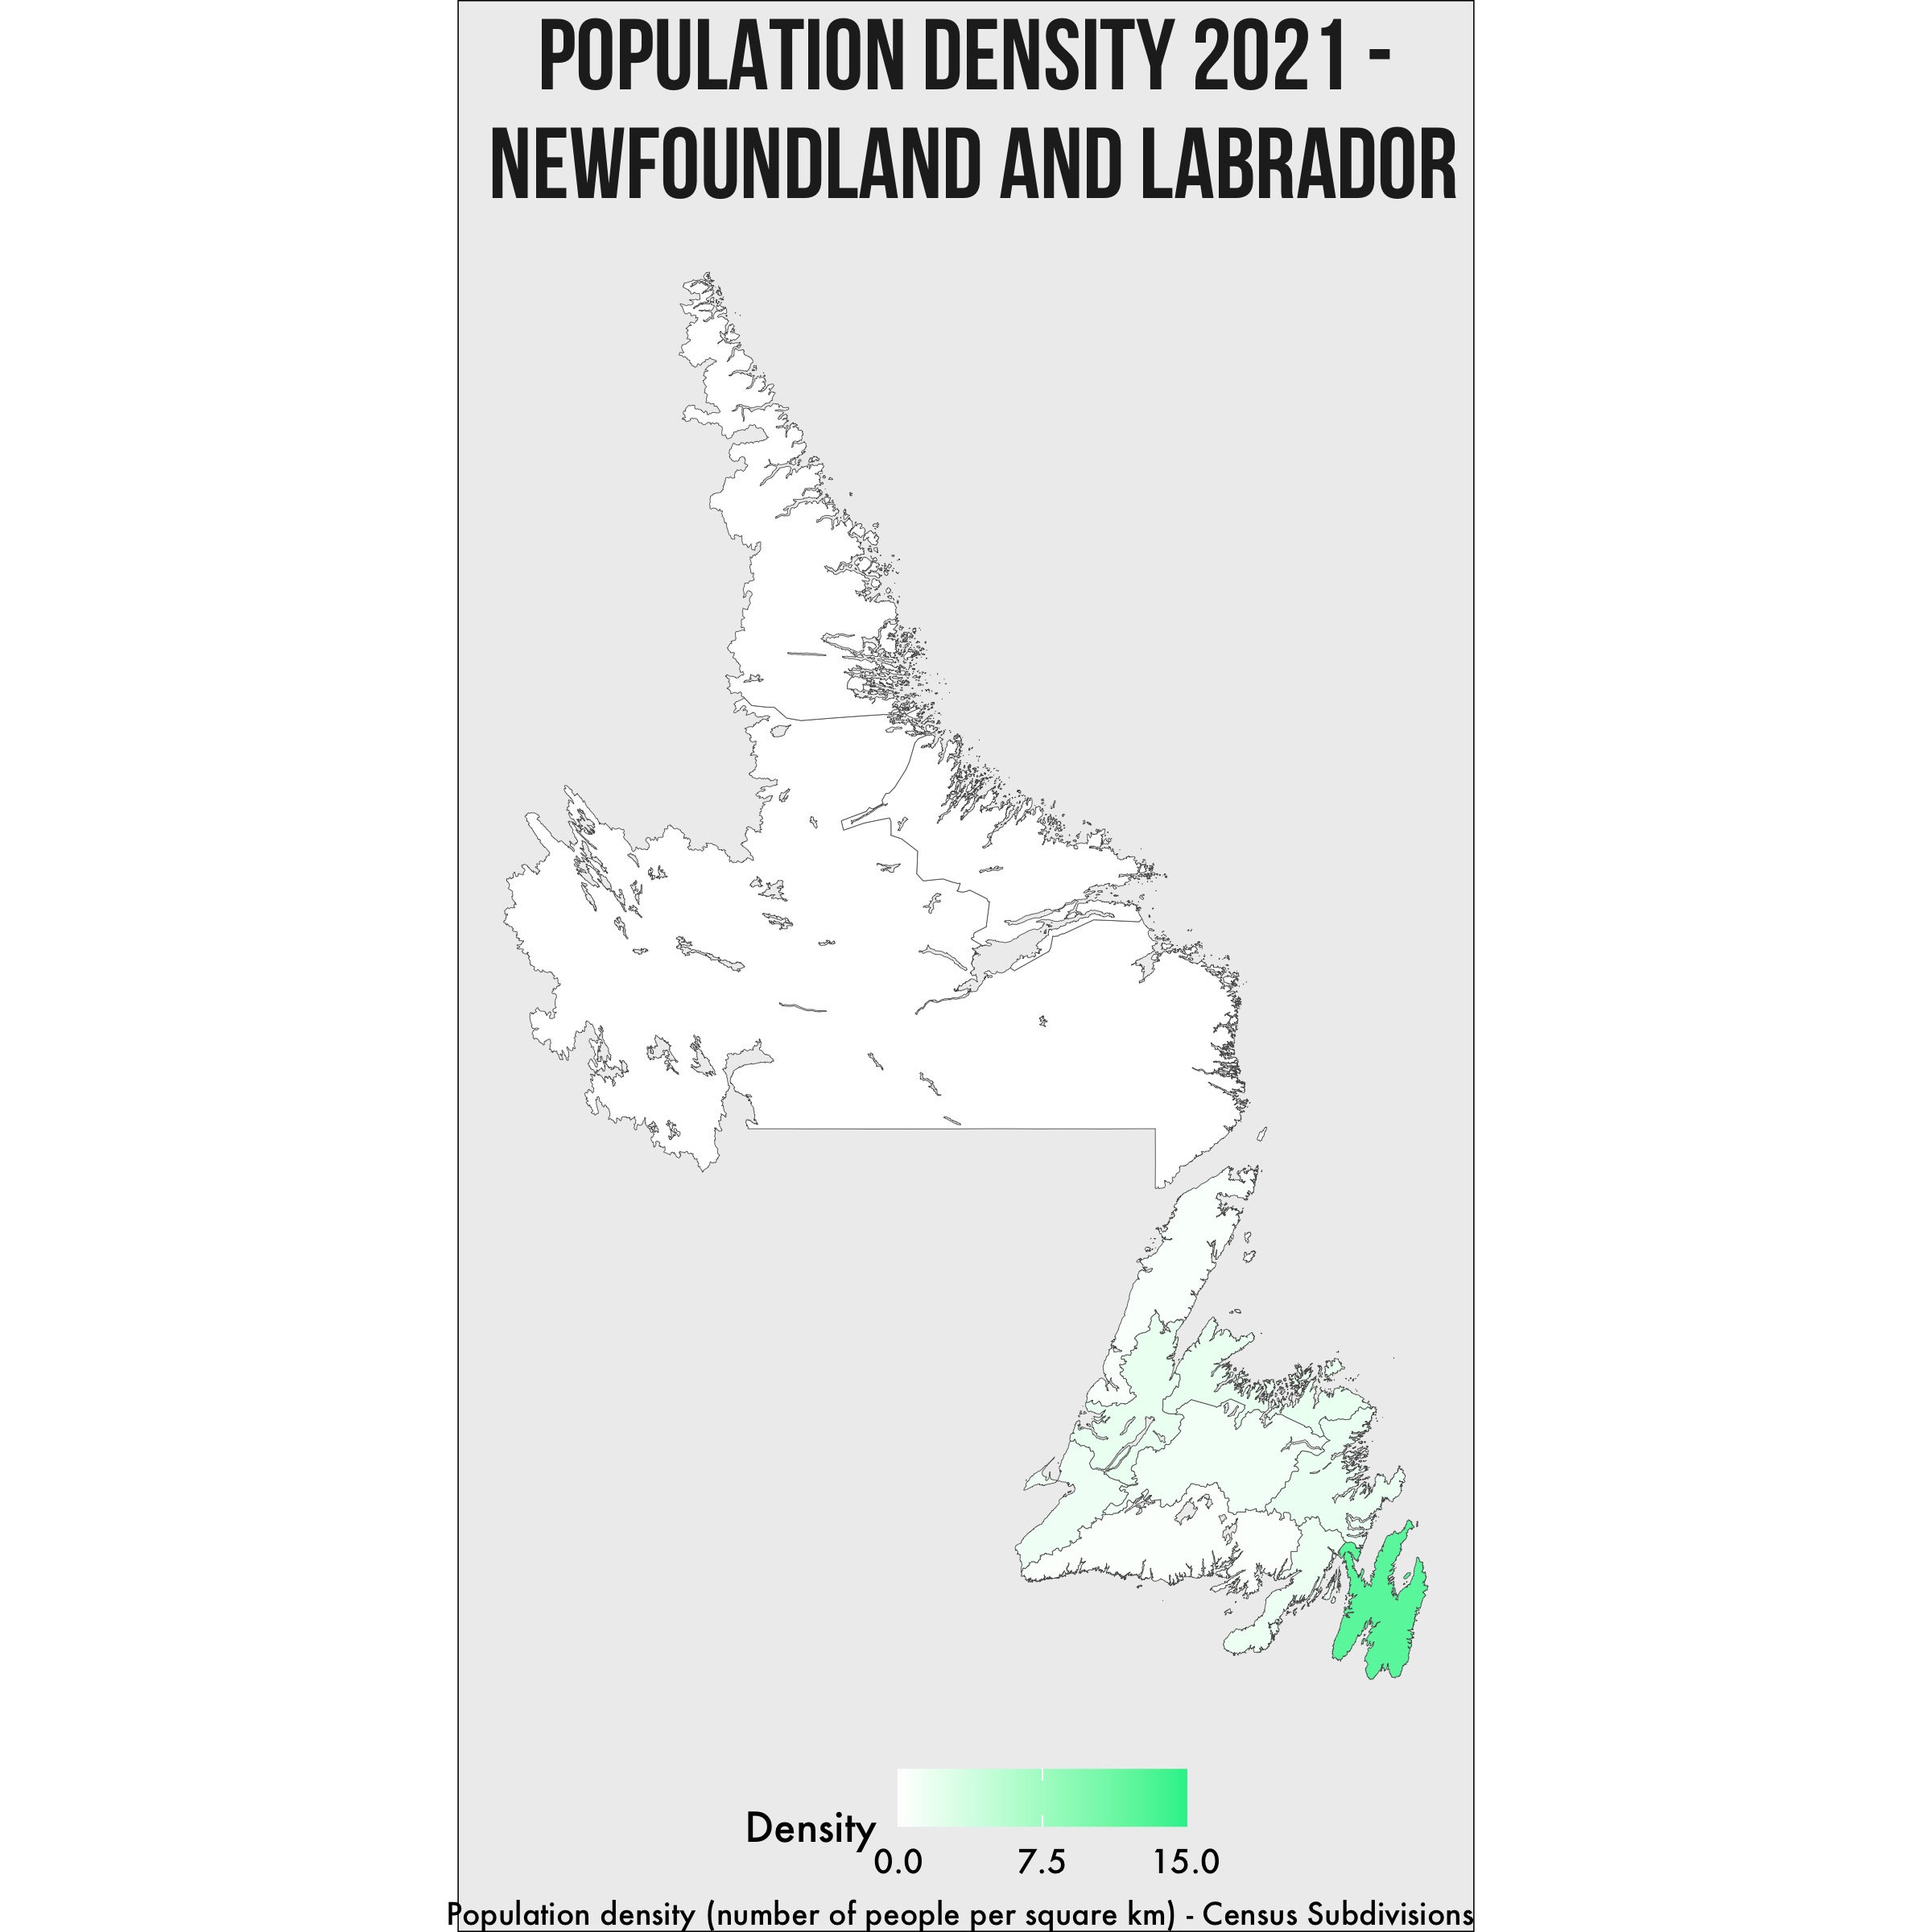
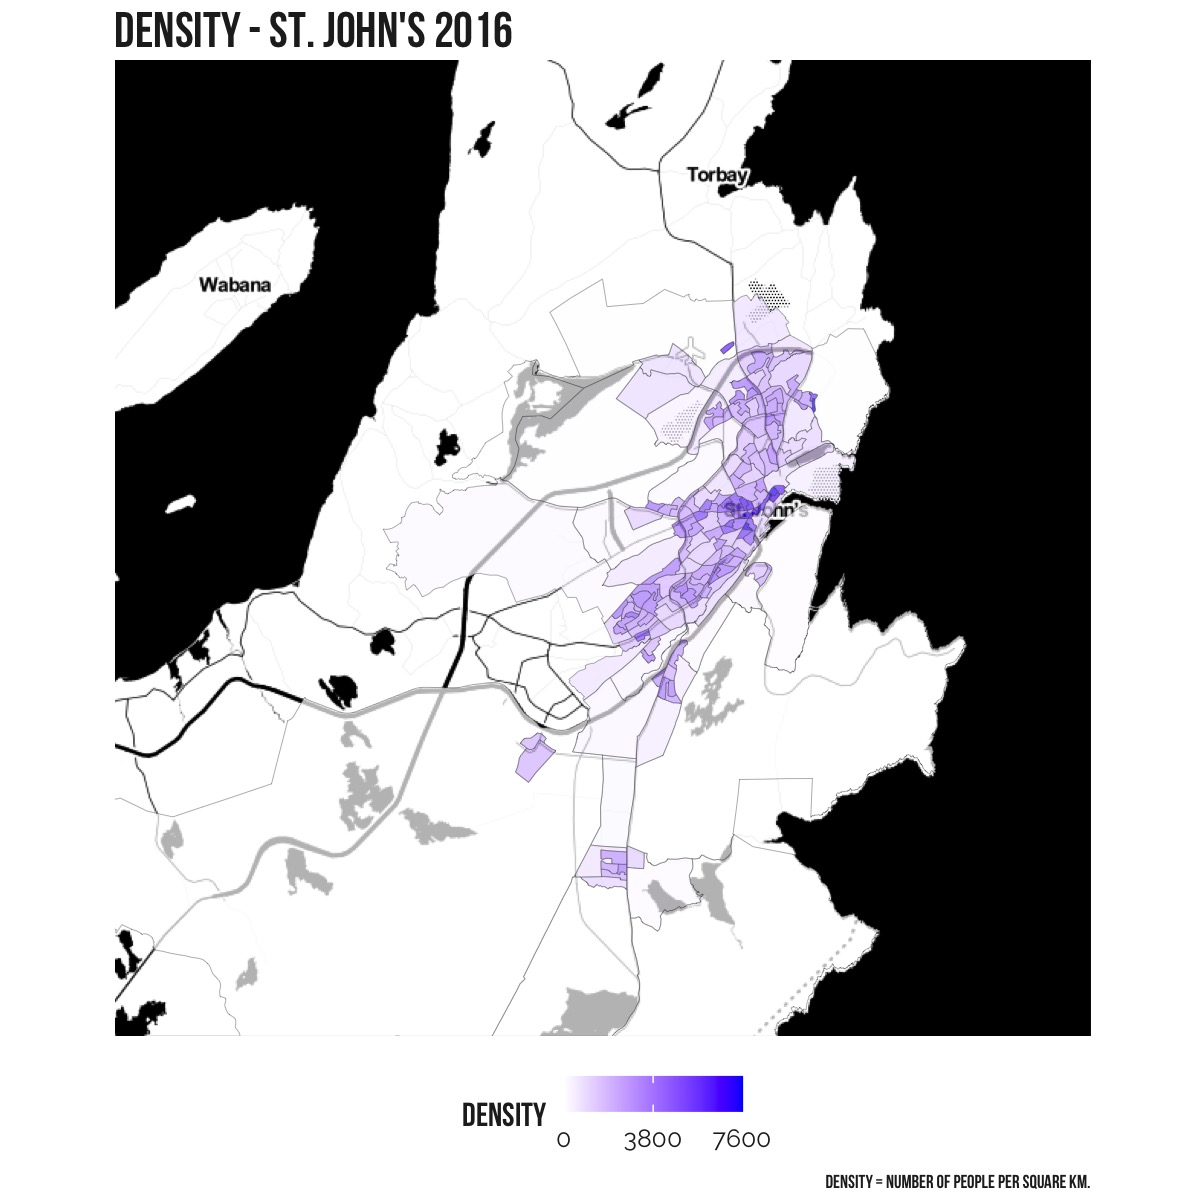
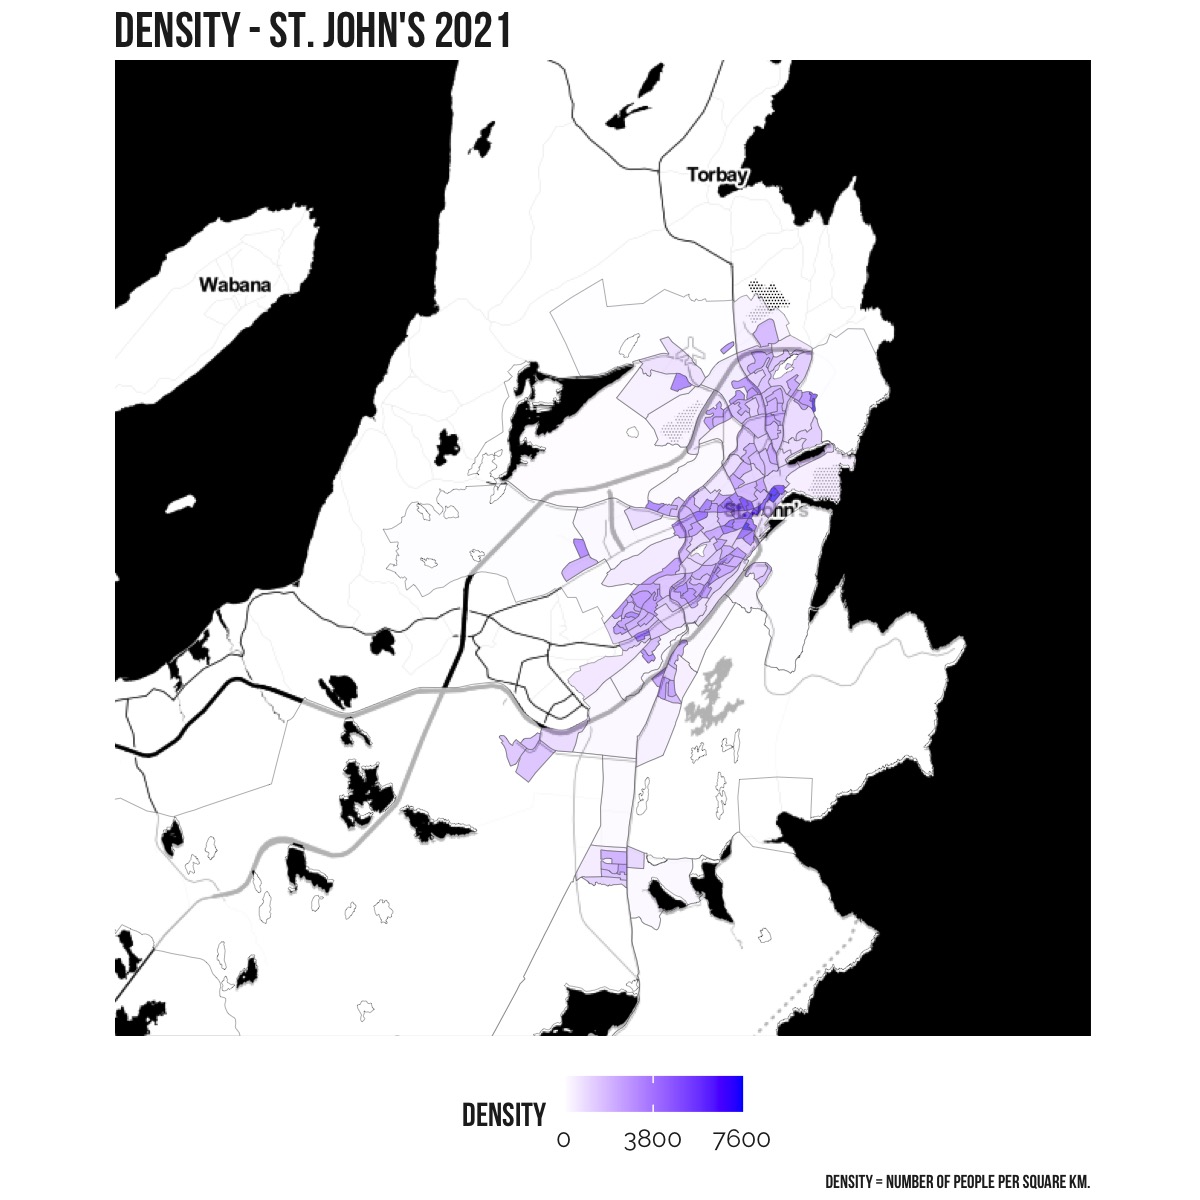
Overall population density
Not surprisingly, the densest area of the province is around St John’s.