The 2021 census has been released and that means it is time to dive right into some population trends. Canadian population numbers have changed substantially between 2016 and 2021 and this post will go into more detail about Ontario. You can also read more about the population changes in Nova Scotia, New Brunswick, Newfoundland, PEI, and Quebec.
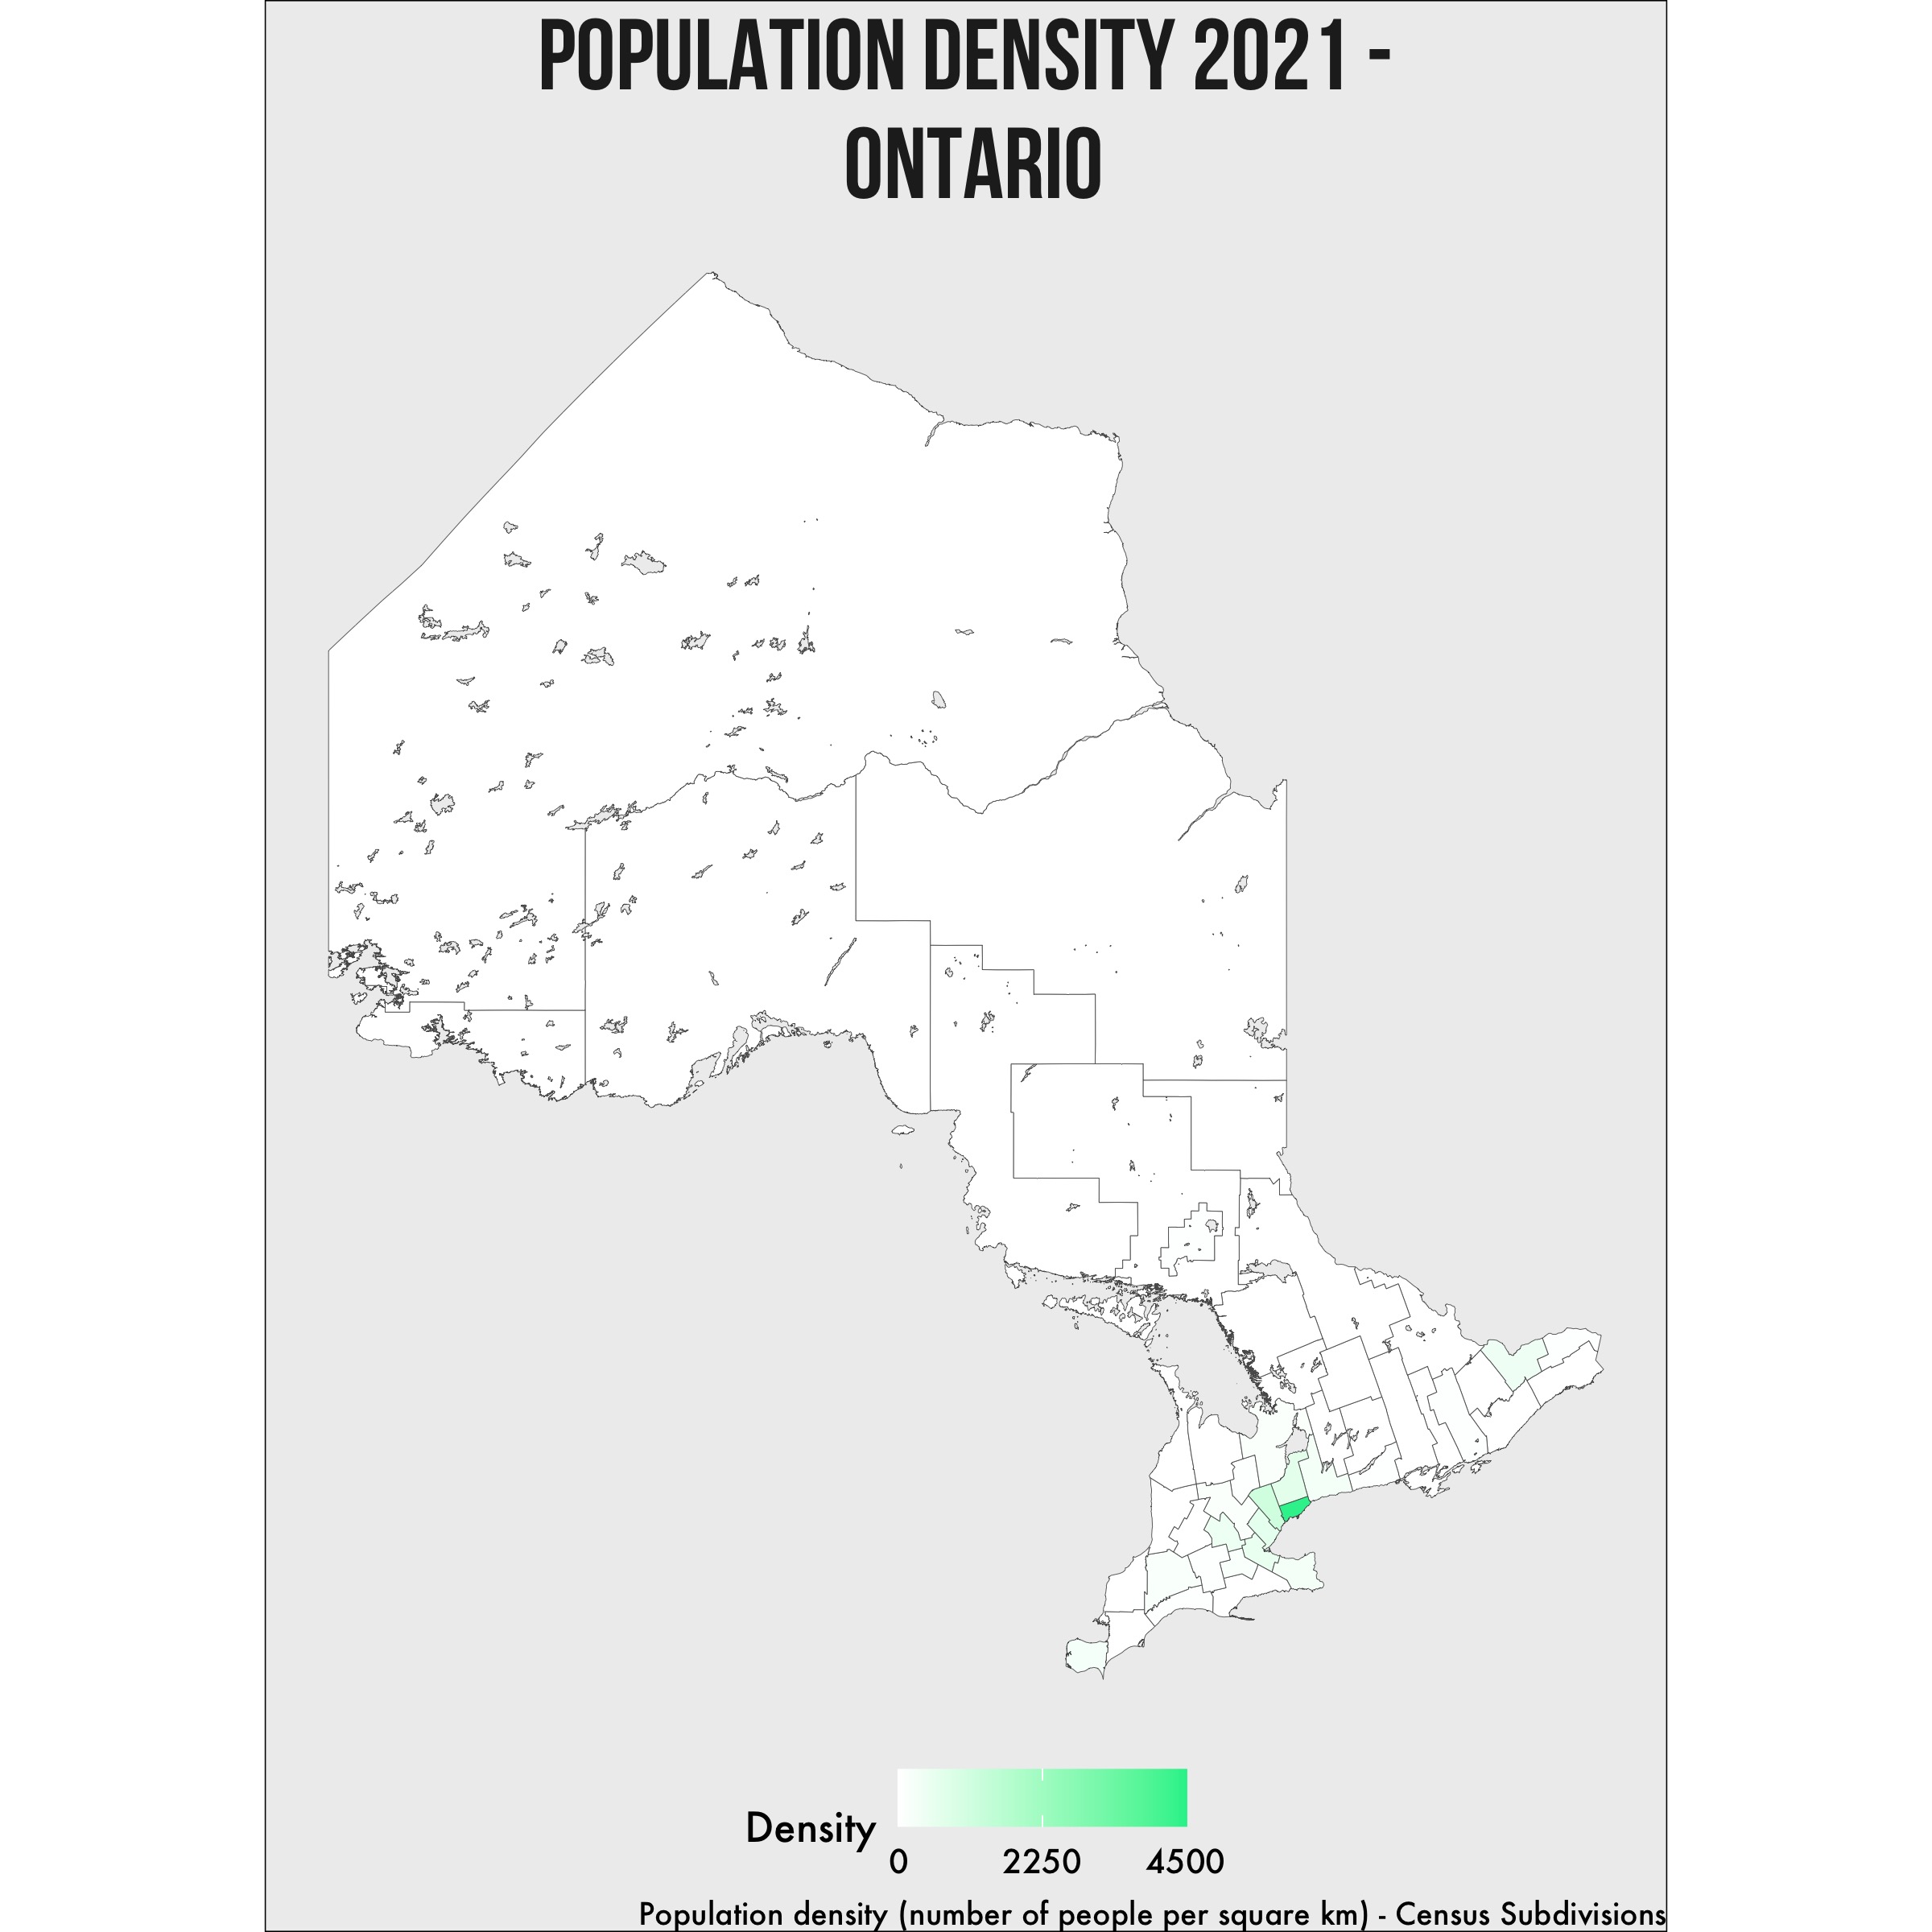
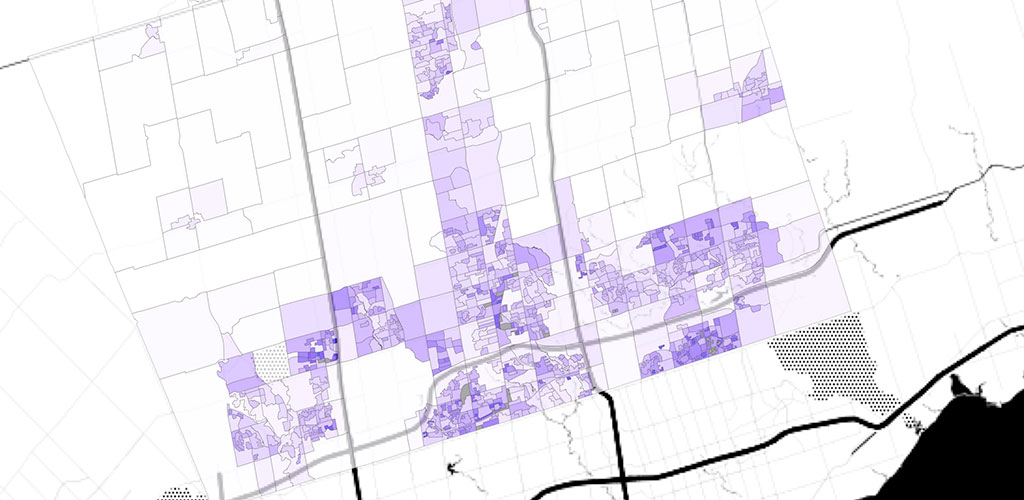
There are 49 different census division in Ontario. A census division is defined by Statistics Canada as a “group of neighbouring municipalities joined together for the purposes of regional planning and managing common services”. The boundaries and population density of each of those 49 census divisions is shown on the map above.
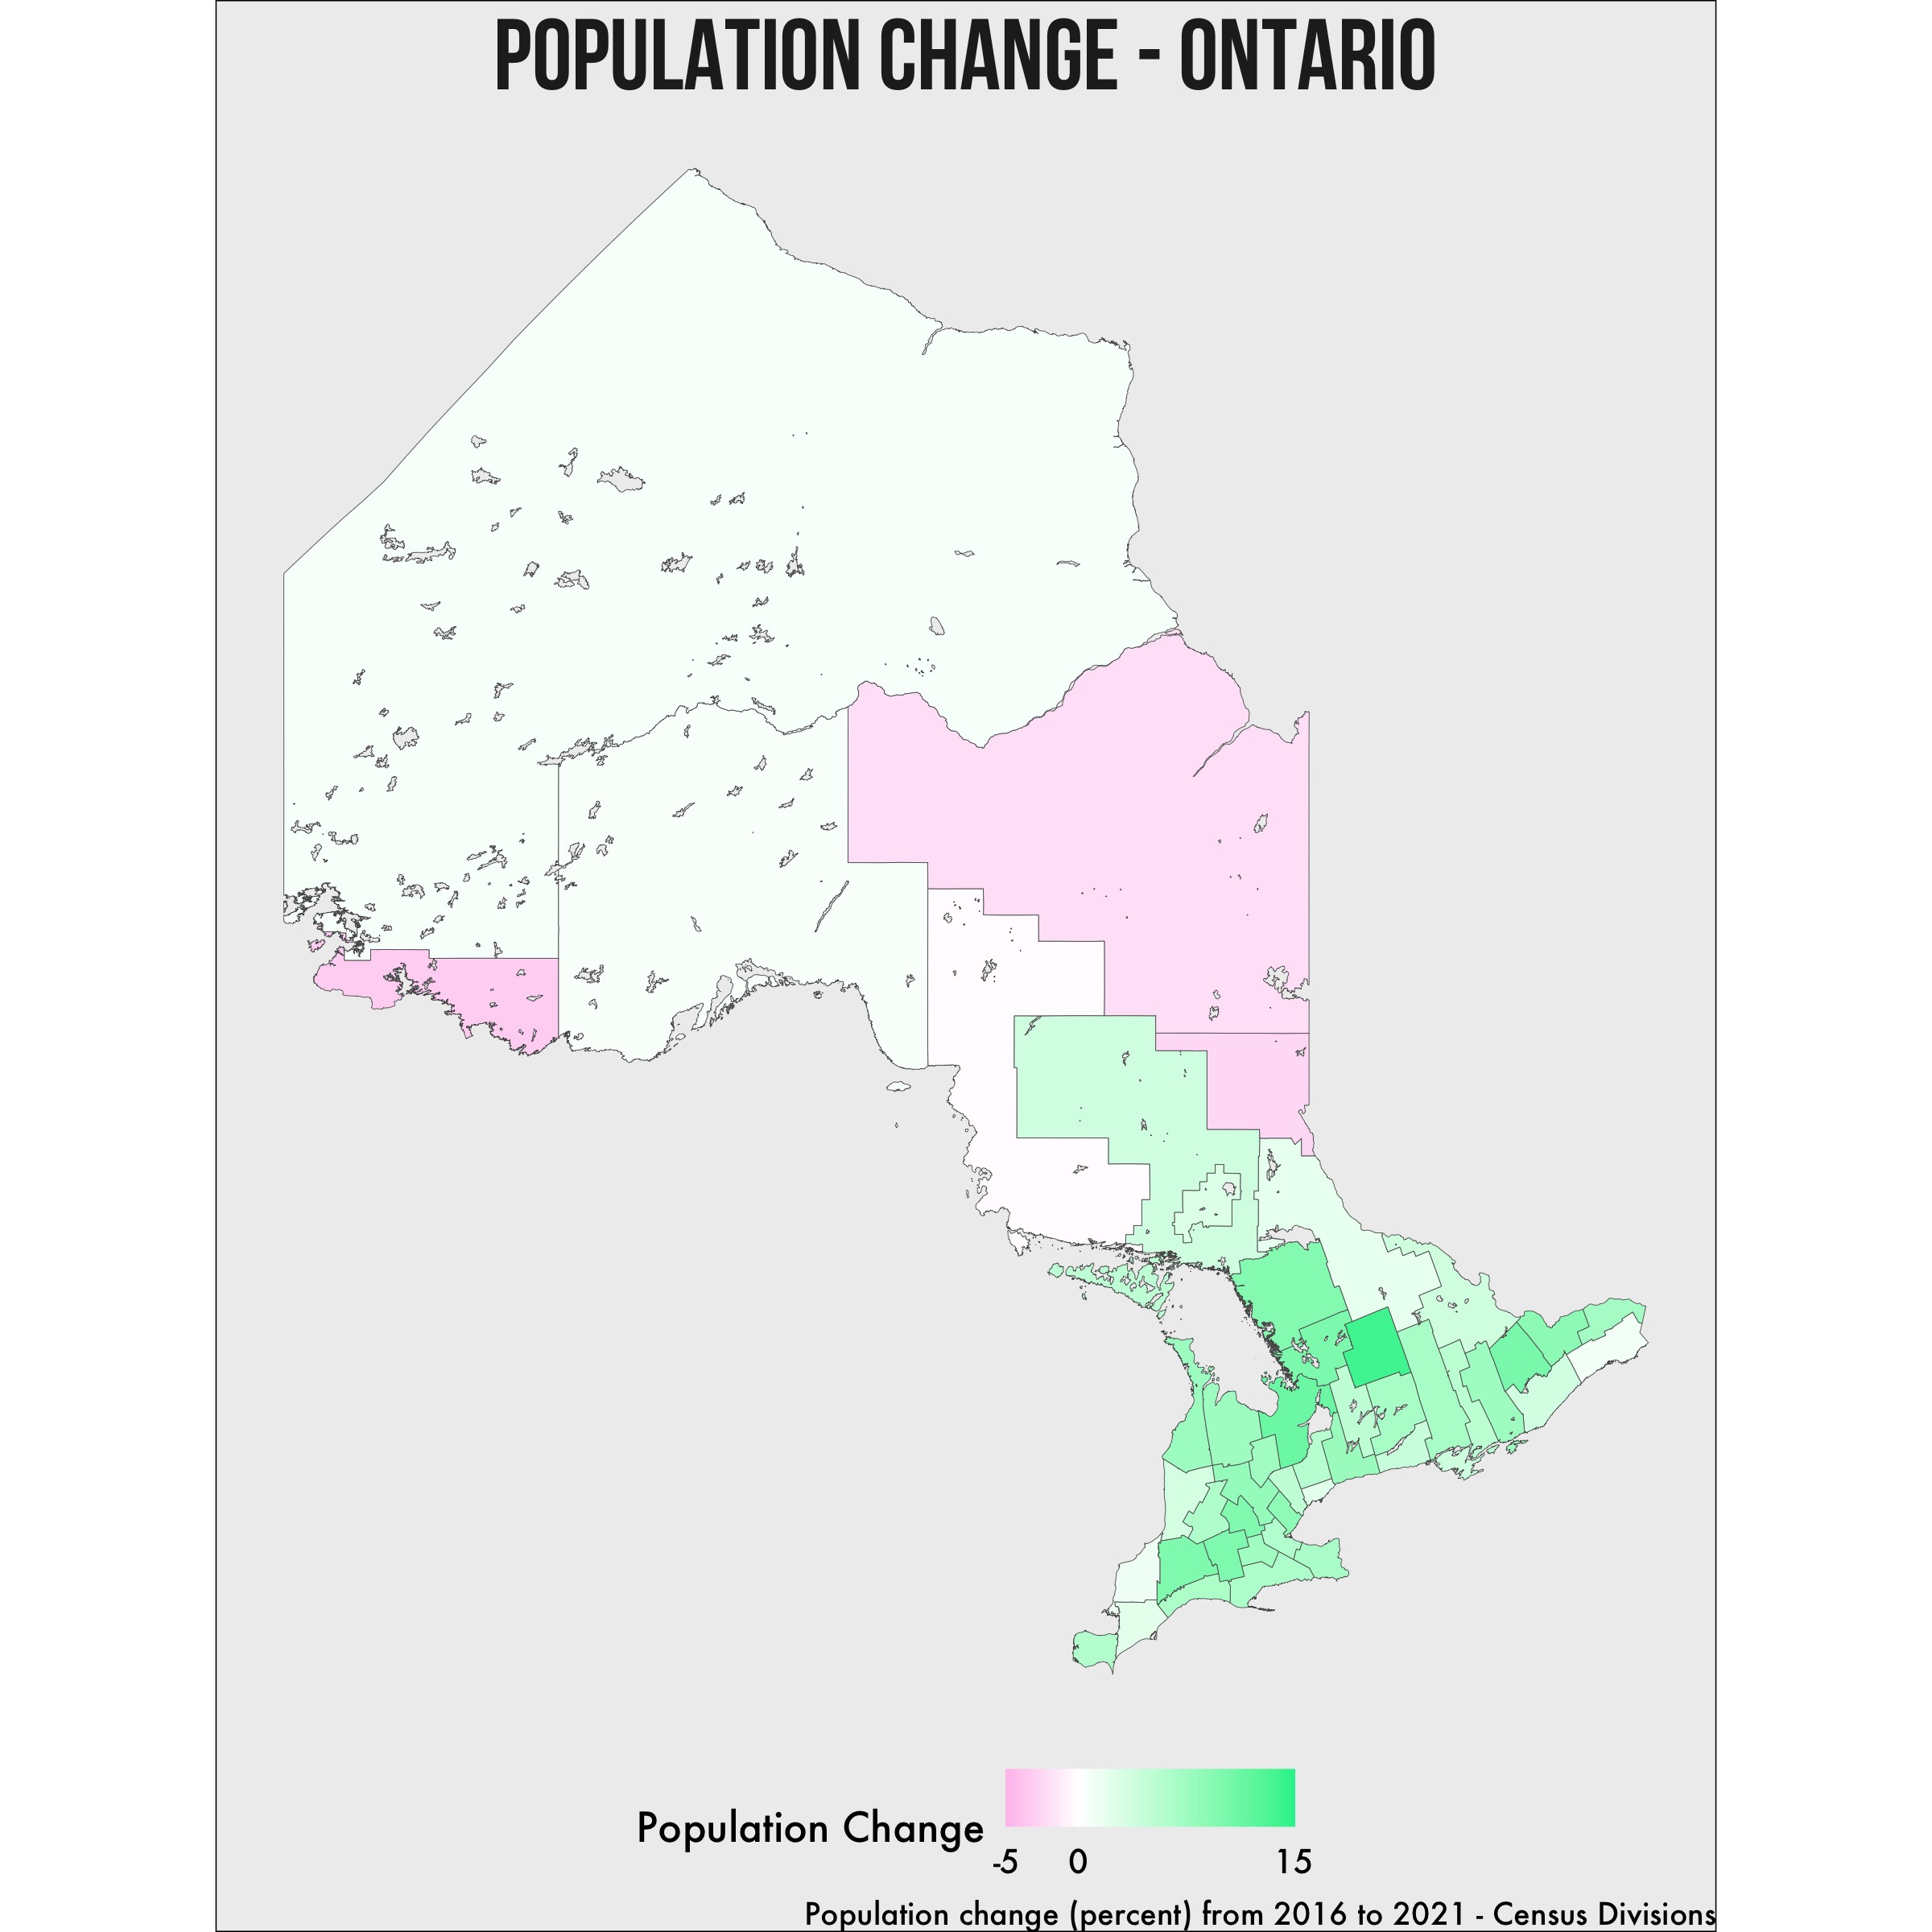
As a province, Ontario’s population grew by 775,448 from 13,448,494 in 2016 to 14,223,942 in 2021. 45 of the 49 census divisions in the province saw growth.
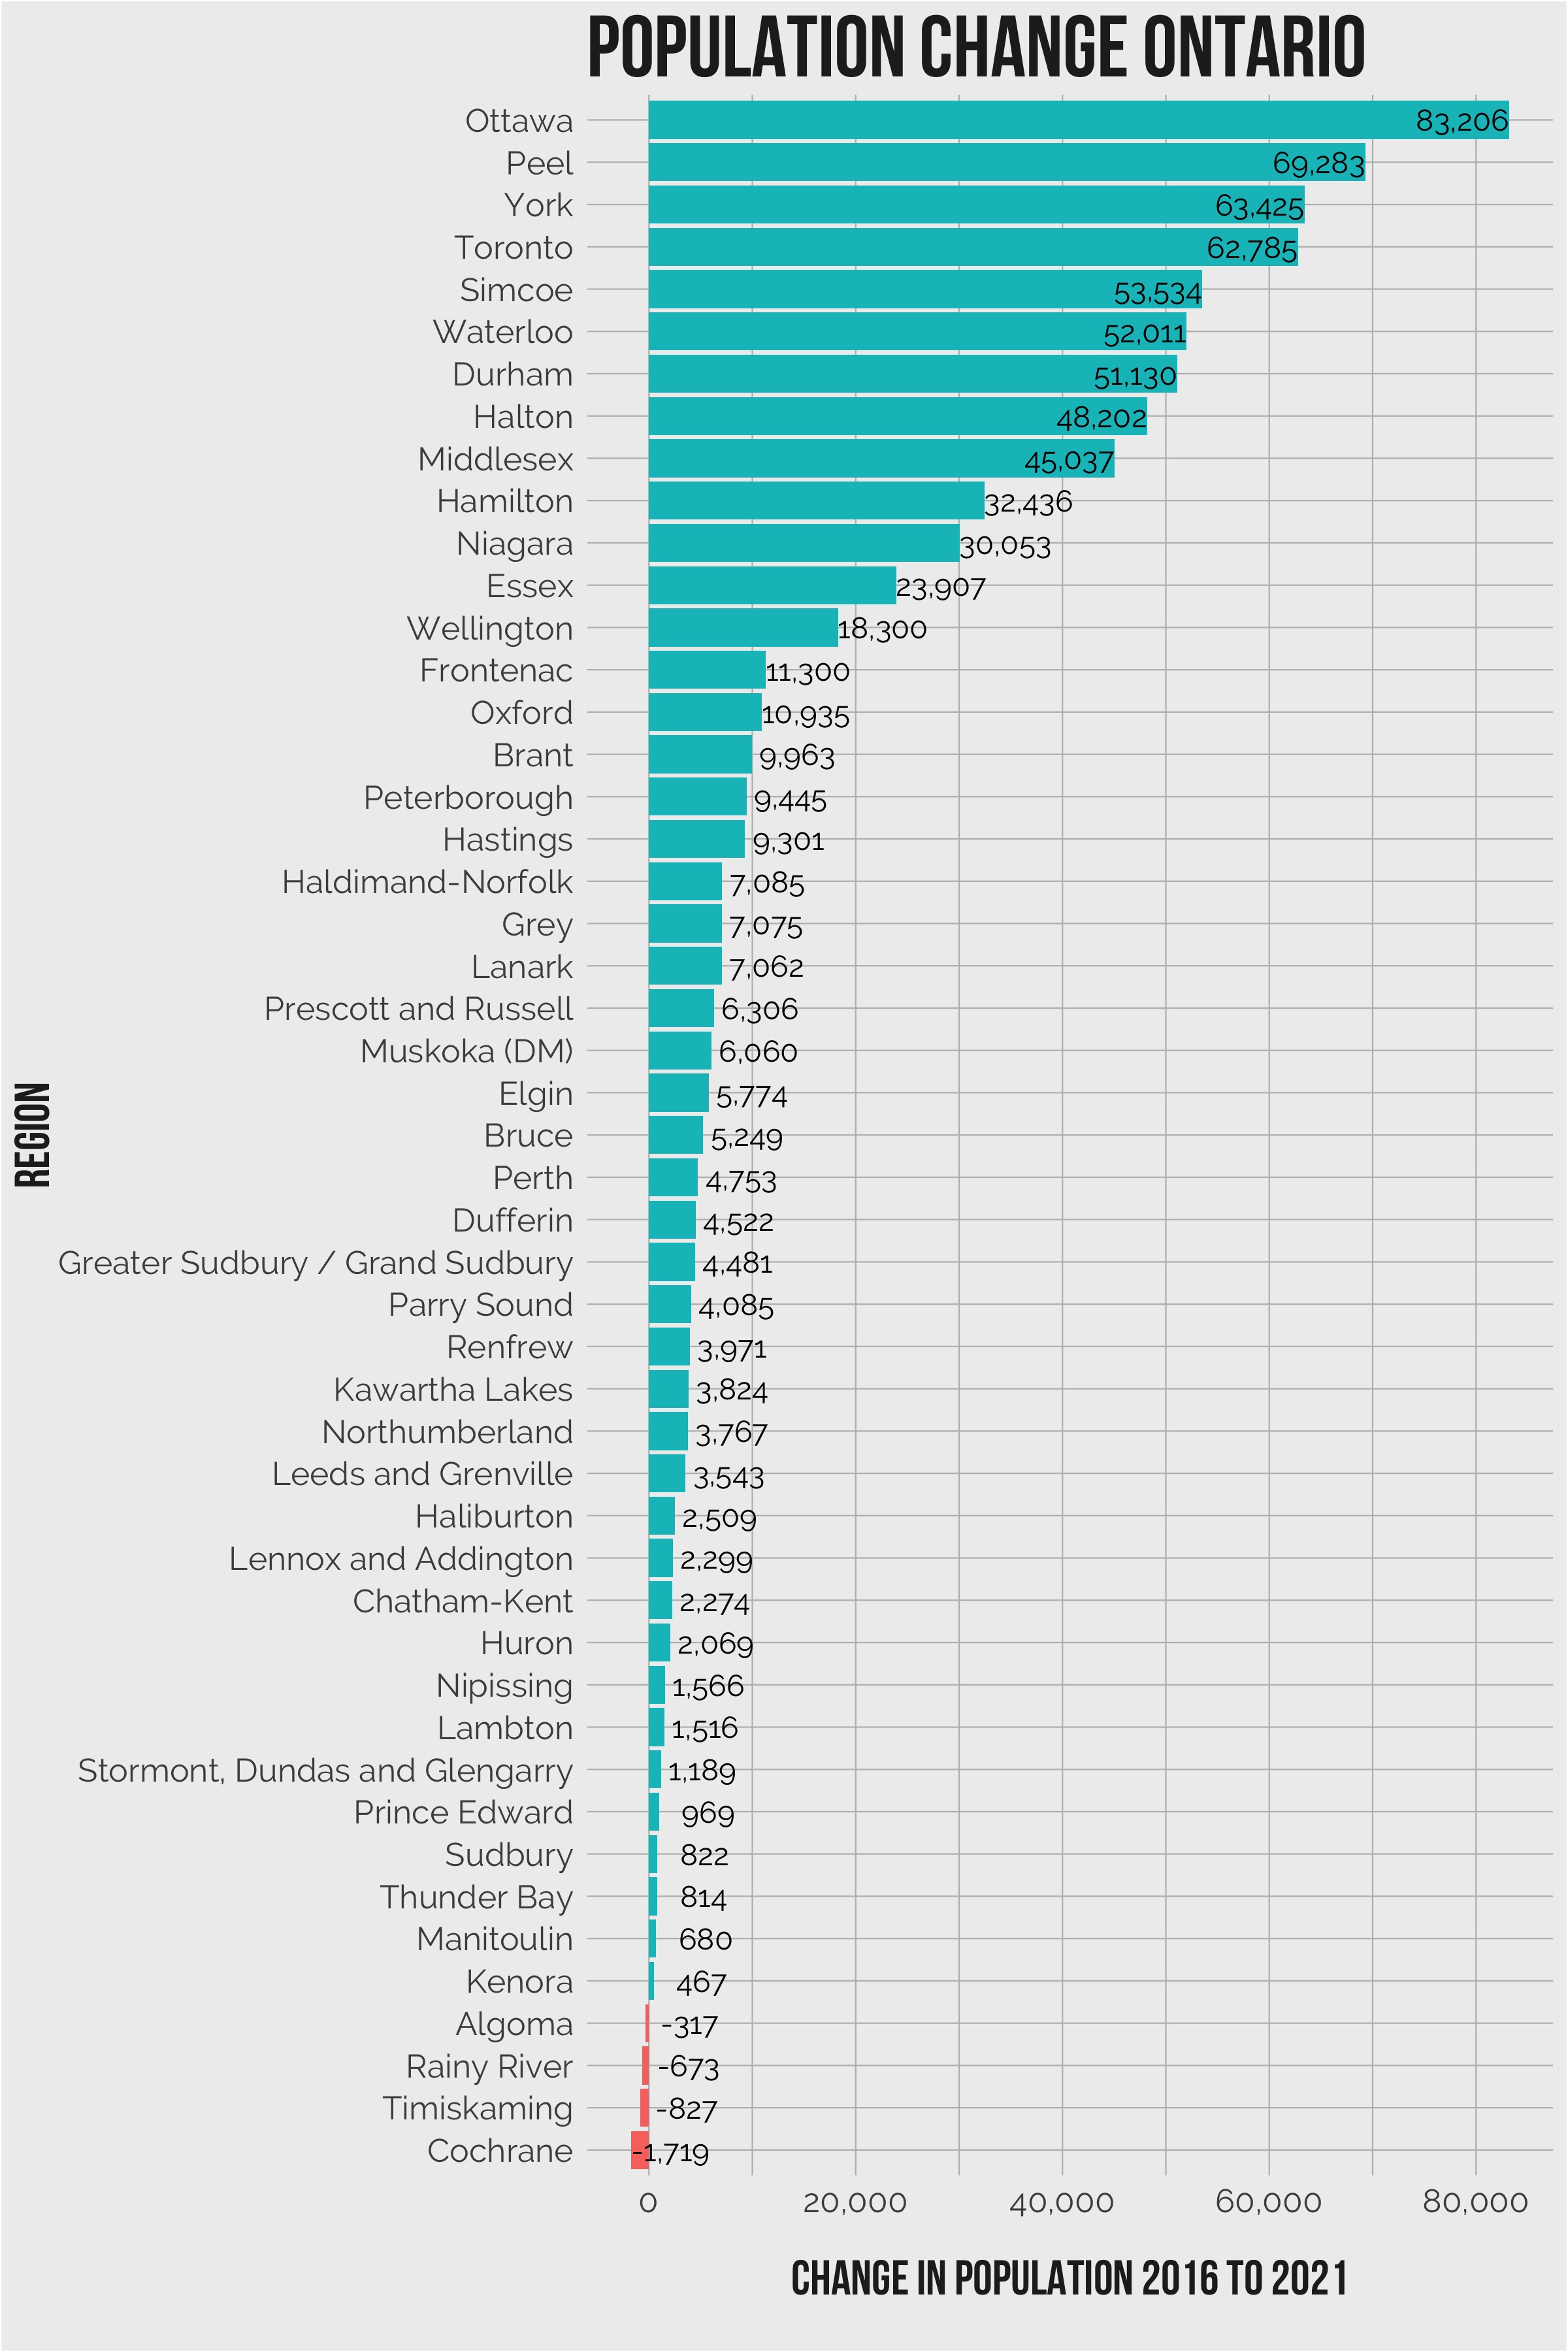
Haliburton saw the highest percentage increase in population at nearly 14%, but for absolute increases, Ottawa saw the largest increase in population of 83,206 residents from 934,243 in 2016 to 1,017,449 in 2021 (8.9%).
| Region | Population 2016 | Population 2021 | Population Difference | Population Difference Percent |
|---|---|---|---|---|
| Ottawa | 934,243 | 1,017,449 | 83,206 | 8.91 |
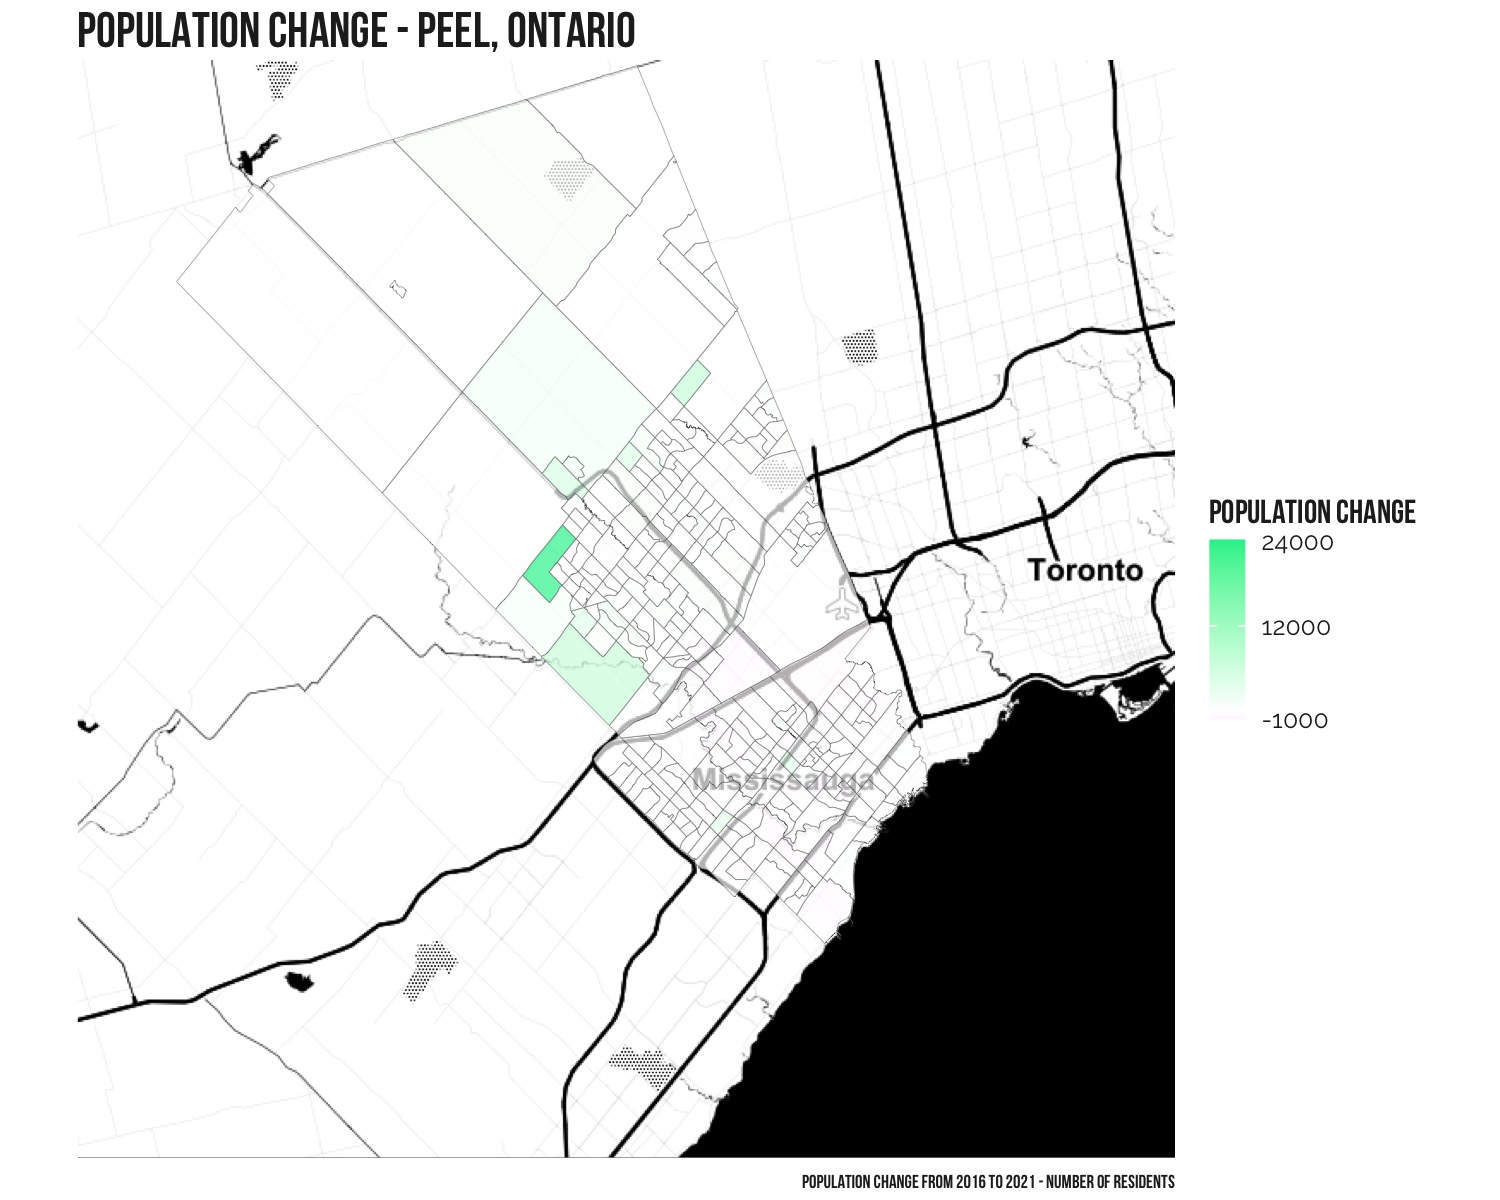
| Peel | 1,381,739 | 1,451,022 | 69,283 | 5.01 |
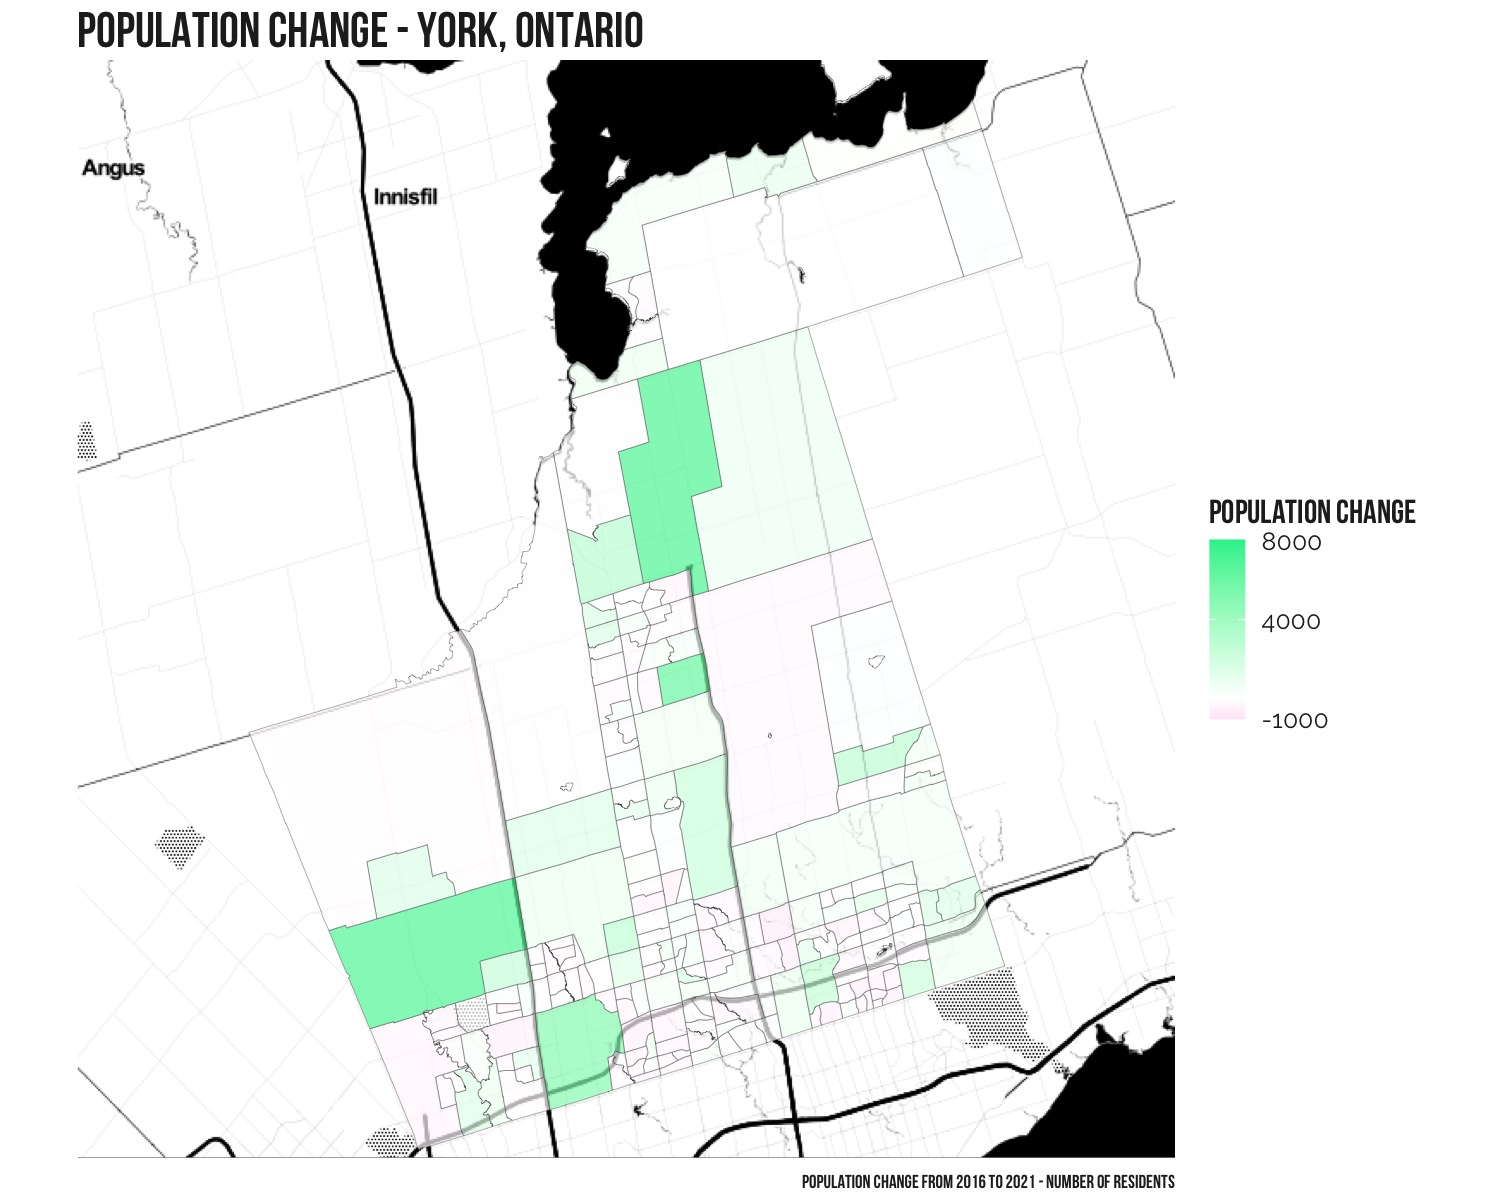
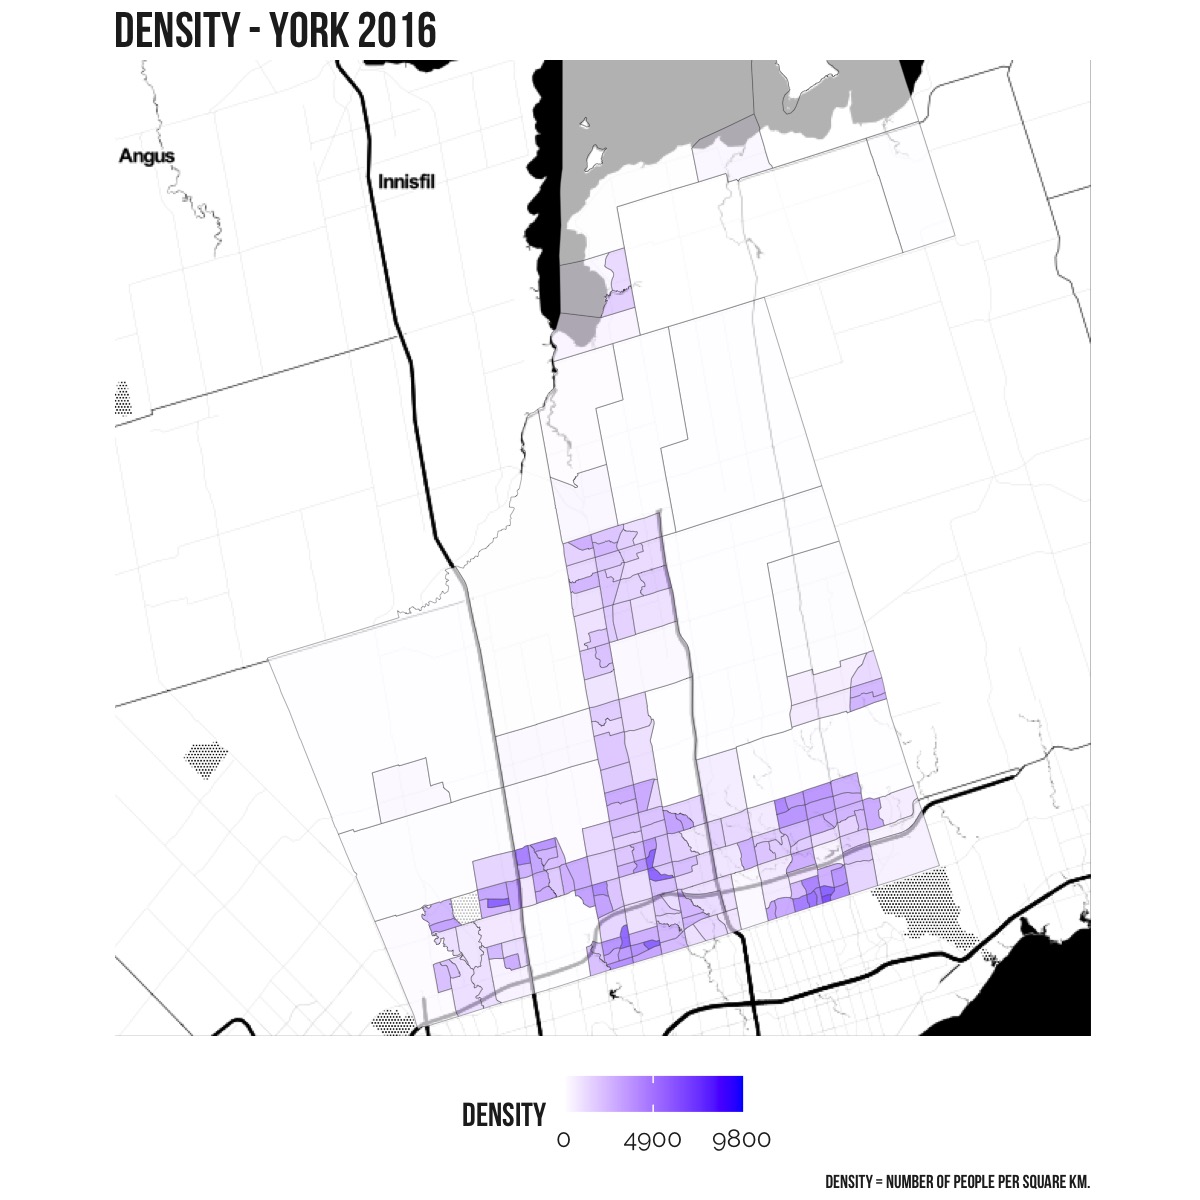
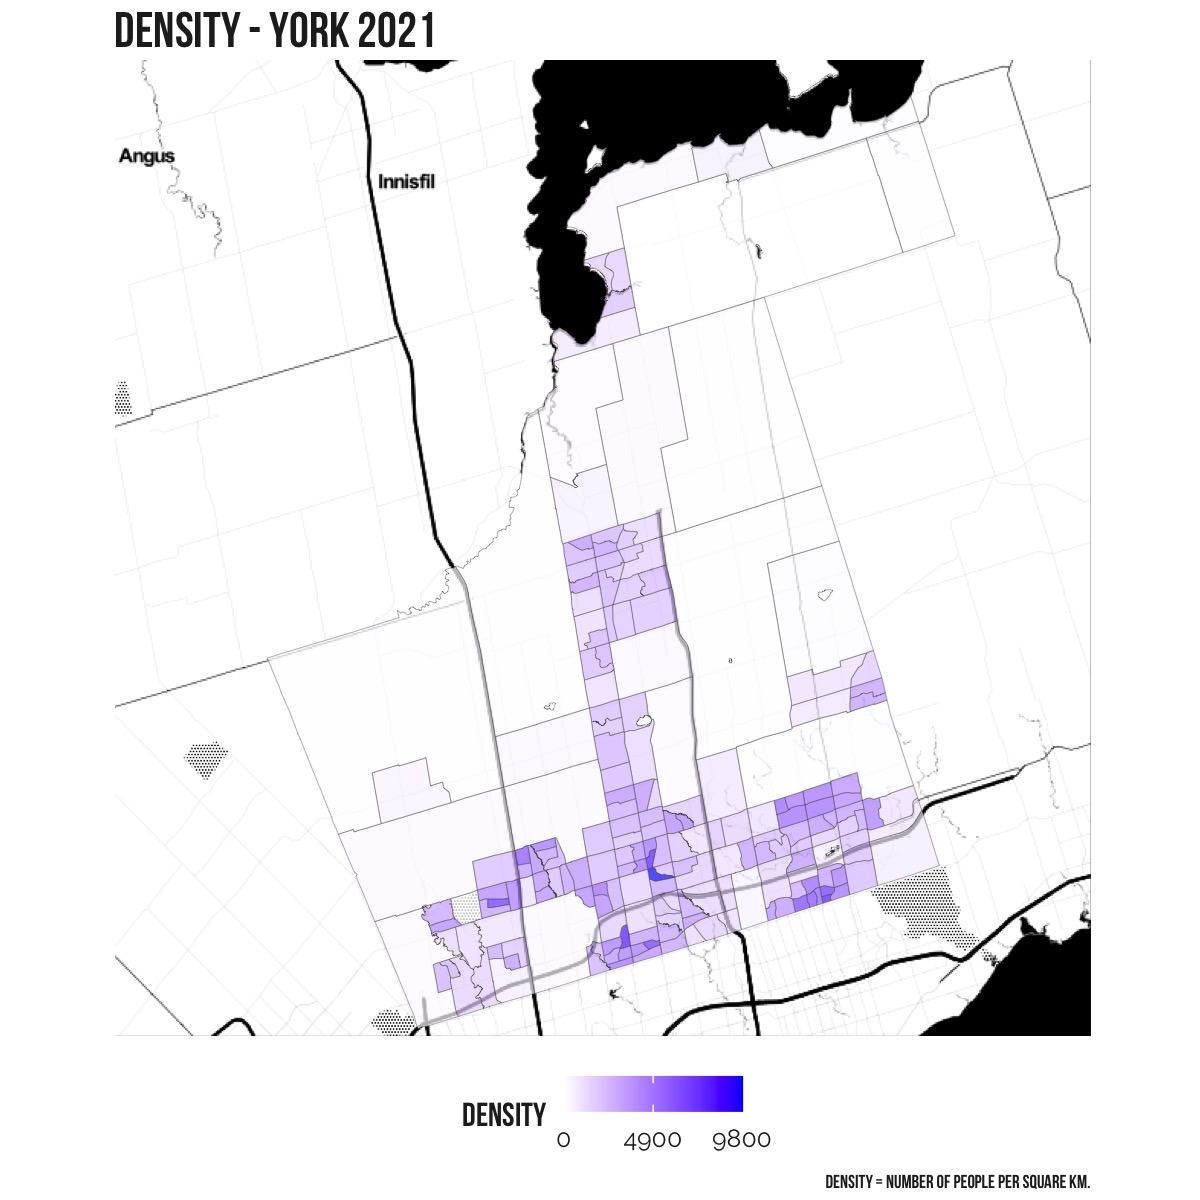
| York | 1,109,909 | 1,173,334 | 63,425 | 5.71 |
| Toronto | 2,731,571 | 2,794,356 | 62,785 | 2.3 |
| Simcoe | 479,635 | 533,169 | 53,534 | 11.16 |
| Waterloo | 535,154 | 587,165 | 52,011 | 9.72 |
| Durham | 645,862 | 696,992 | 51,130 | 7.92 |
| Halton | 548,435 | 596,637 | 48,202 | 8.79 |
| Middlesex | 455,526 | 500,563 | 45,037 | 9.89 |
| Hamilton | 536,917 | 569,353 | 32,436 | 6.04 |
| Niagara | 447,888 | 477,941 | 30,053 | 6.71 |
| Essex | 398,953 | 422,860 | 23,907 | 5.99 |
| Wellington | 222,726 | 241,026 | 18,300 | 8.22 |
| Frontenac | 150,480 | 161,780 | 11,300 | 7.51 |
| Oxford | 110,846 | 121,781 | 10,935 | 9.87 |
| Brant | 134,808 | 144,771 | 9,963 | 7.39 |
| Peterborough | 138,236 | 147,681 | 9,445 | 6.83 |
| Hastings | 136,445 | 145,746 | 9,301 | 6.82 |
| Haldimand-Norfolk | 109,787 | 116,872 | 7,085 | 6.45 |
| Grey | 93,830 | 100,905 | 7,075 | 7.54 |
| Lanark | 68,698 | 75,760 | 7,062 | 10.28 |
| Prescott and Russell | 89,333 | 95,639 | 6,306 | 7.06 |
| Muskoka (DM) | 60,614 | 66,674 | 6,060 | 10 |
| Elgin | 88,978 | 94,752 | 5,774 | 6.49 |
| Bruce | 68,147 | 73,396 | 5,249 | 7.7 |
| Perth | 76,812 | 81,565 | 4,753 | 6.19 |
| Dufferin | 61,735 | 66,257 | 4,522 | 7.32 |
| Greater Sudbury / Grand Sudbury | 161,647 | 166,128 | 4,481 | 2.77 |
| Parry Sound | 42,824 | 46,909 | 4,085 | 9.54 |
| Renfrew | 102,394 | 106,365 | 3,971 | 3.88 |
| Kawartha Lakes | 75,423 | 79,247 | 3,824 | 5.07 |
| Northumberland | 85,598 | 89,365 | 3,767 | 4.4 |
| Leeds and Grenville | 100,527 | 104,070 | 3,543 | 3.52 |
| Haliburton | 18,062 | 20,571 | 2,509 | 13.89 |
| Lennox and Addington | 42,883 | 45,182 | 2,299 | 5.36 |
| Chatham-Kent | 102,042 | 104,316 | 2,274 | 2.23 |
| Huron | 59,297 | 61,366 | 2,069 | 3.49 |
| Nipissing | 83,150 | 84,716 | 1,566 | 1.88 |
| Lambton | 126,638 | 128,154 | 1,516 | 1.2 |
| Stormont, Dundas and Glengarry | 113,448 | 114,637 | 1,189 | 1.05 |
| Prince Edward | 24,735 | 25,704 | 969 | 3.92 |
| Sudbury | 21,546 | 22,368 | 822 | 3.82 |
| Thunder Bay | 146,048 | 146,862 | 814 | 0.56 |
| Manitoulin | 13,255 | 13,935 | 680 | 5.13 |
| Kenora | 65,533 | 66,000 | 467 | 0.71 |
| Algoma | 114,094 | 113,777 | -317 | -0.28 |
| Rainy River | 20,110 | 19,437 | -673 | -3.35 |
| Timiskaming | 32,251 | 31,424 | -827 | -2.56 |
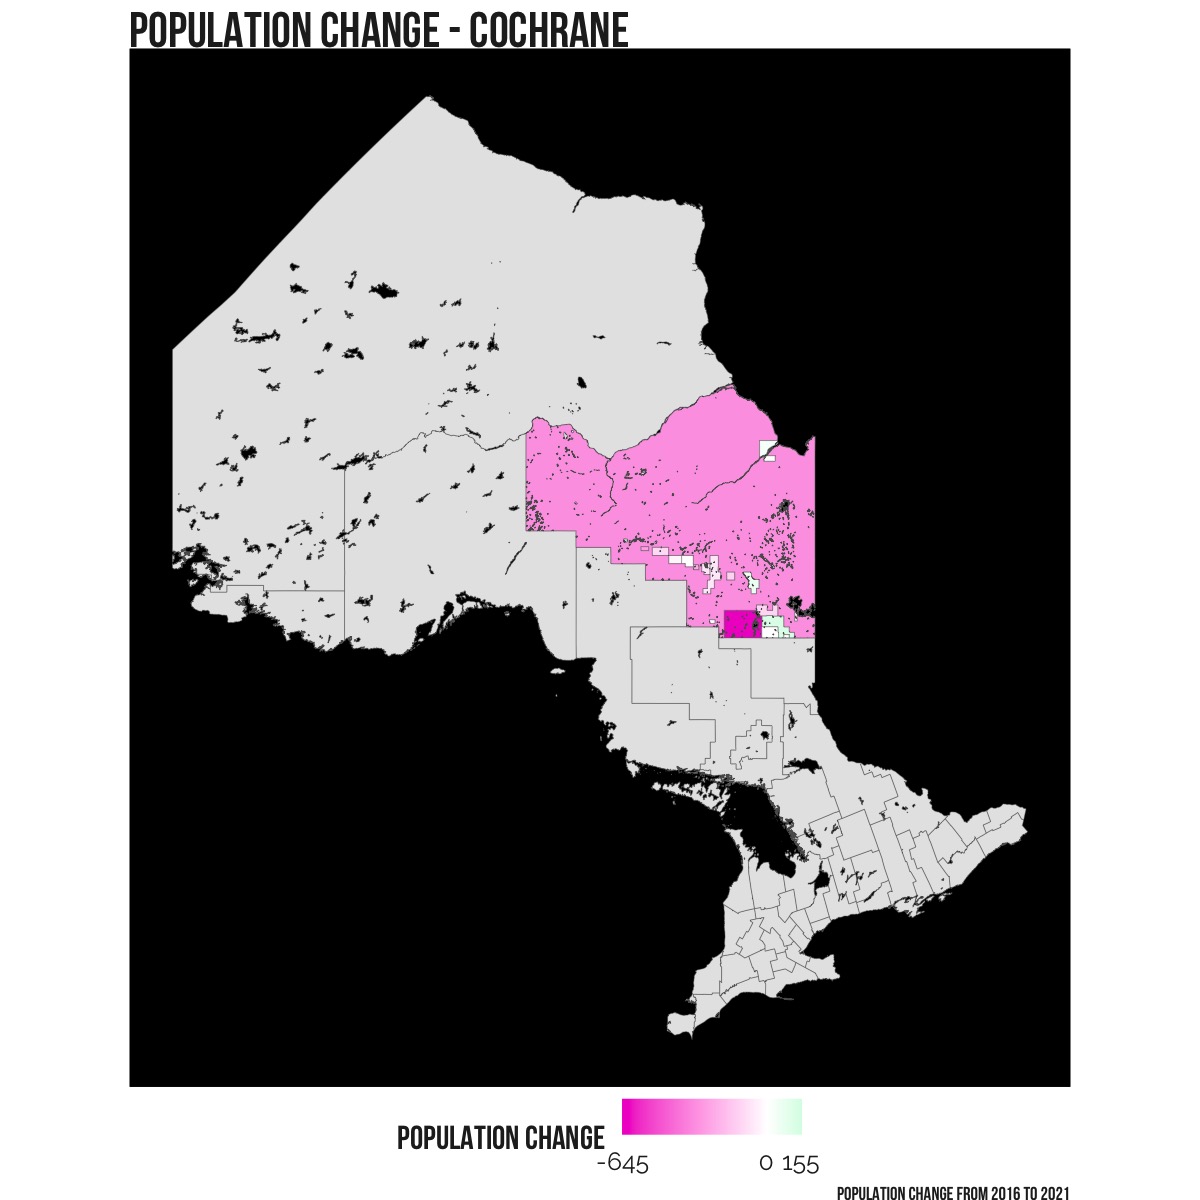
| Cochrane | 79,682 | 77,963 | -1,719 | -2.16 |
Which areas have seen high growth?
Of the 49 census divisions in Ontario, 45 saw population increases between 2016 and 2021. Ottawa saw the largest increase in population of 83,206 residents from 934,243 in 2016 to 1,017,449 in 2021 (8.9%).
The next level down to consider is the census subdivision, which Statistics Canada defines as “the general term for municipalities”.
High growth area #1
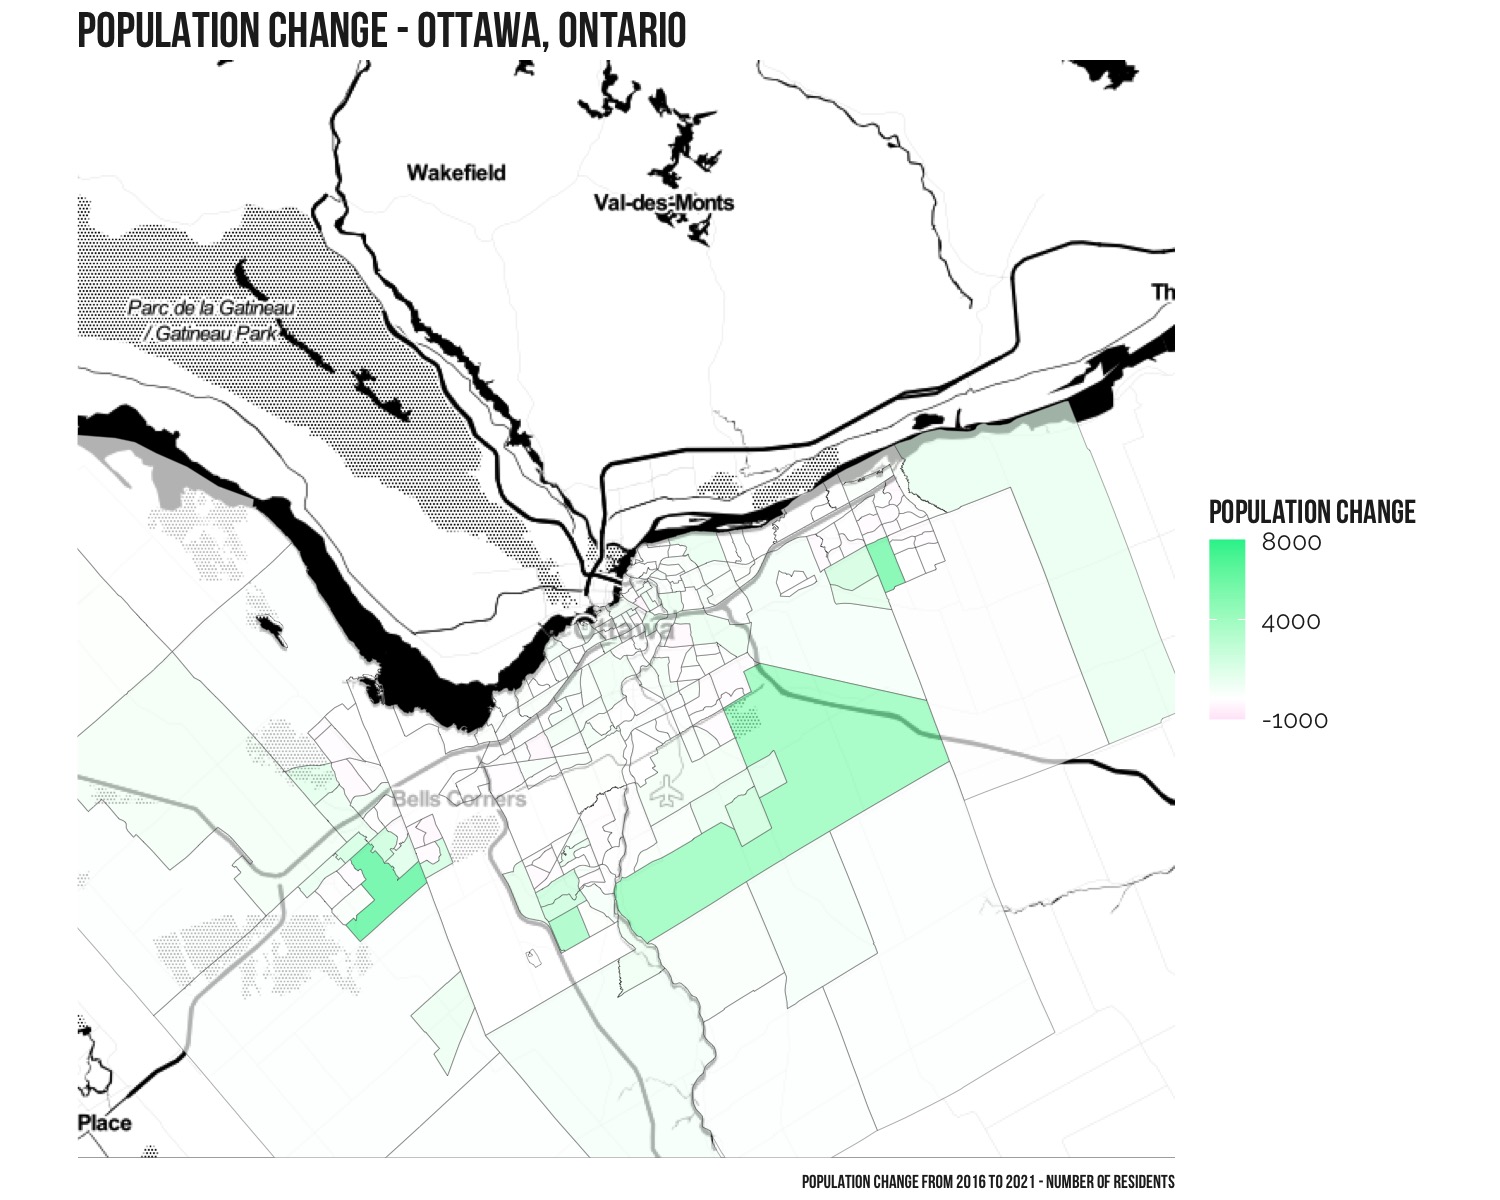
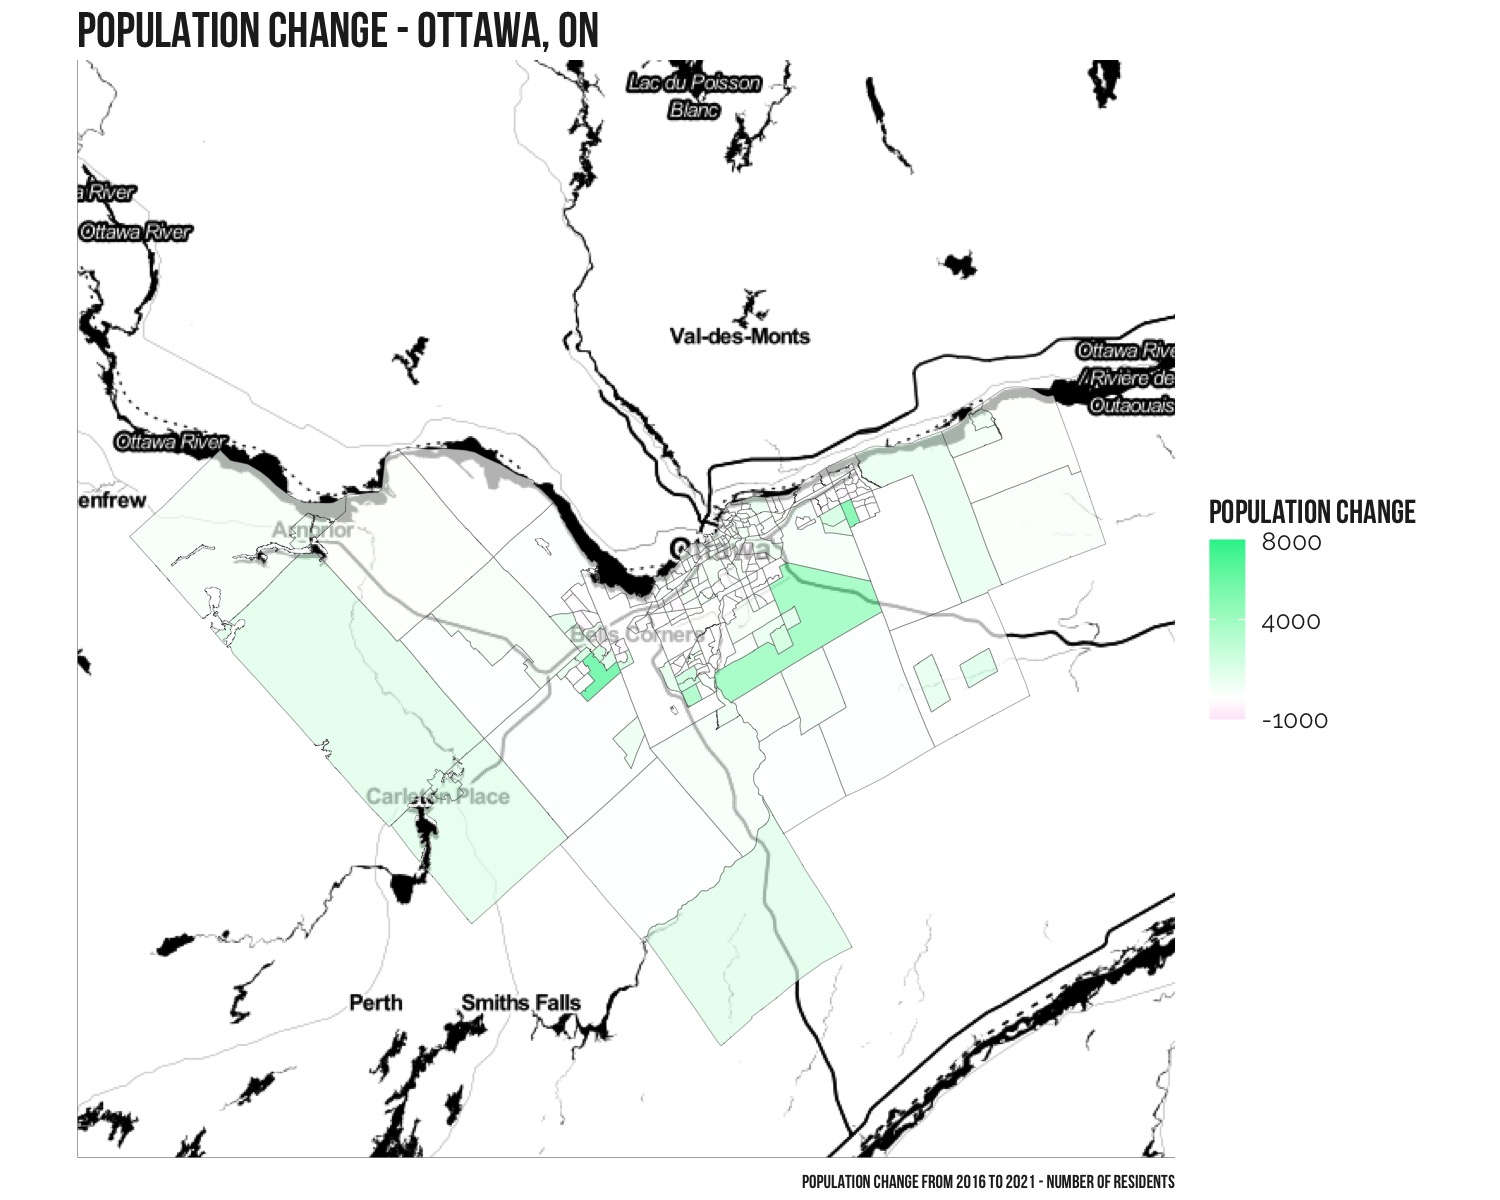
The census subdivision that includes the city of Ottawa saw the most amount of growth within this census division. This area grew by 83,206 residents, from 934,243 in 2016 to 1,017,449 in 2021.
High growth area #2
Peel had the second highest amount of growth within the province. This area grew by 69,283 residents, from 1,381,739 in 2016 to 1,451,022 in 2021.
High growth area #3
York saw the third highest amount of growth within the province. This area grew by 63,425 residents, from 1,109,909 in 2016 to 1,173,334 in 2021.
Which areas have seen the lowest growth?
Only 4 of the 49 census divisions saw a drop in population. The highest decline in absolute numbers was Cochrane which saw a drop of 1,719 from 79,682 in 2016 to 77,963 in 2021.

Population changes in major cities
There are 32 census metropolitan areas in Ontario. Statistics Canada defines a census metropolitan area (CMA) as “…one or more adjacent municipalities centred on a population centre (known as the core). A CMA must have a total population of at least 100,000 of which 50,000 or more must live in the core.”
The three largest CMAs in Ontario by population are Toronto, Ottawa, and Hamilton.
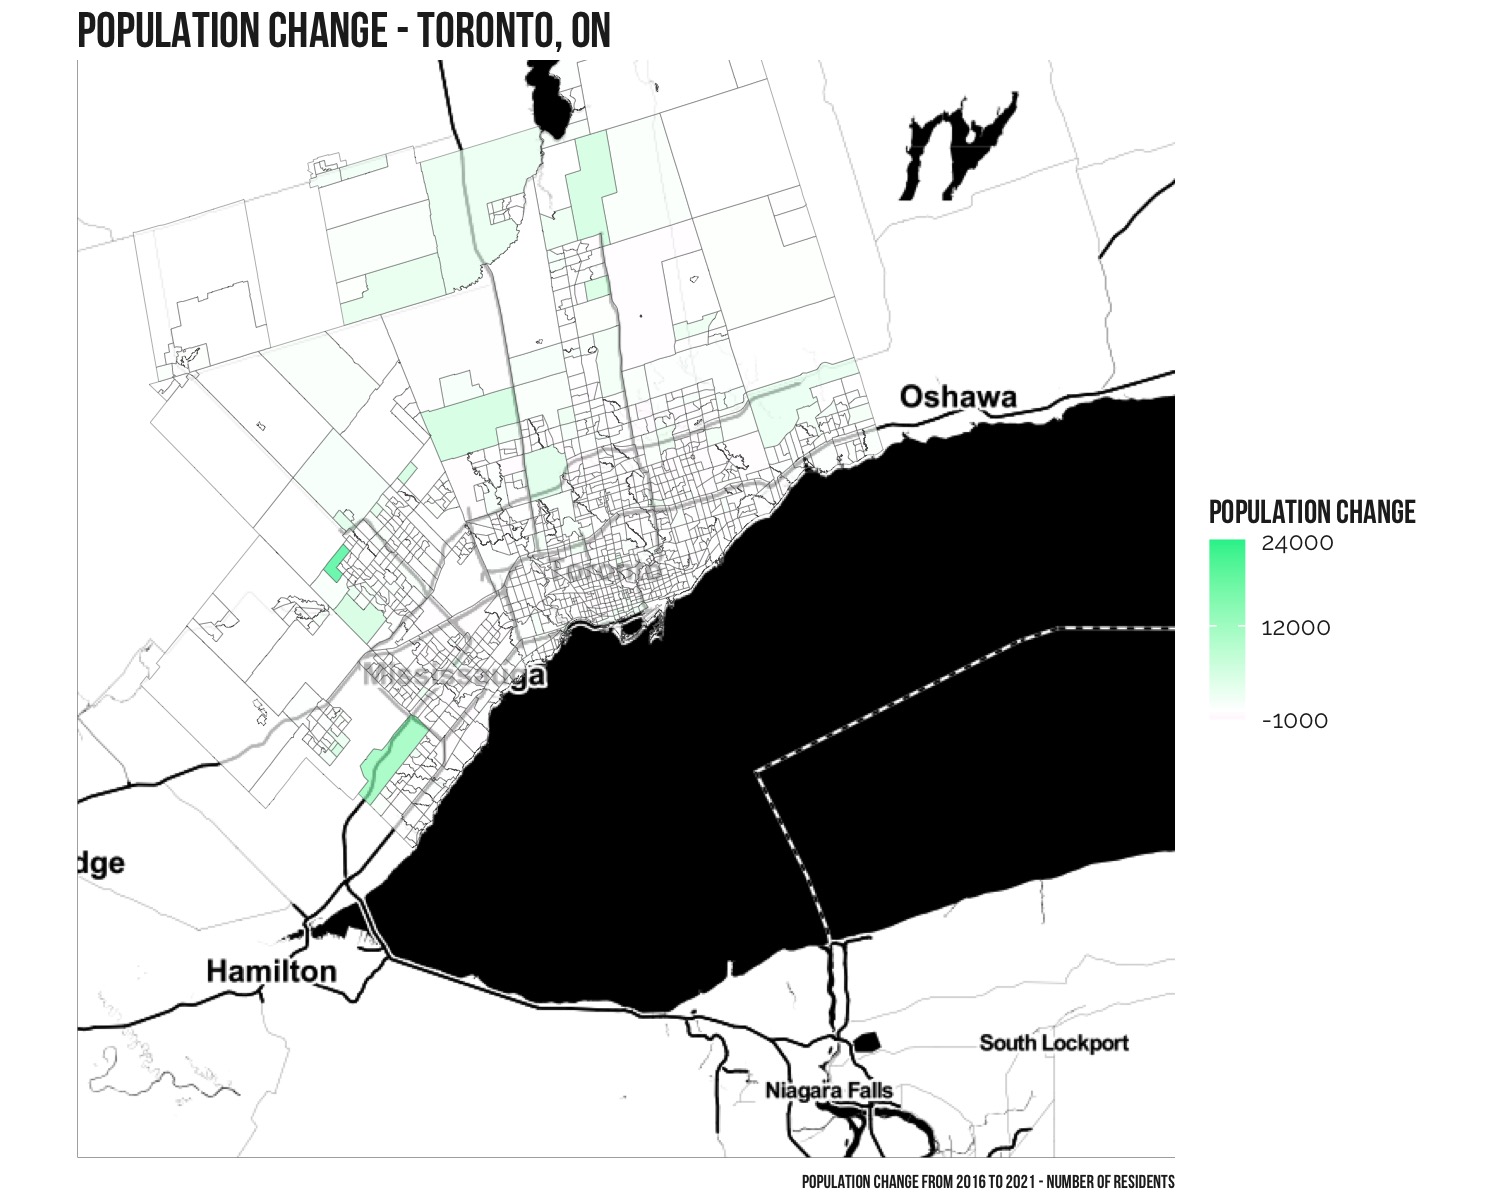
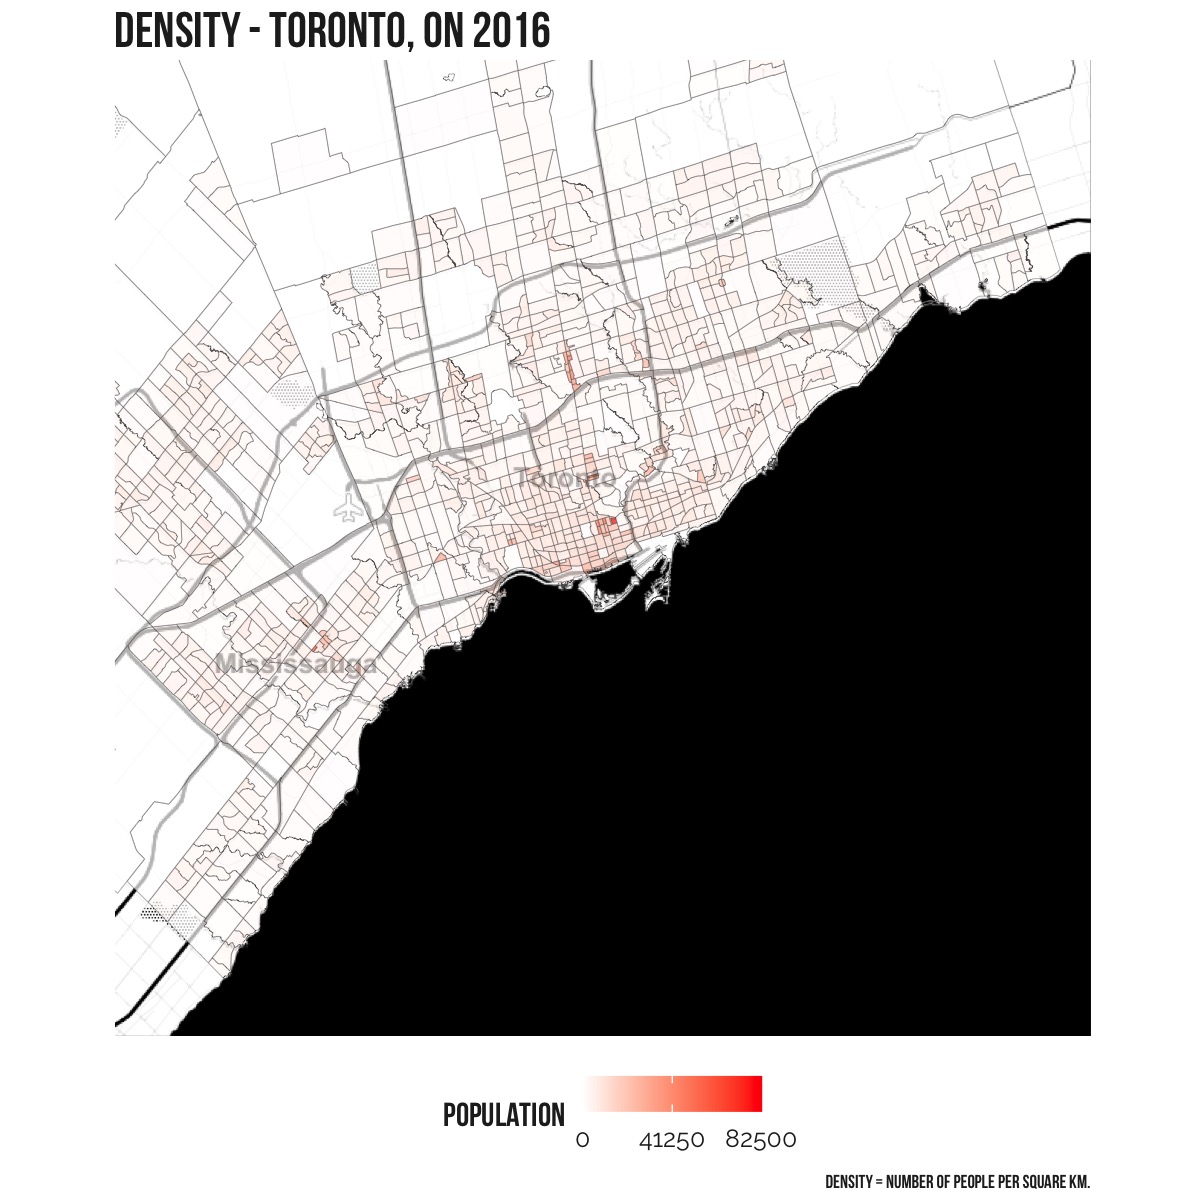
CMA – Toronto
The census metropolitan area (CMA) of Toronto grew by 274,185 residents from 5,928,040 in 2016 to 6,202,225 in 2021. Brampton and North Oakville saw substantial growth.

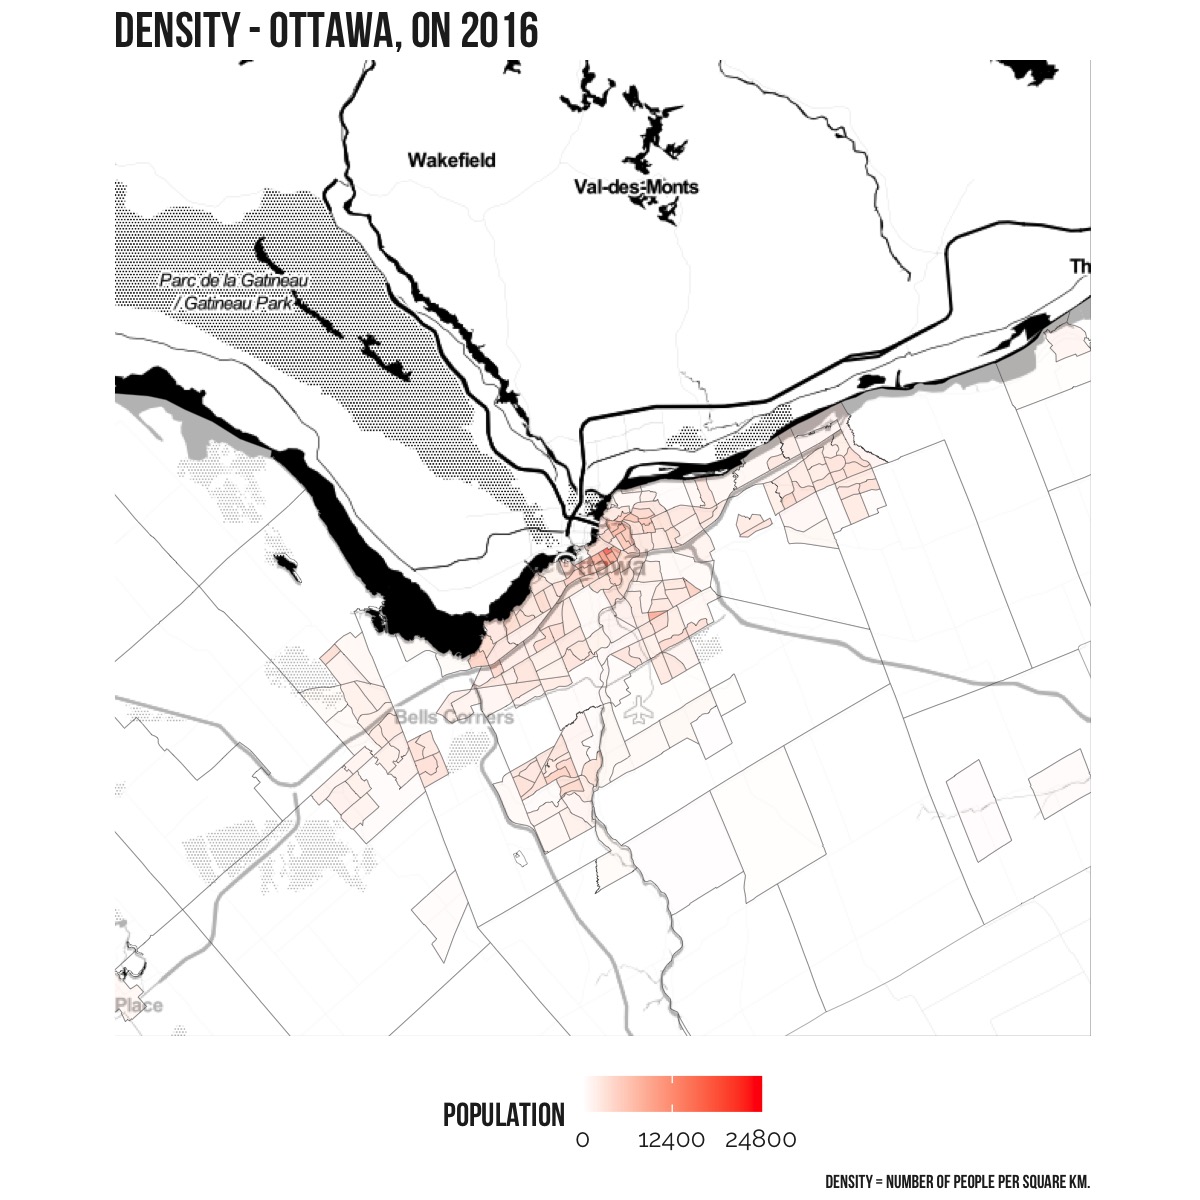
CMA – Ottawa
The census metropolitan area (CMA) of Ottawa grew by 95,864 residents from 1,039,150 in 2016 to 1,135,014 in 2021.

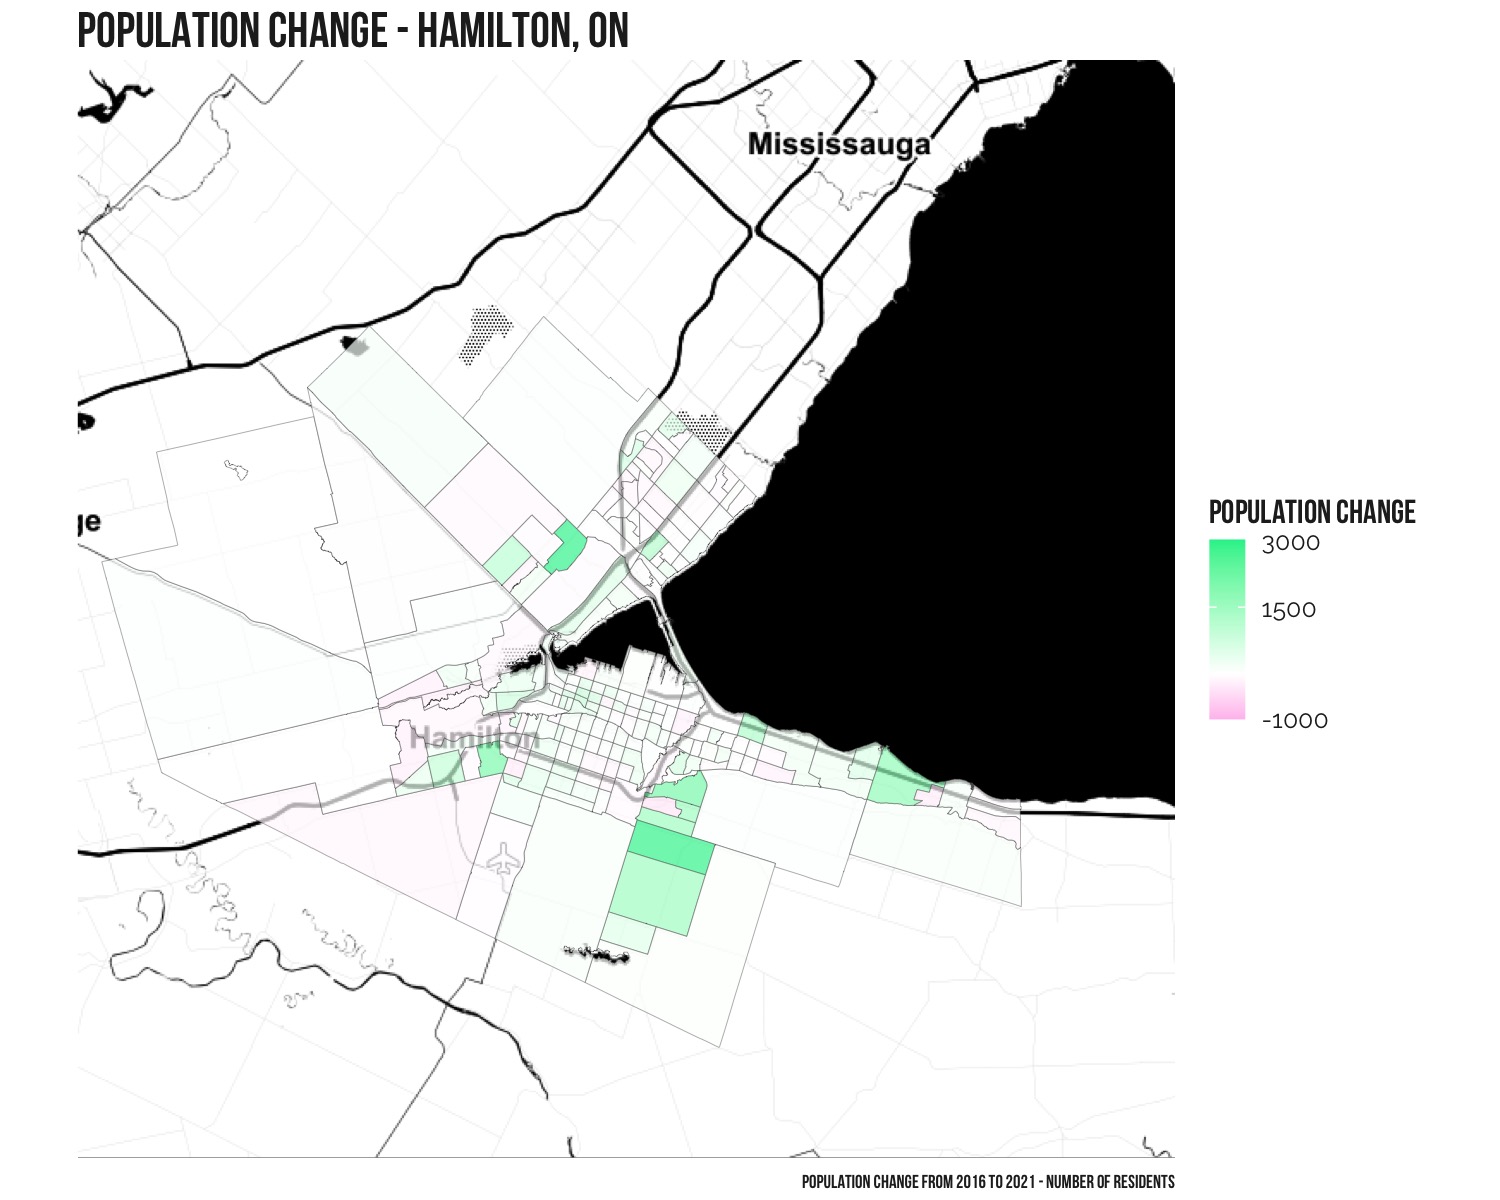
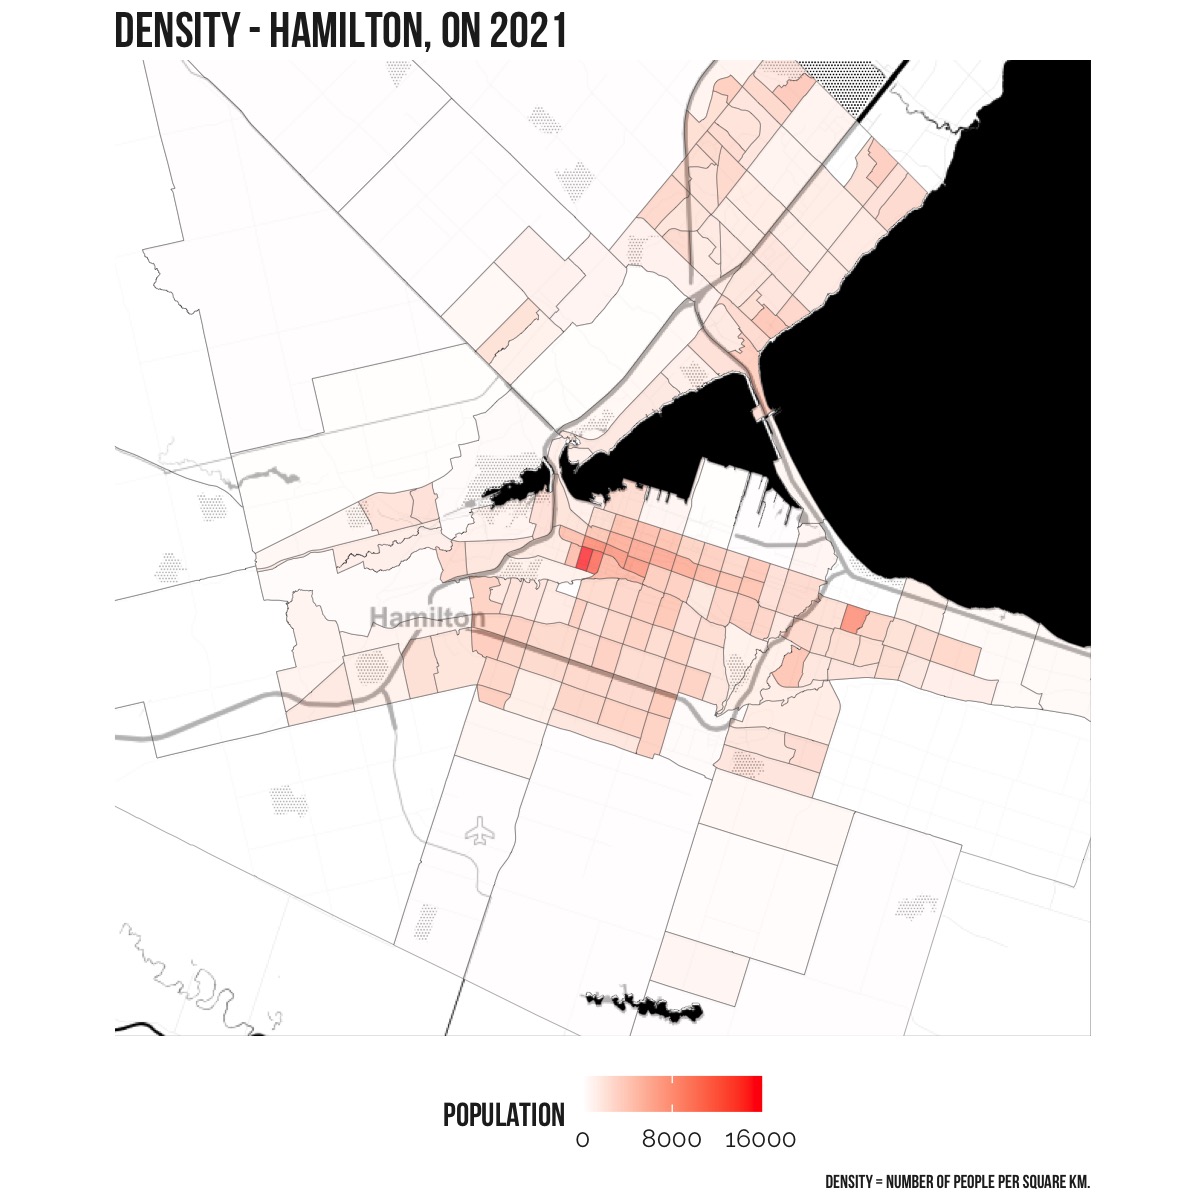
CMA – Hamilton
The census metropolitan area (CMA) of Hamilton grew by 63,425 residents from 1,109,909 in 2016 to 1,173,334 in 2021. Waterdown, Stoney Creek mountain, and Grimsby all saw substantial growth.

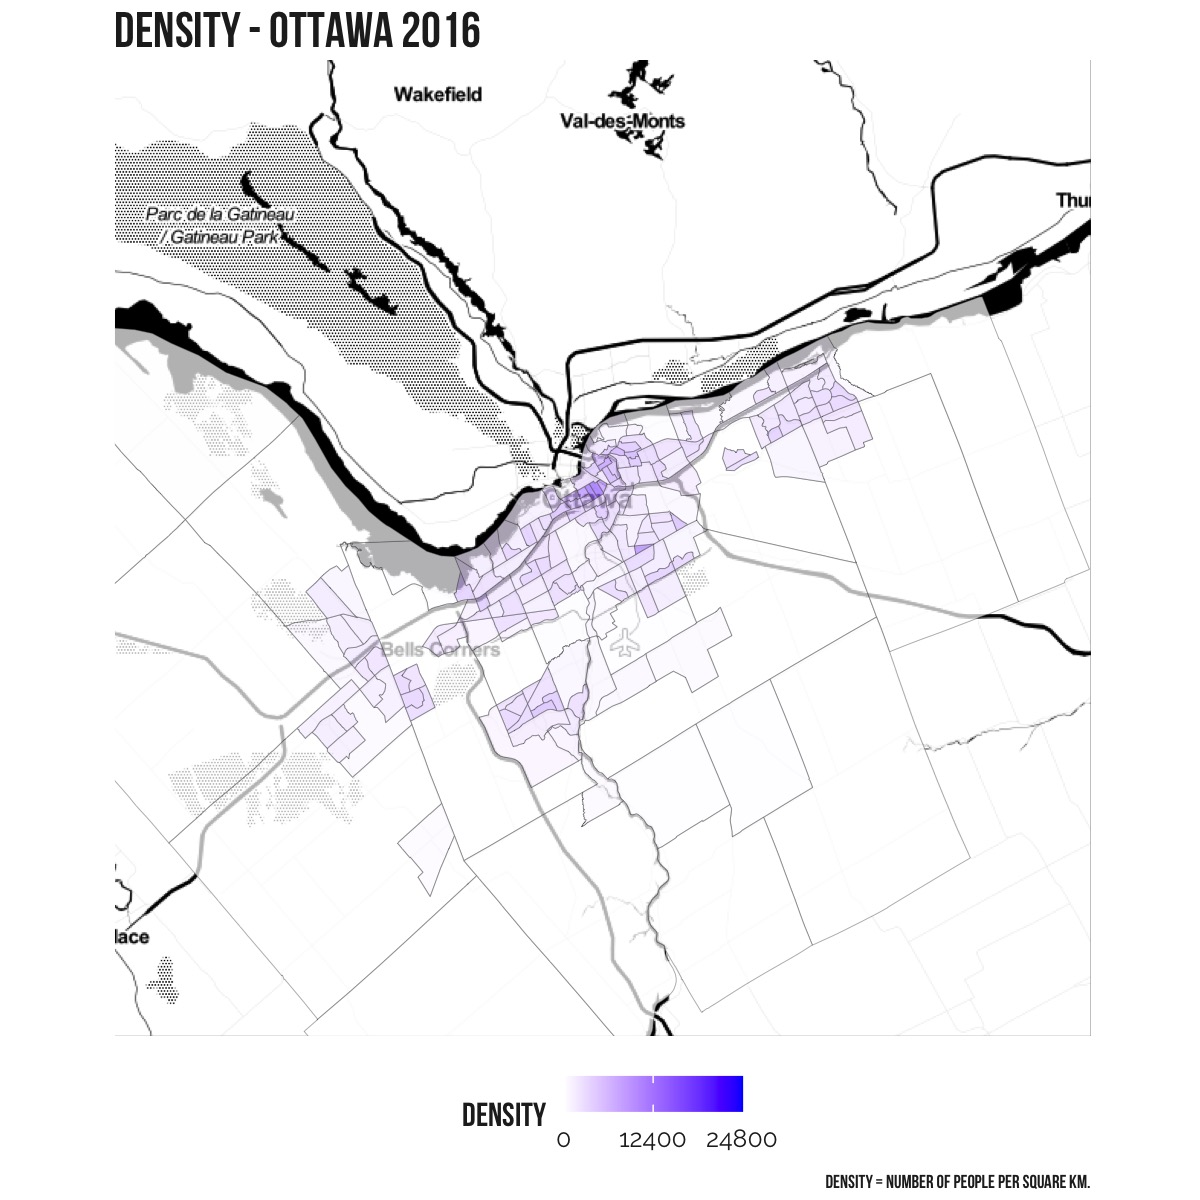
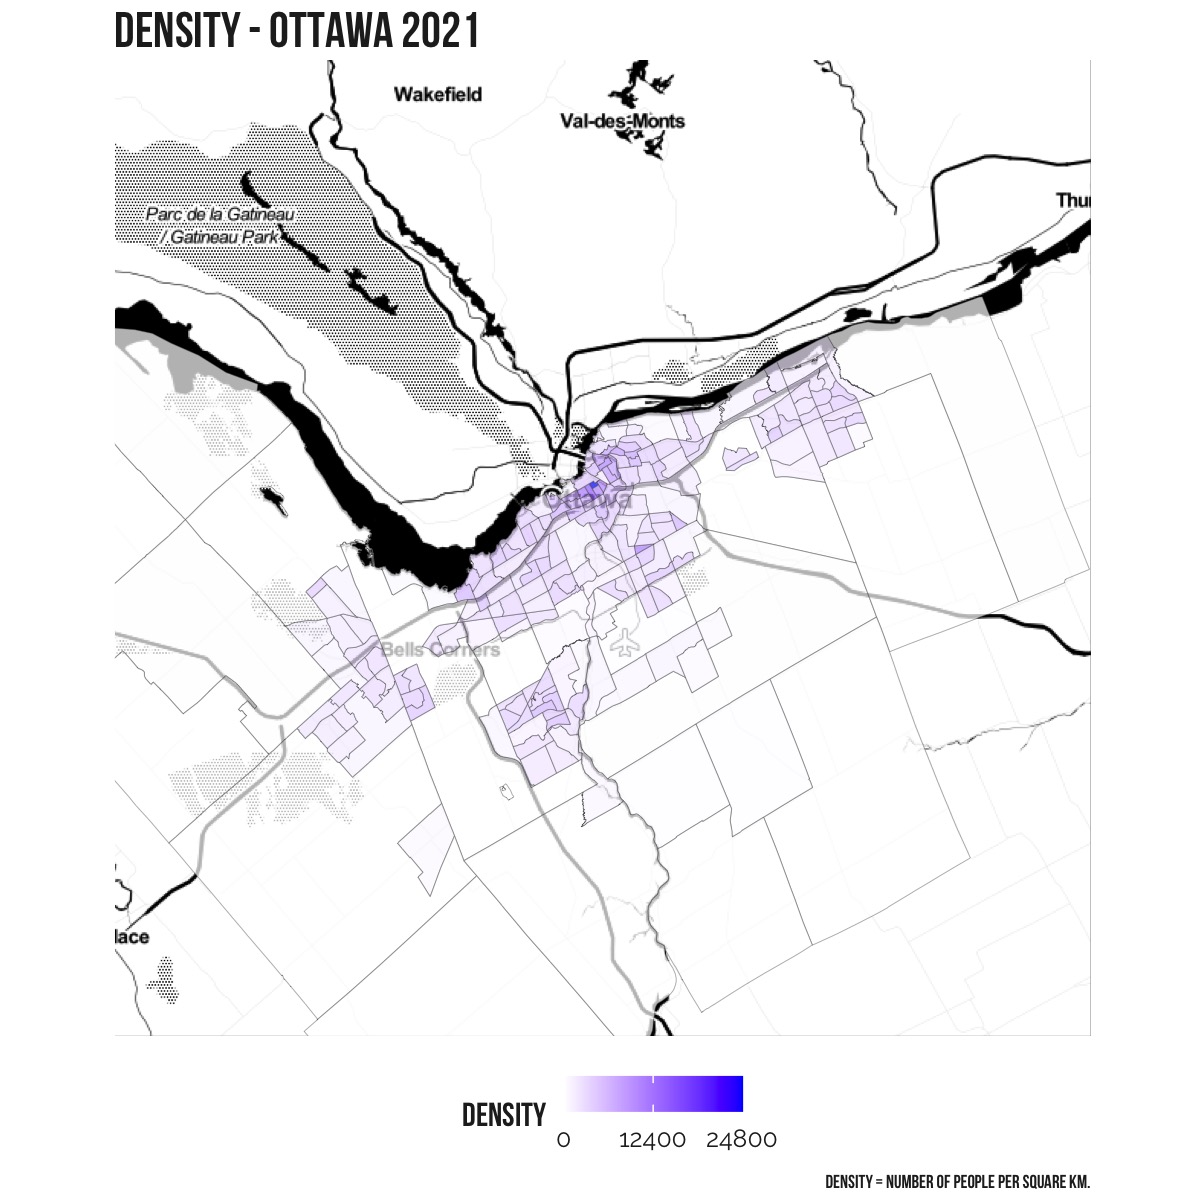
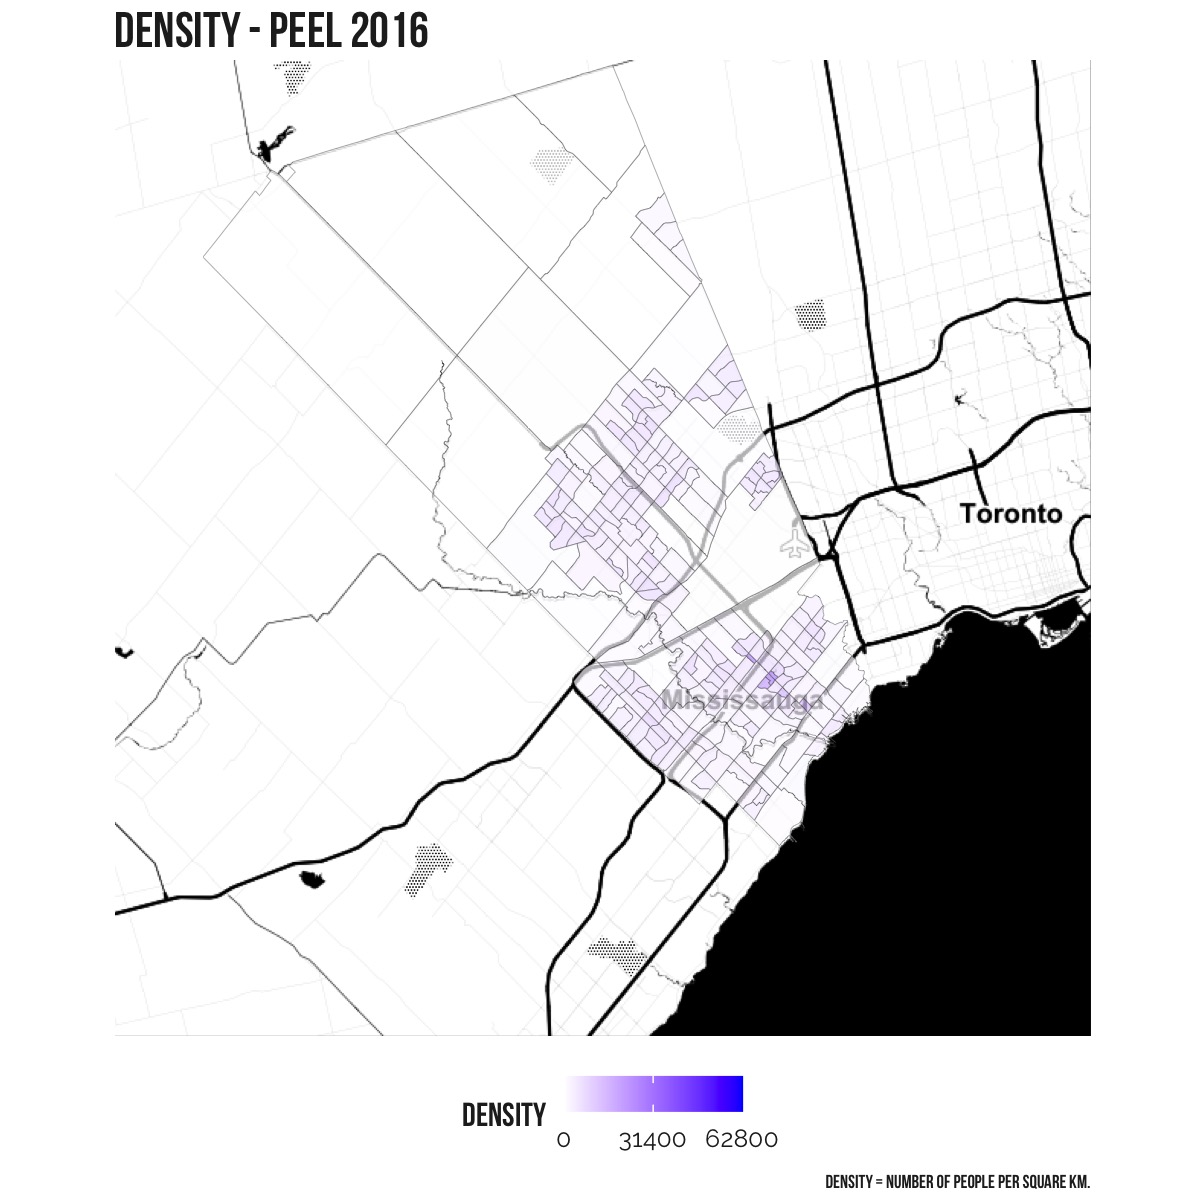
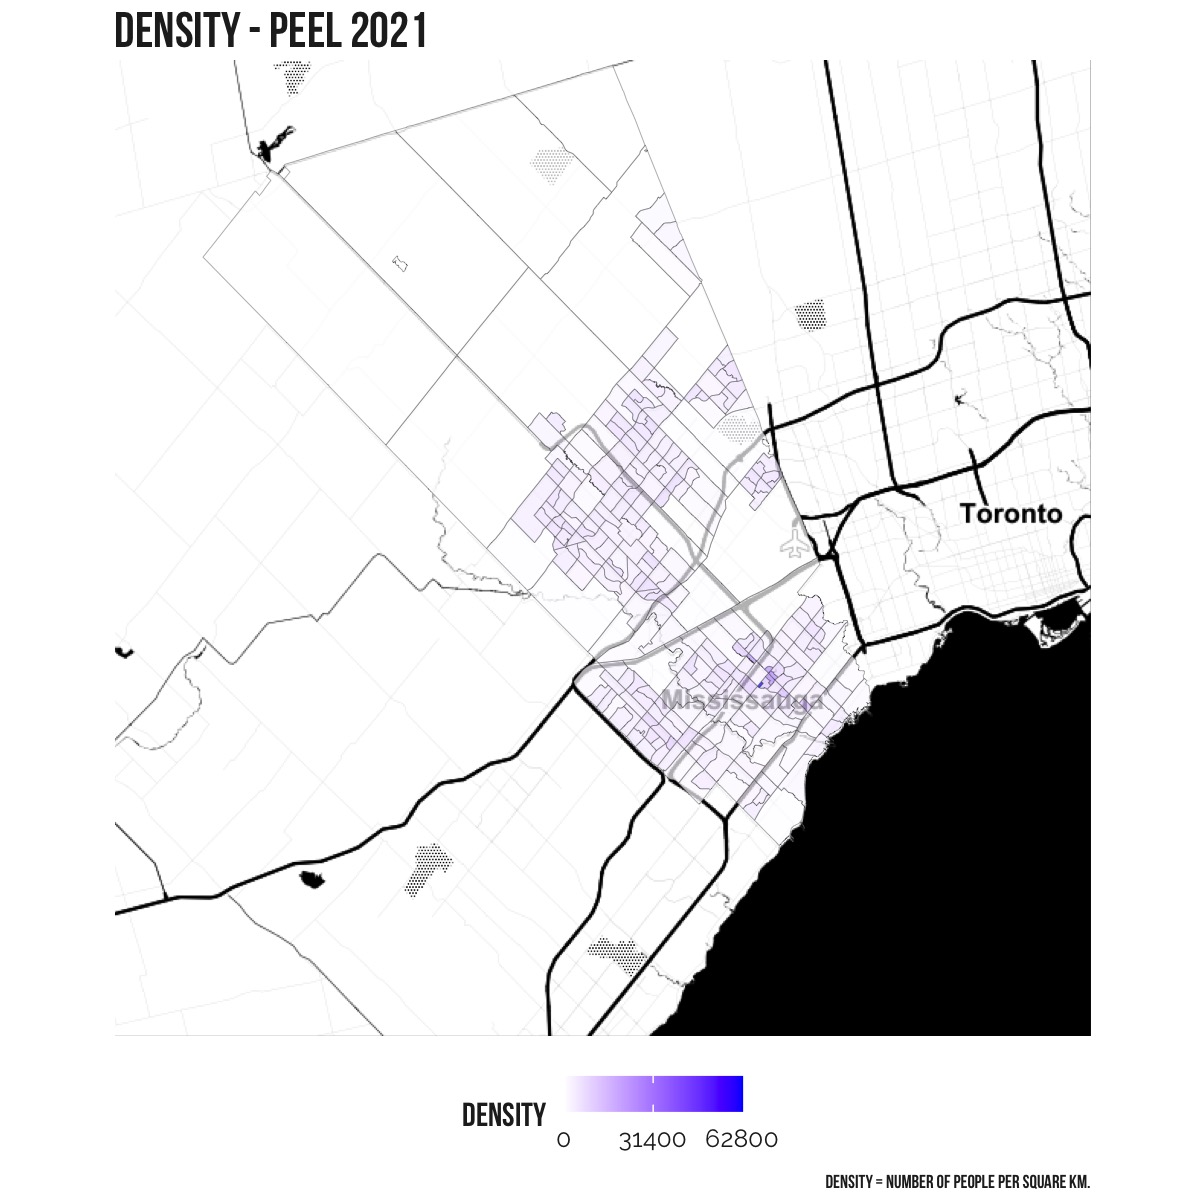
Overall population density