The 2021 census has been released and that means it is time to dive right into some population trends. Canadian population numbers have changed substantially between 2016 and 2021 and this post will go into more detail about Saskatchewan. You can also read more about the population changes in Nova Scotia, New Brunswick, Newfoundland, PEI, Quebec, and Ontario.
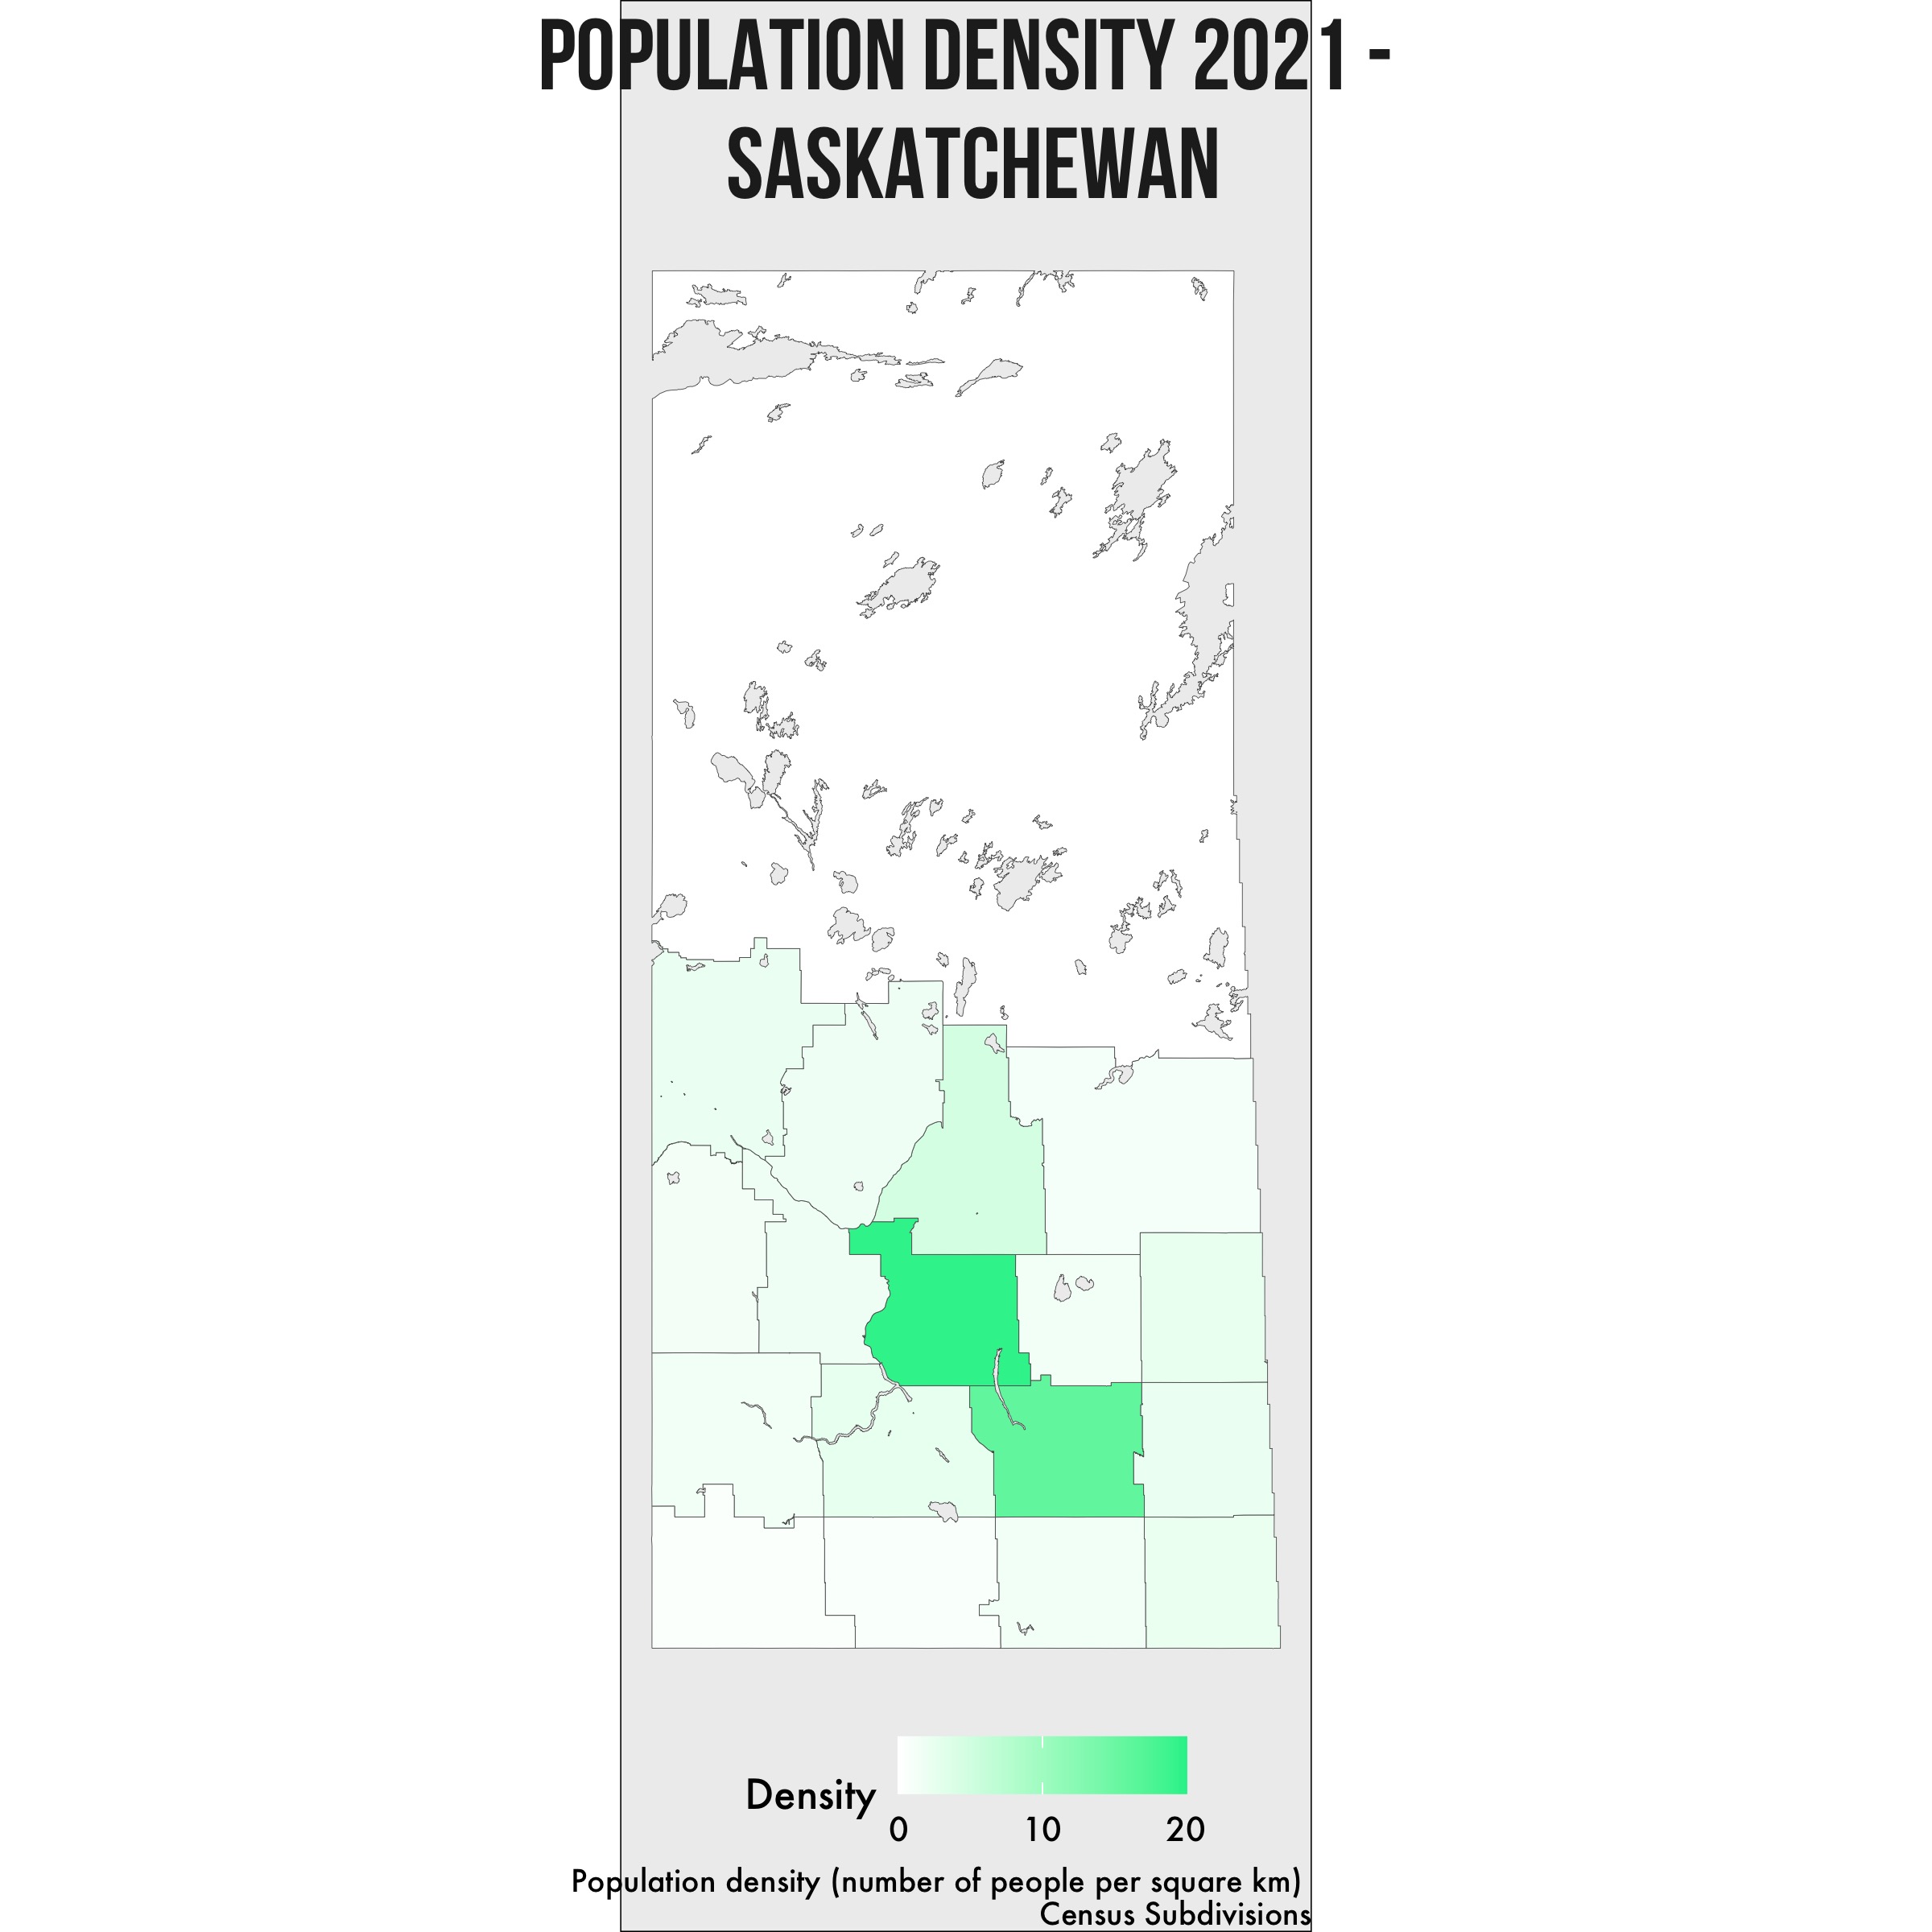
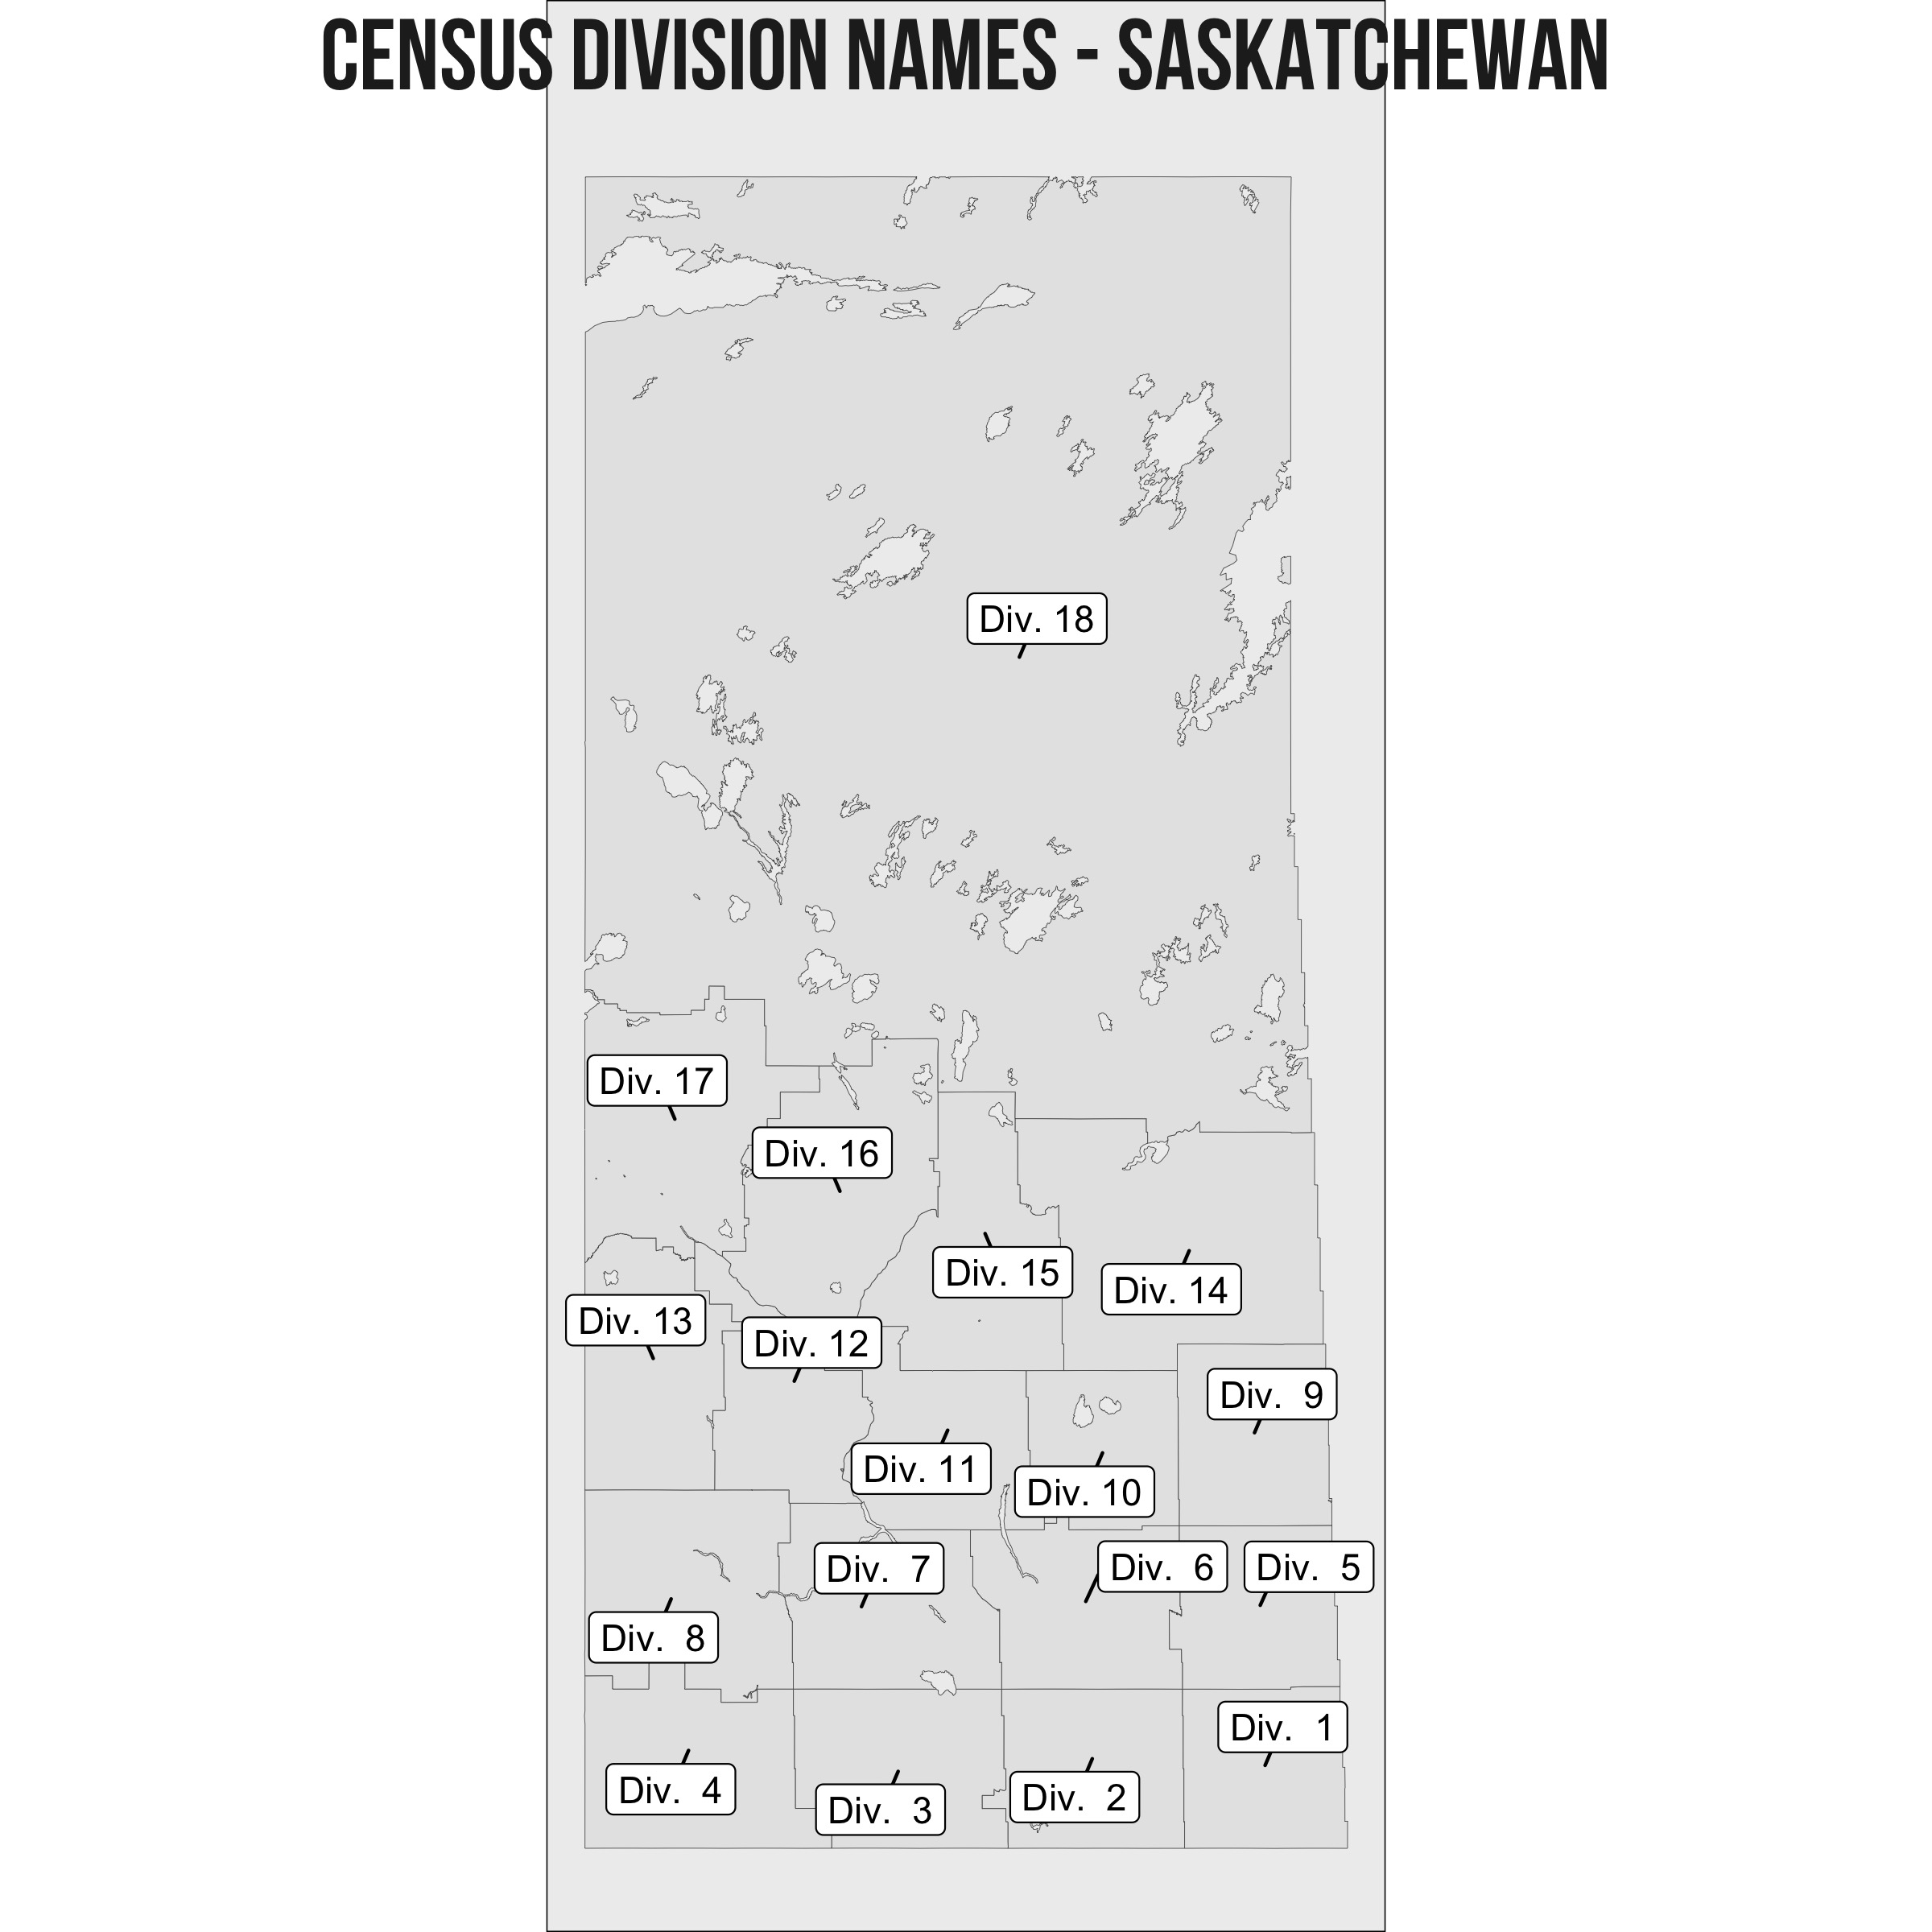
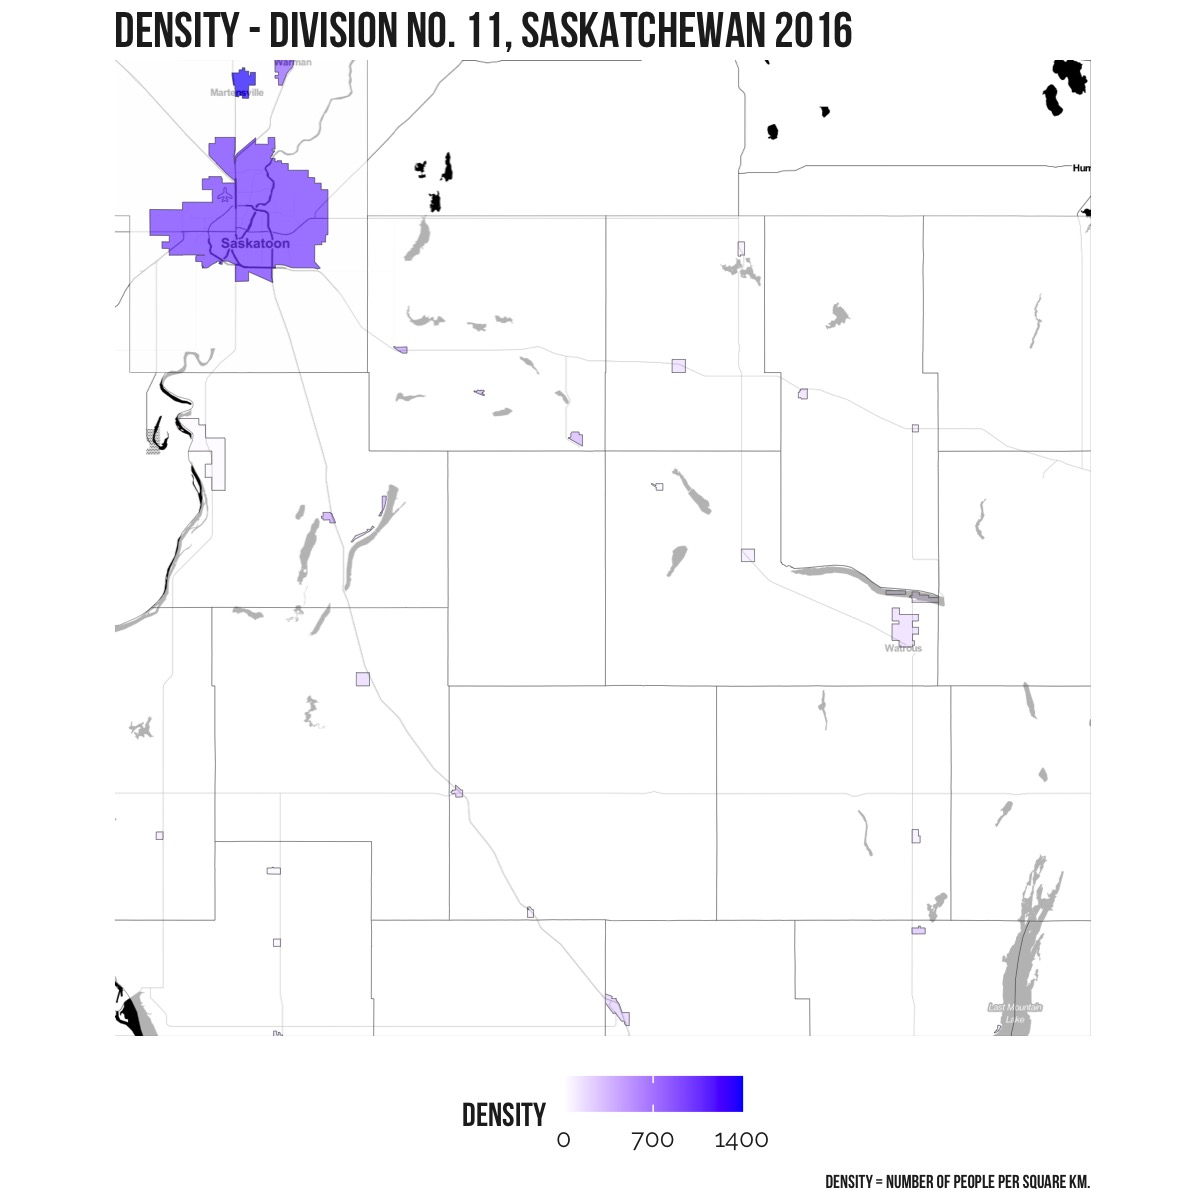
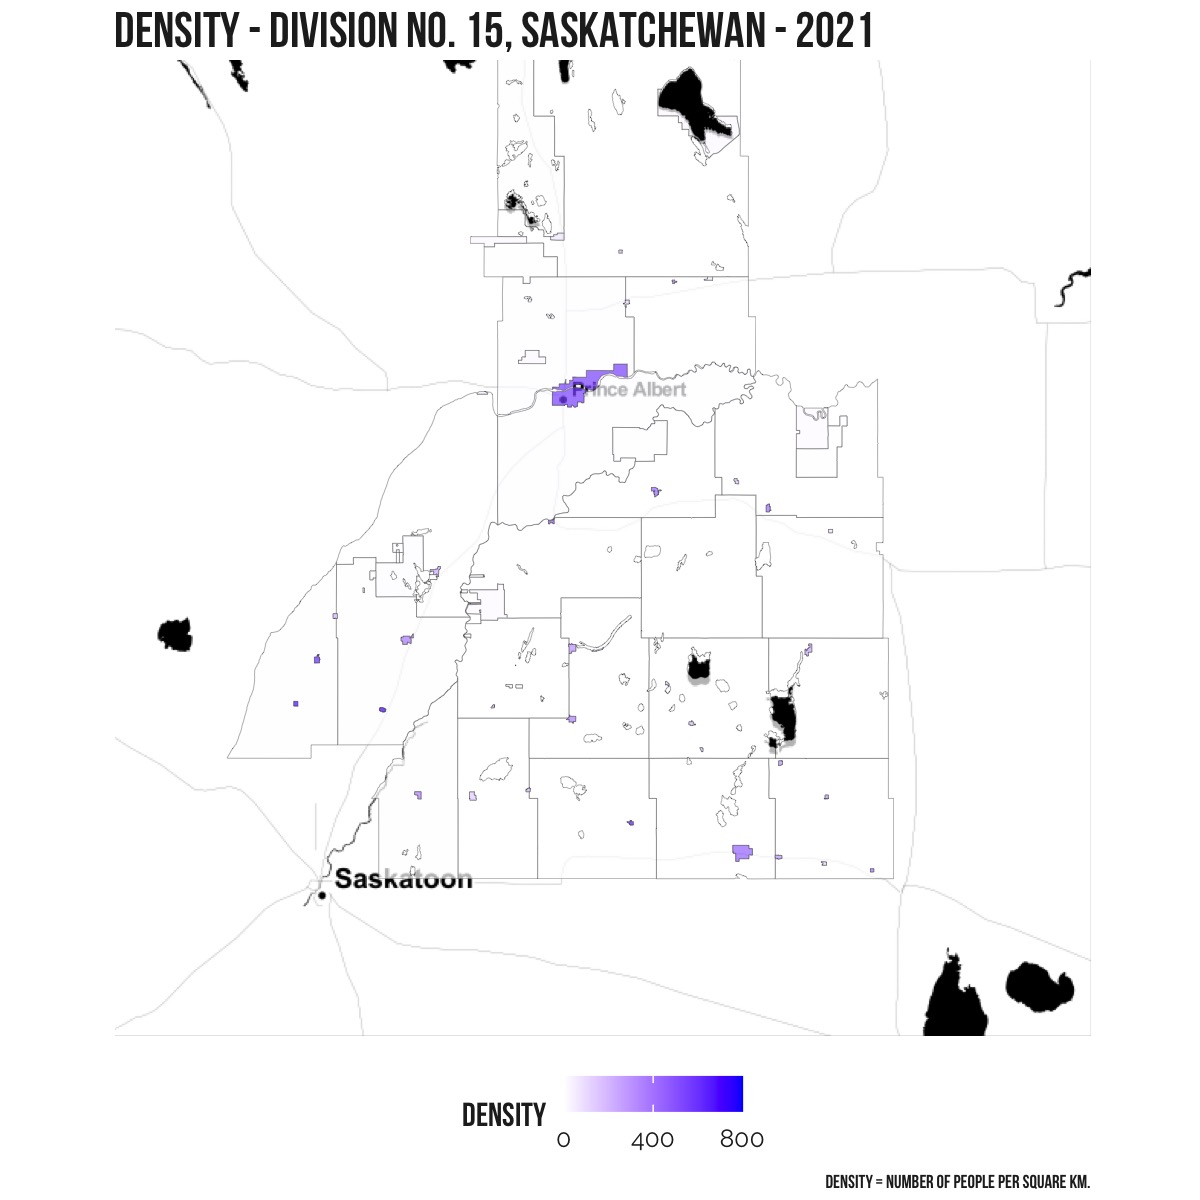
There are 18 different census division in Saskatchewan. A census division is defined by Statistics Canada as a “group of neighbouring municipalities joined together for the purposes of regional planning and managing common services”. The boundaries and population density of each of those 18 census divisions is shown on the map above.
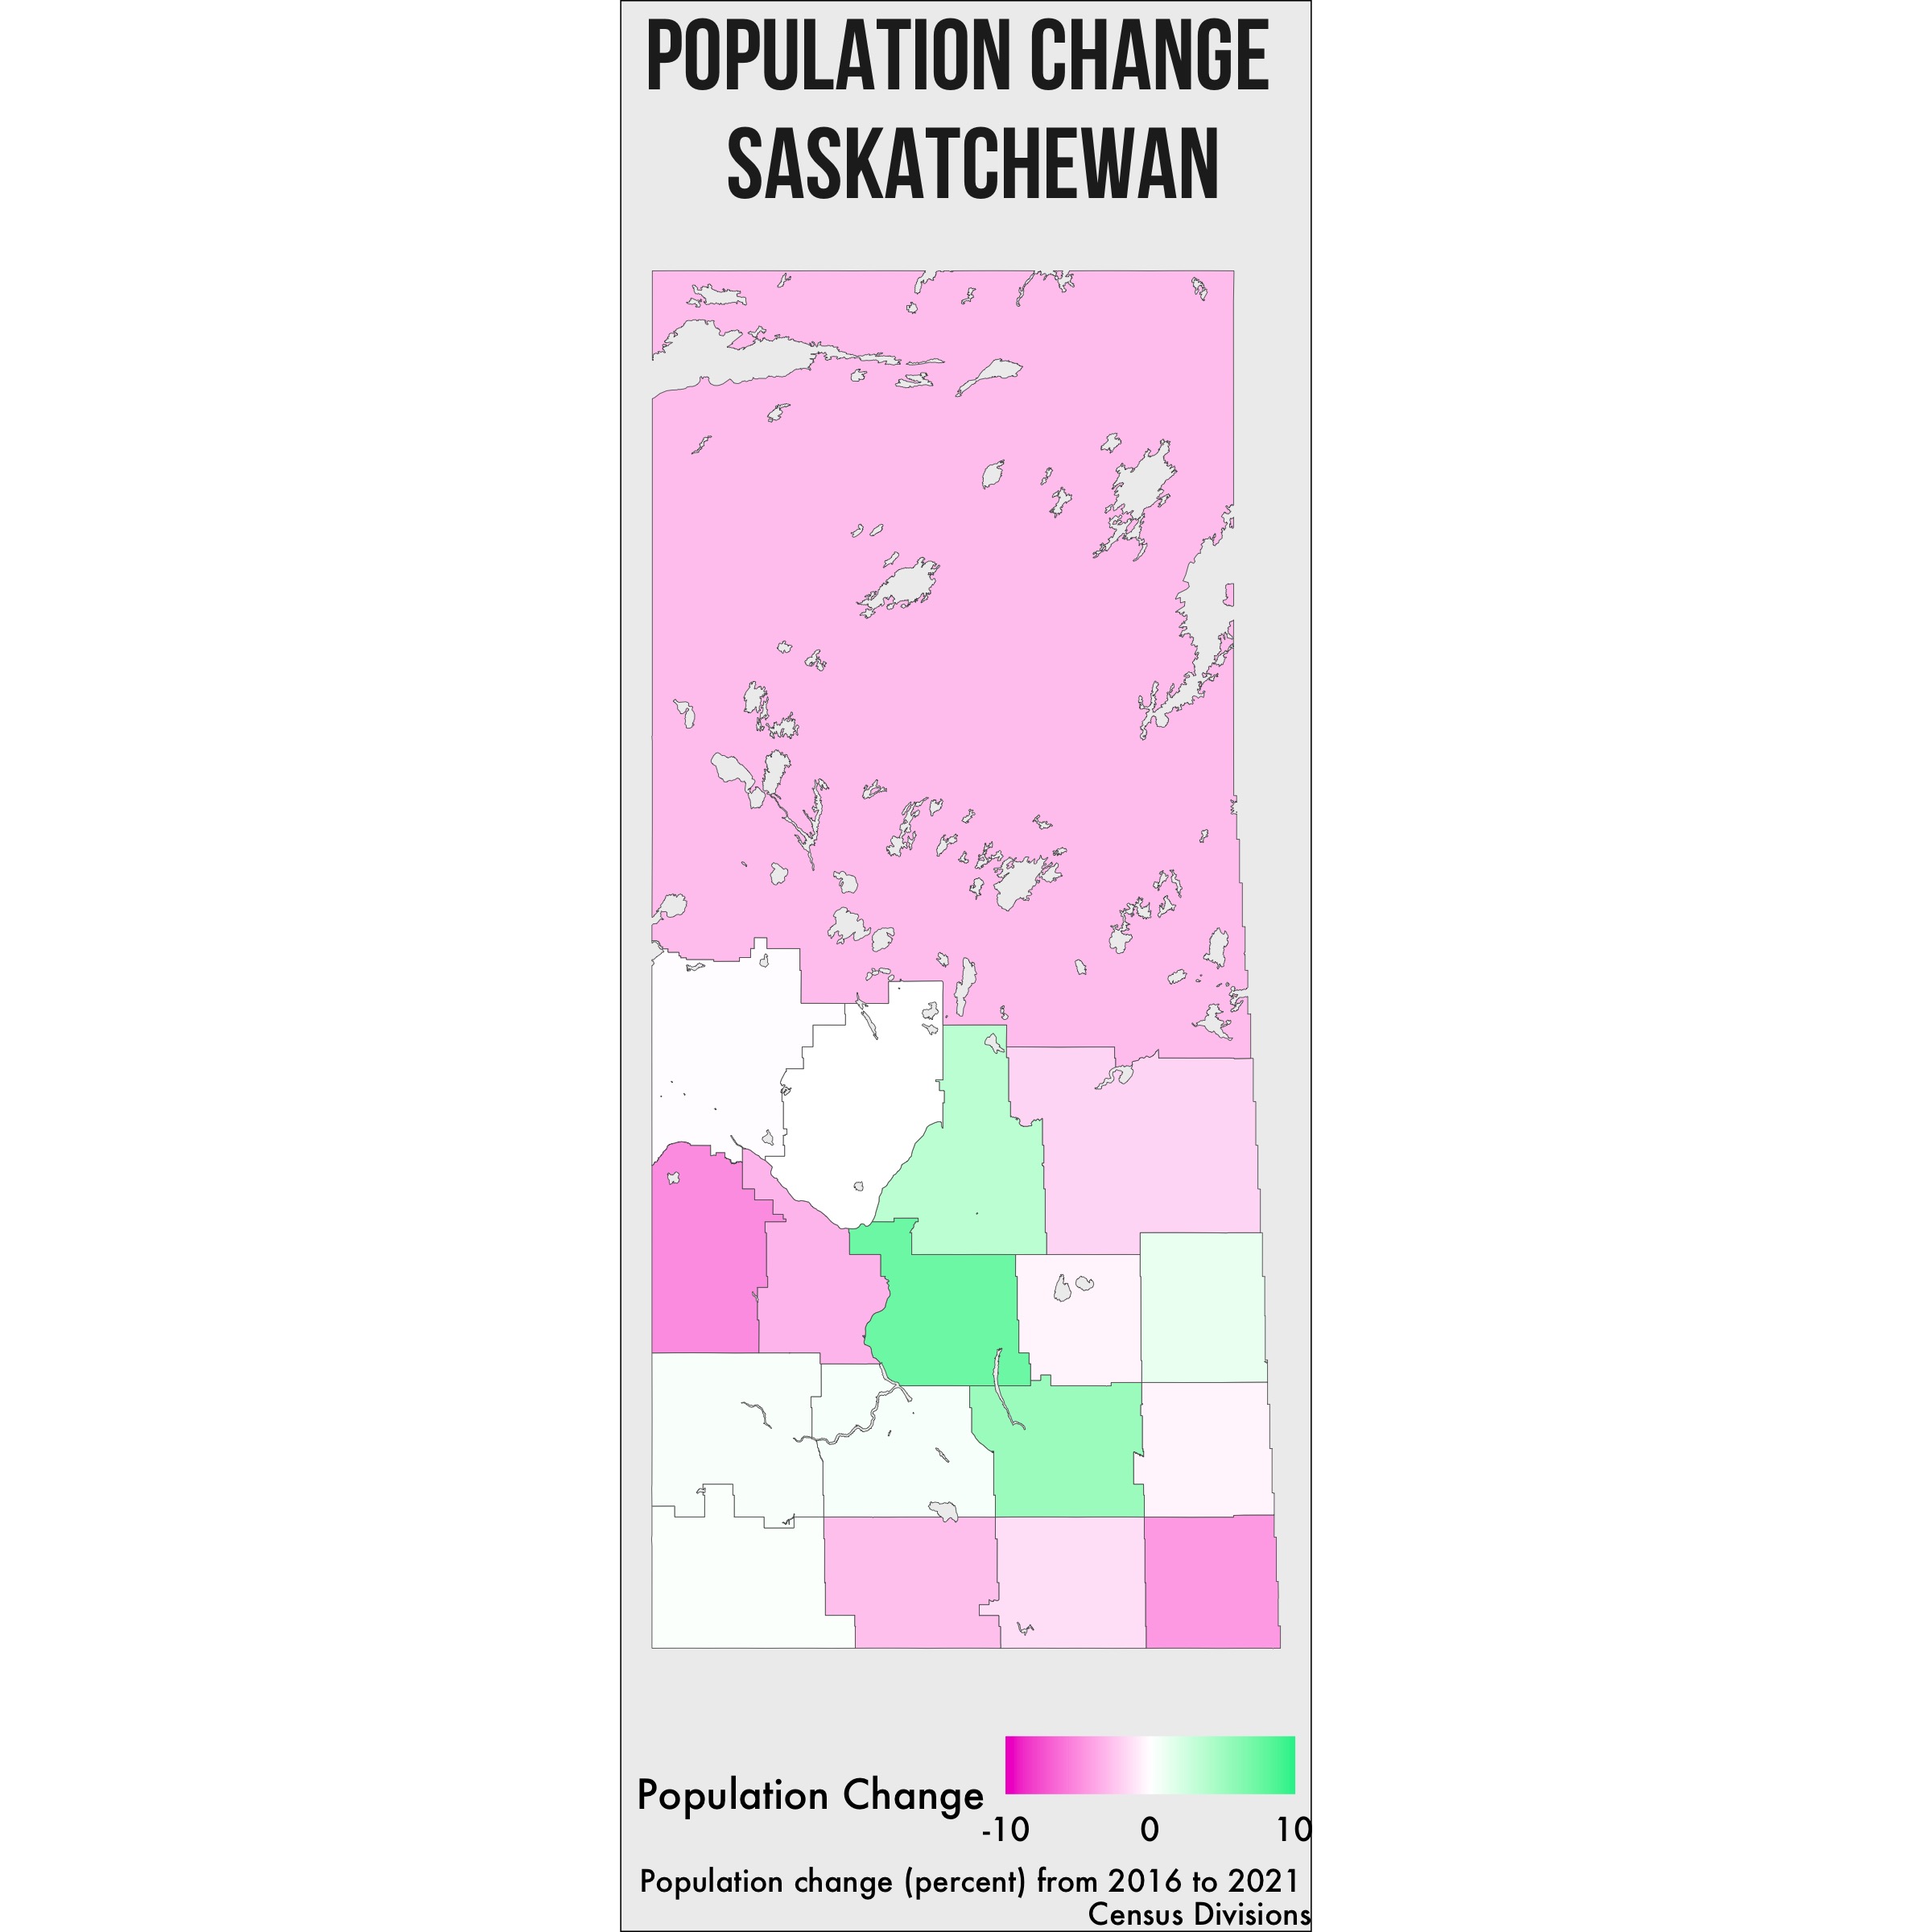
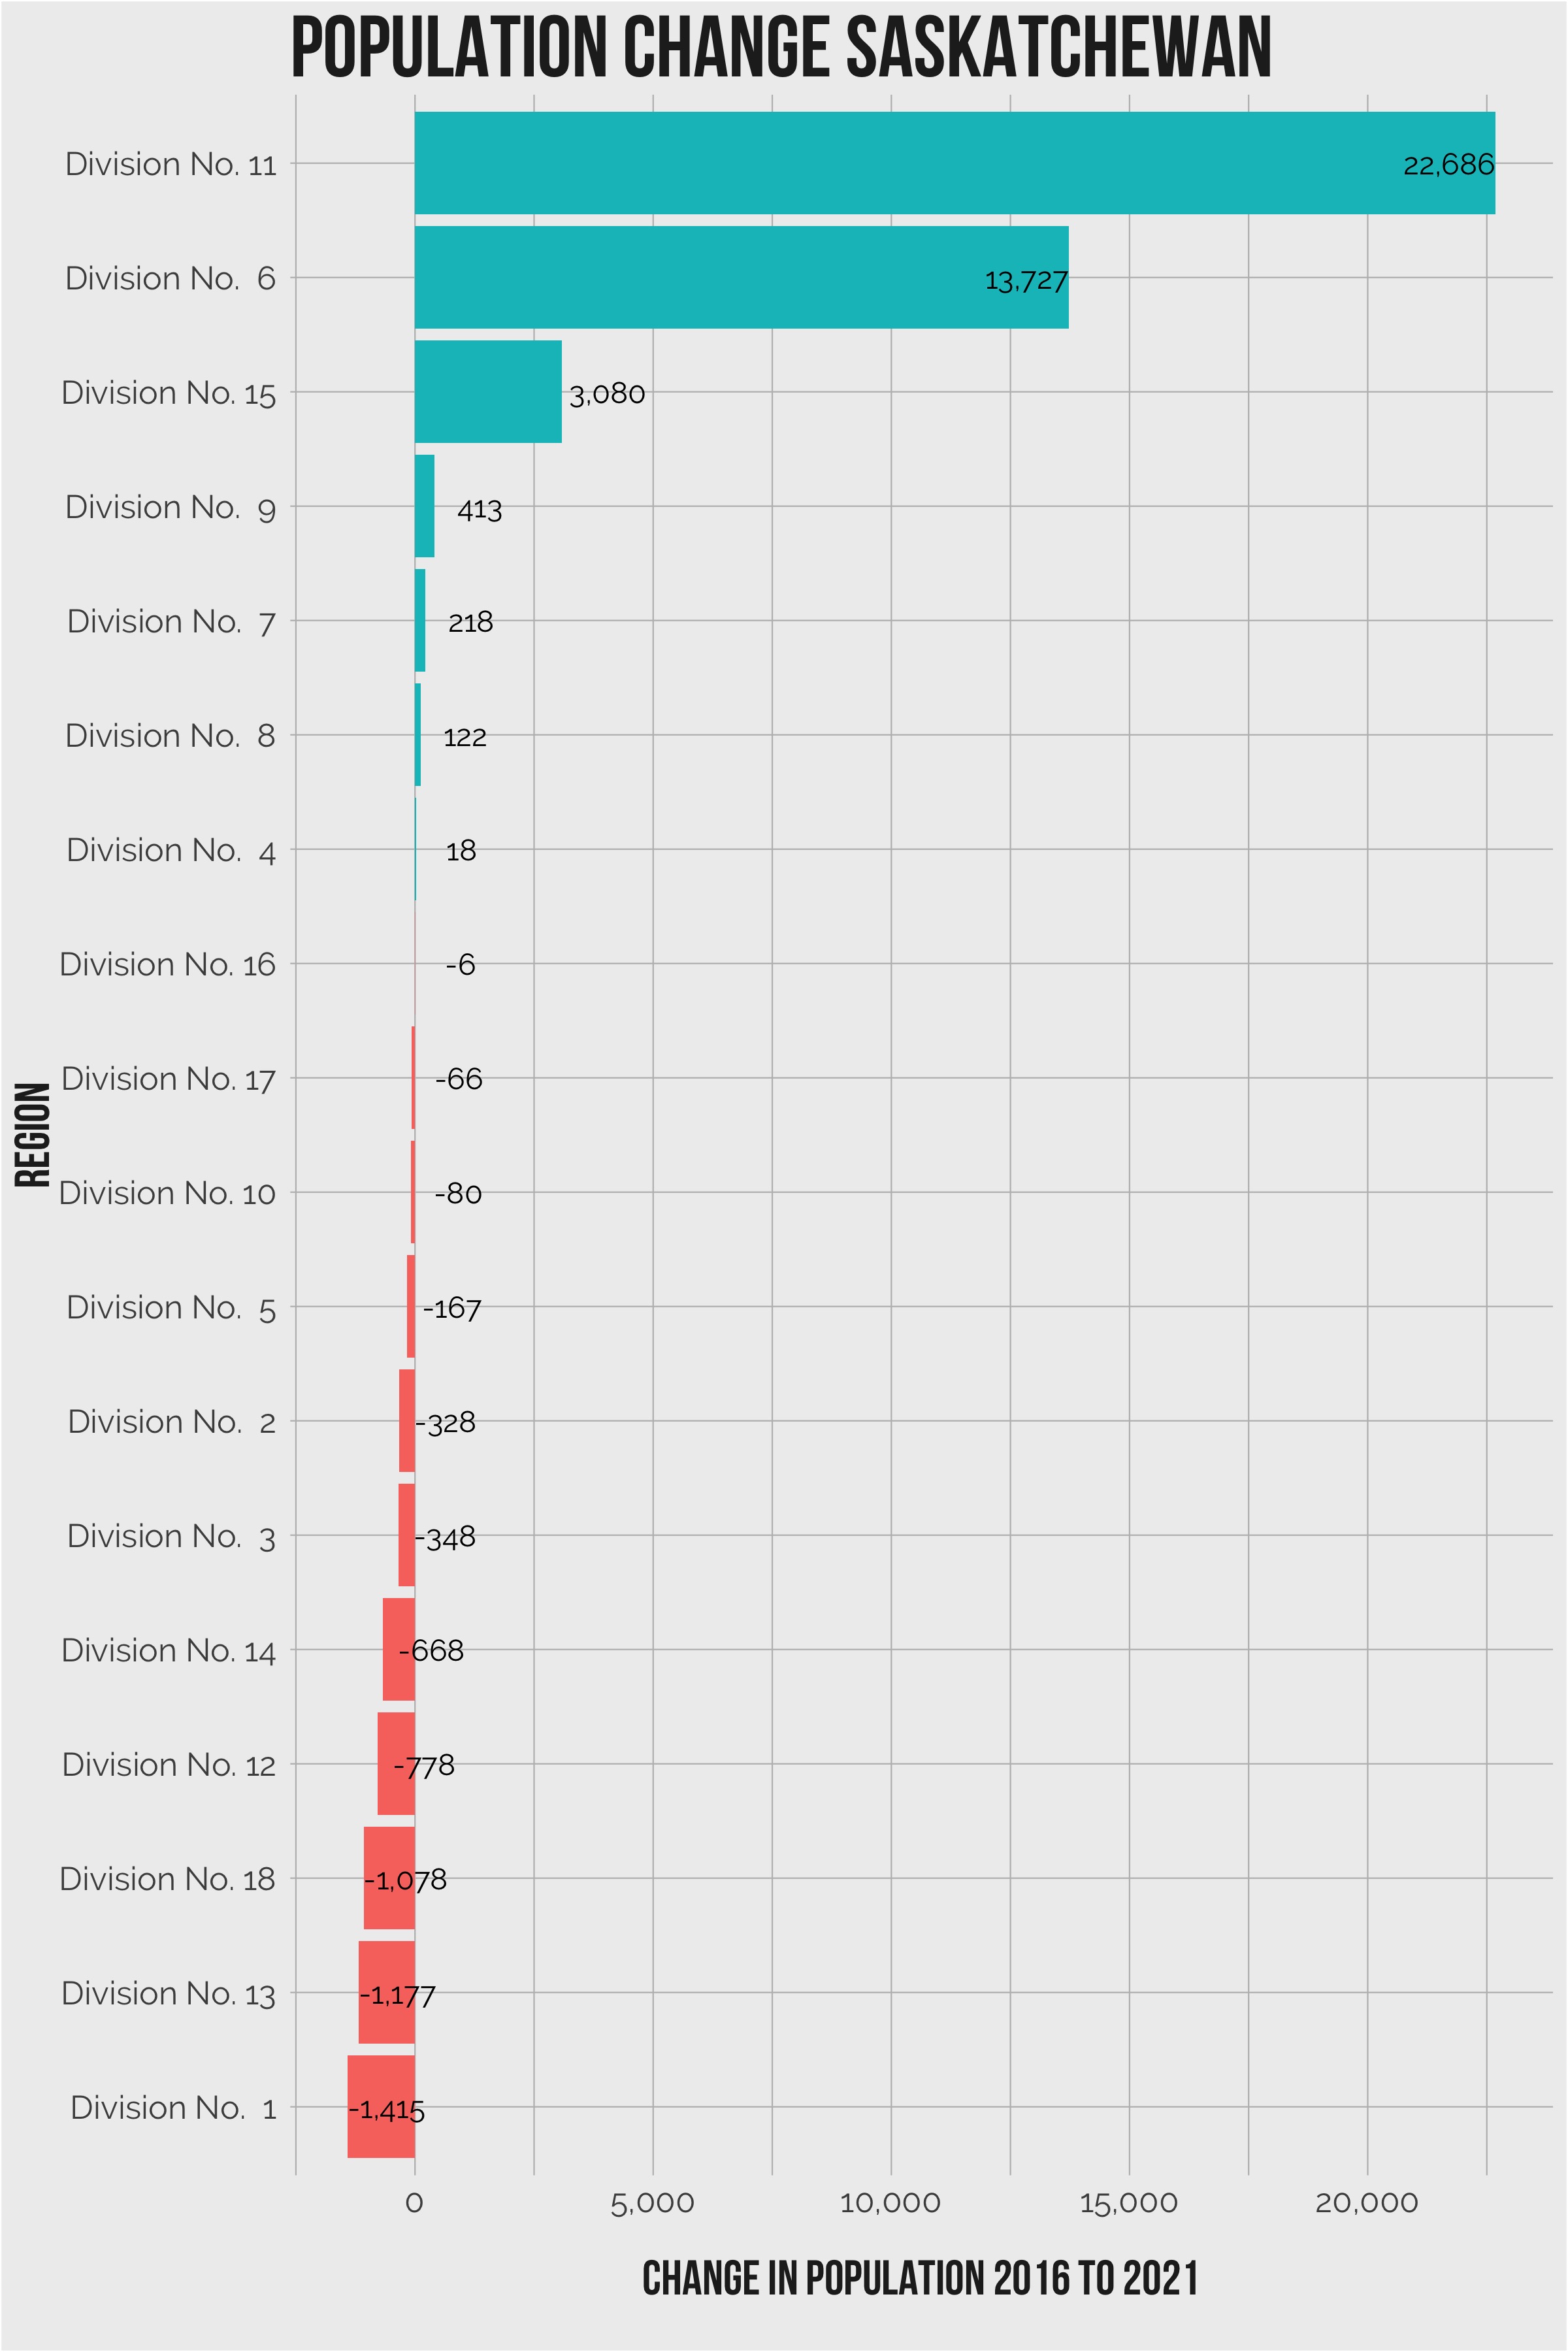
As a province, Saskatchewan’s population grew by 34,153 from 1,098,352 in 2016 to 1,132,505 in 2021. 7 of the 18 census divisions in the province saw growth.
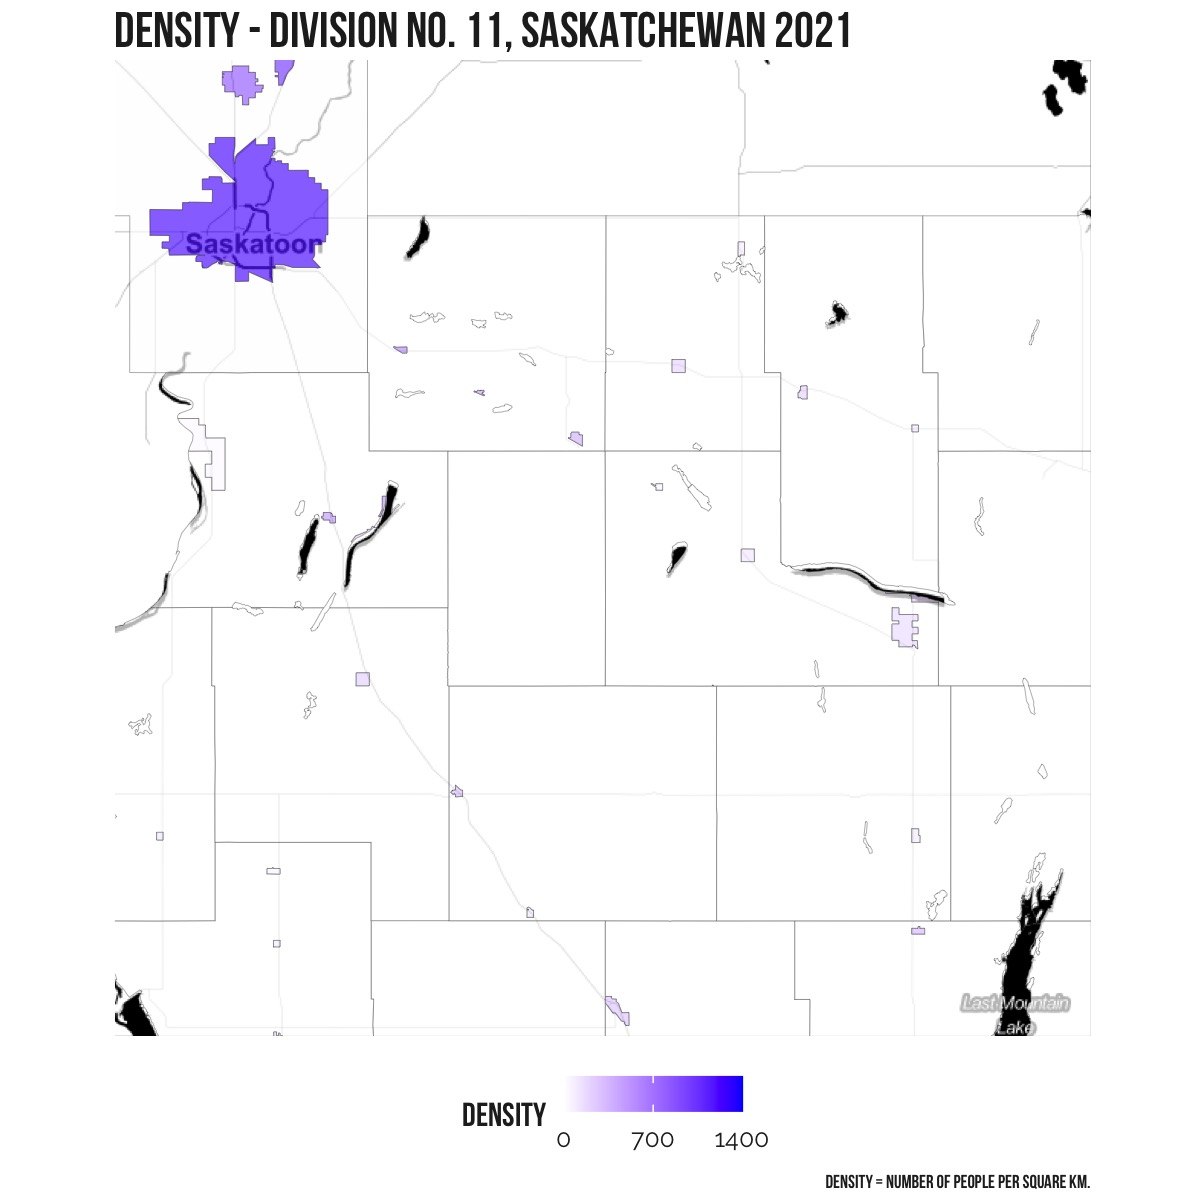
The census division of “Division No. 11” which includes Saskatoon, saw the highest percentage increase as well as actual population increase. This area grew by 22,686 residents from 303,423 in 2016 to 326,109 in 2021 (7.5%).
| Region | Population 2016 | Population 2021 | Population Difference | Population Difference Percent |
|---|---|---|---|---|
| Division No. 11 | 303,423 | 326,109 | 22,686 | 7.48 |
| Division No. 6 | 262,837 | 276,564 | 13,727 | 5.22 |
| Division No. 15 | 85,908 | 88,988 | 3,080 | 3.59 |
| Division No. 9 | 35,634 | 36,047 | 413 | 1.16 |
| Division No. 7 | 47,195 | 47,413 | 218 | 0.46 |
| Division No. 8 | 30,718 | 30,840 | 122 | 0.4 |
| Division No. 4 | 10,854 | 10,872 | 18 | 0.17 |
| Division No. 16 | 37,999 | 37,993 | -6 | -0.02 |
| Division No. 17 | 47,900 | 47,834 | -66 | -0.14 |
| Division No. 10 | 16,563 | 16,483 | -80 | -0.48 |
| Division No. 5 | 31,750 | 31,583 | -167 | -0.53 |
| Division No. 2 | 22,825 | 22,497 | -328 | -1.44 |
| Division No. 3 | 12,610 | 12,262 | -348 | -2.76 |
| Division No. 14 | 36,096 | 35,428 | -668 | -1.85 |
| Division No. 12 | 23,986 | 23,208 | -778 | -3.24 |
| Division No. 18 | 37,064 | 35,986 | -1,078 | -2.91 |
| Division No. 13 | 23,224 | 22,047 | -1,177 | -5.07 |
| Division No. 1 | 31,766 | 30,351 | -1,415 | -4.45 |
Which areas have seen high growth?
Of the 18 census divisions in Saskatchewan, 7 saw population increases between 2016 and 2021.
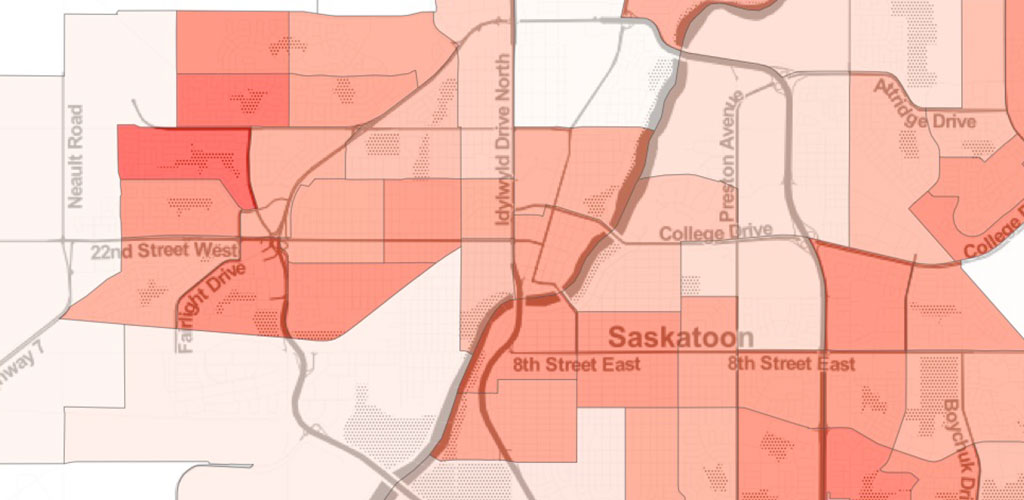
The next level down to consider is the census subdivision, which Statistics Canada defines as “the general term for municipalities”.
High growth area #1
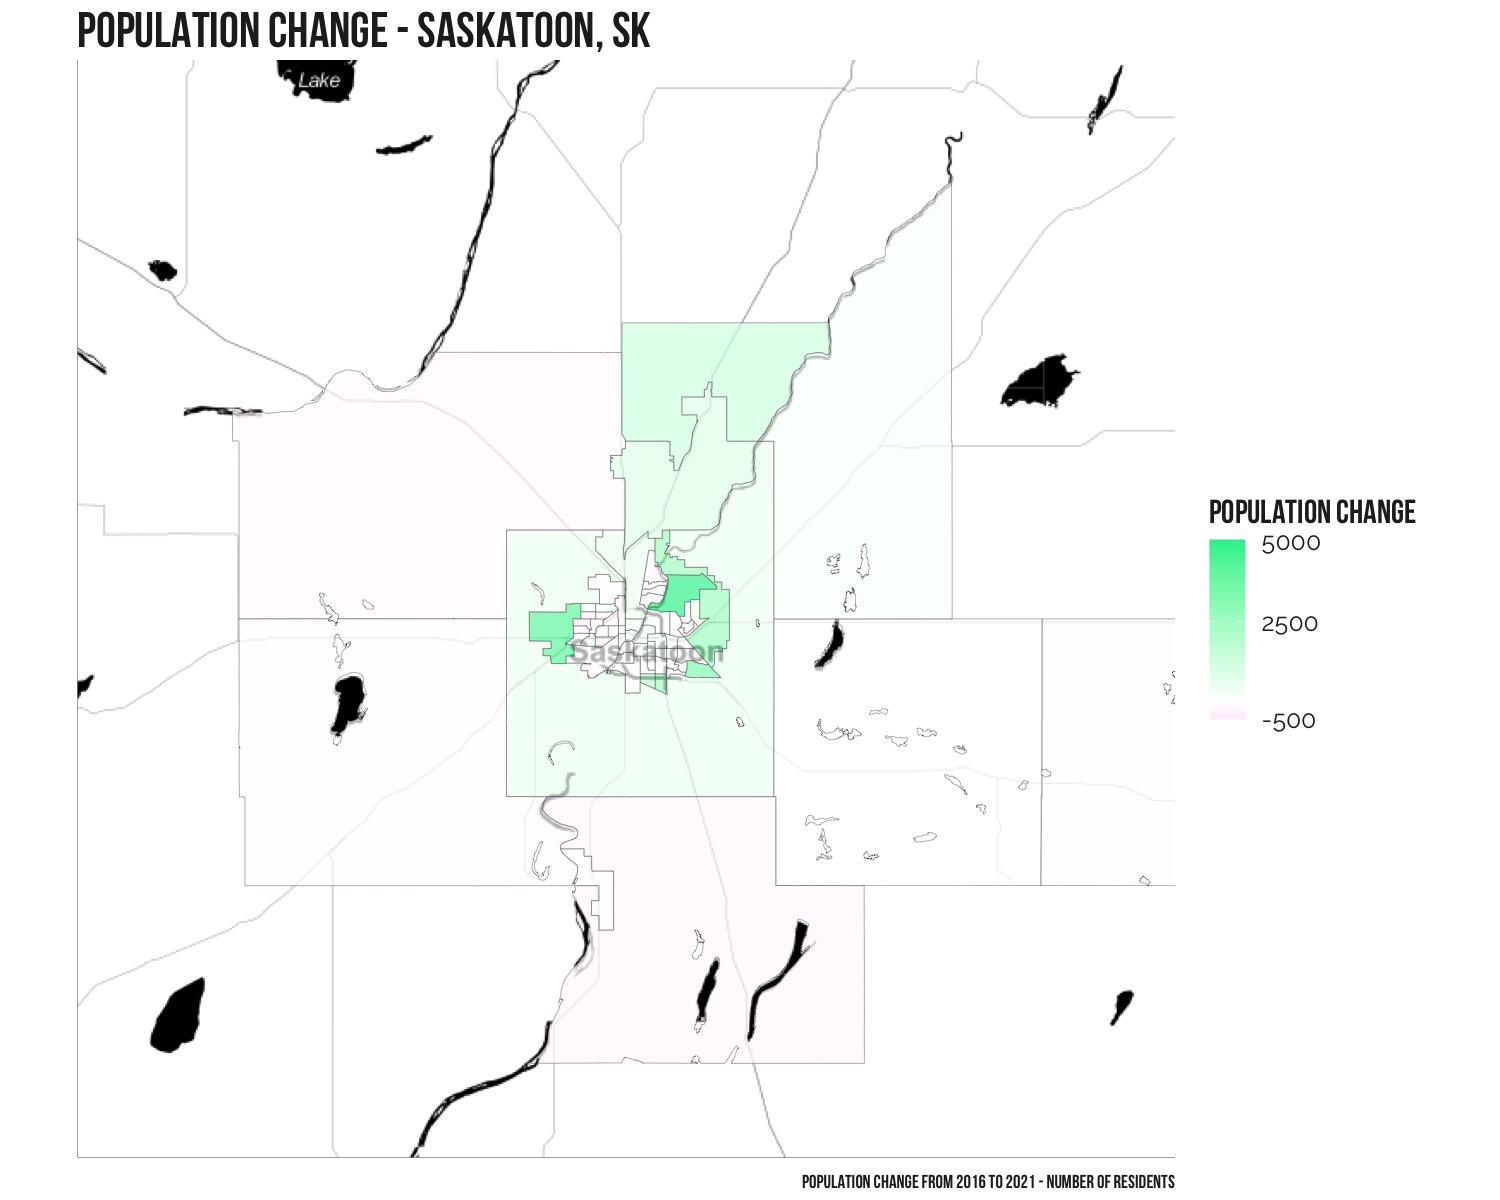
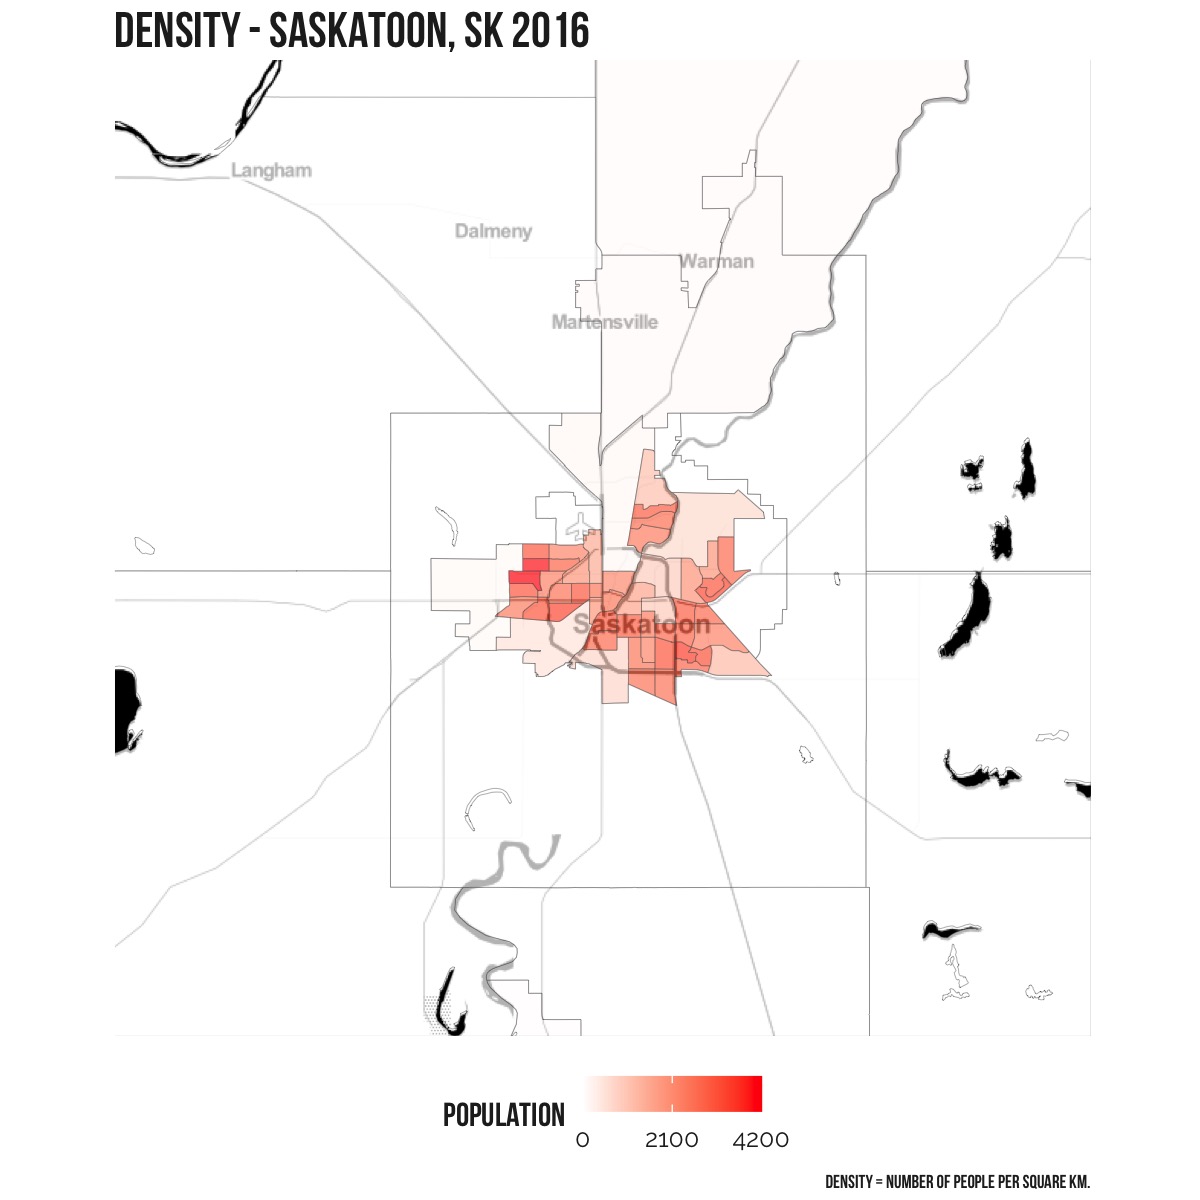
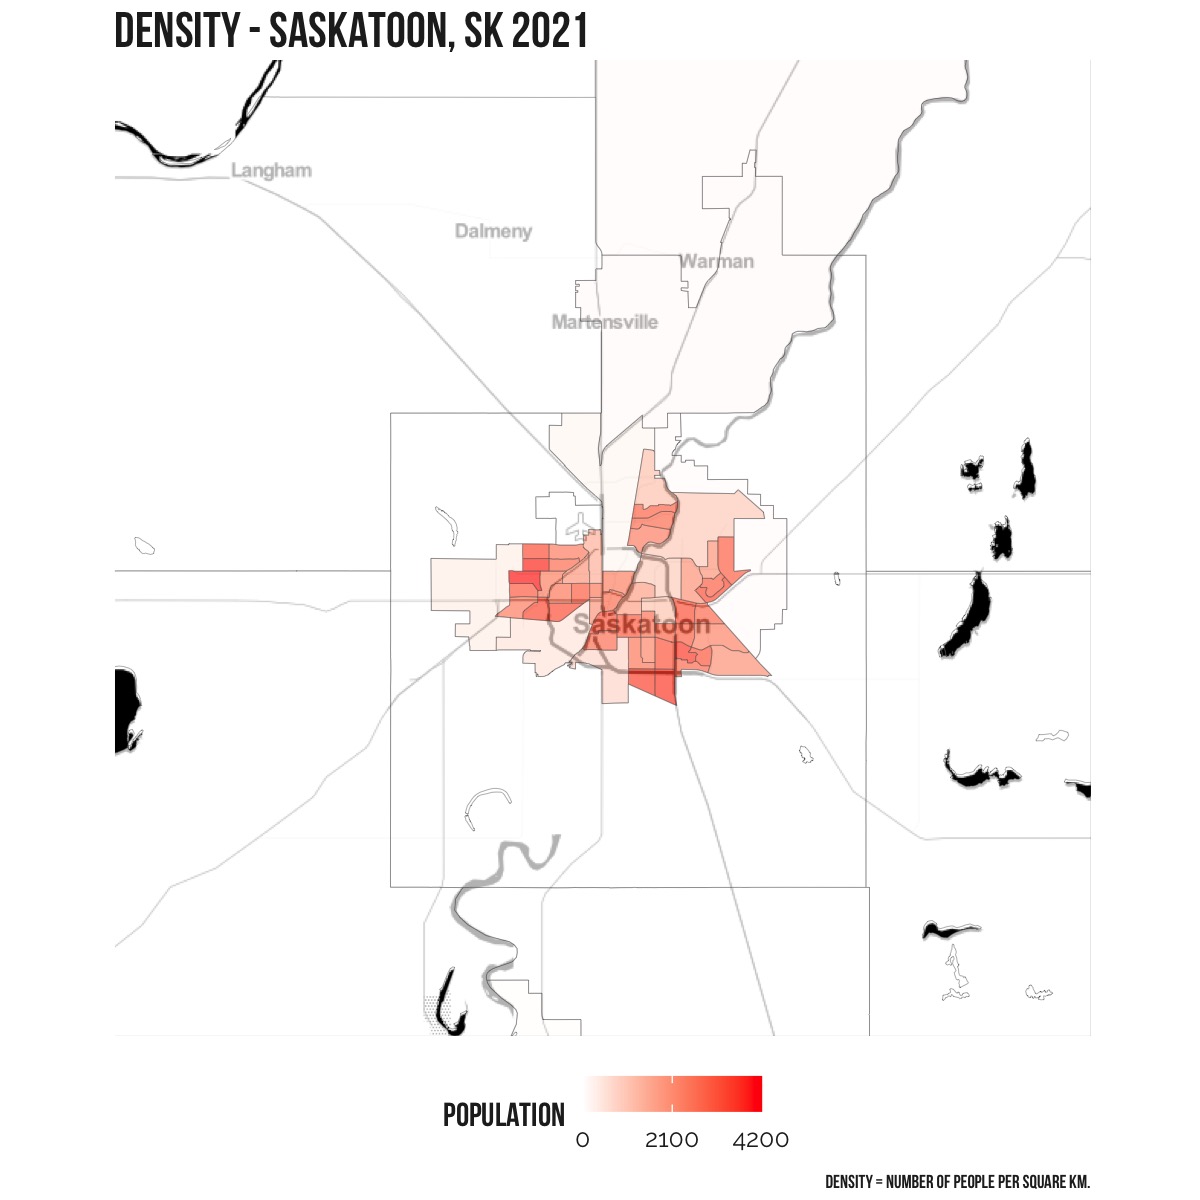
Division No. 11, which includes Saskatoon, saw the largest increase in population of 22,686 residents from 303,423 in 2016 to 326,109 in 2021 (7.5%).

High growth area #2
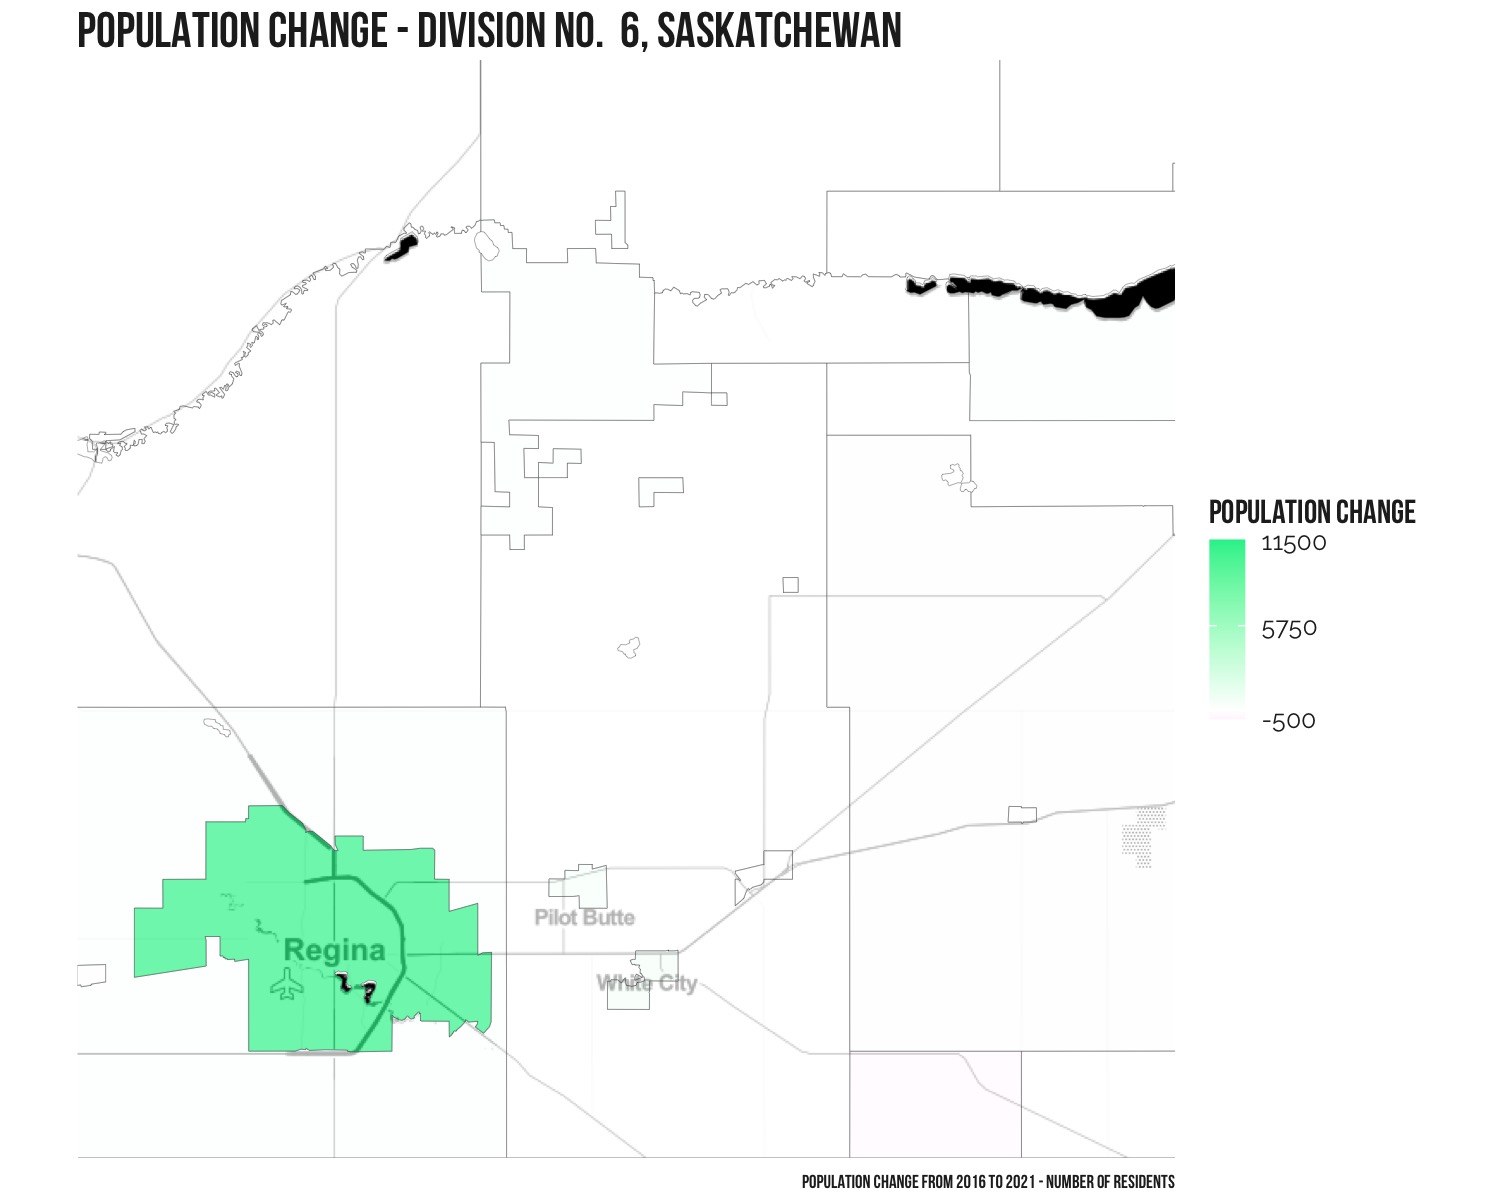
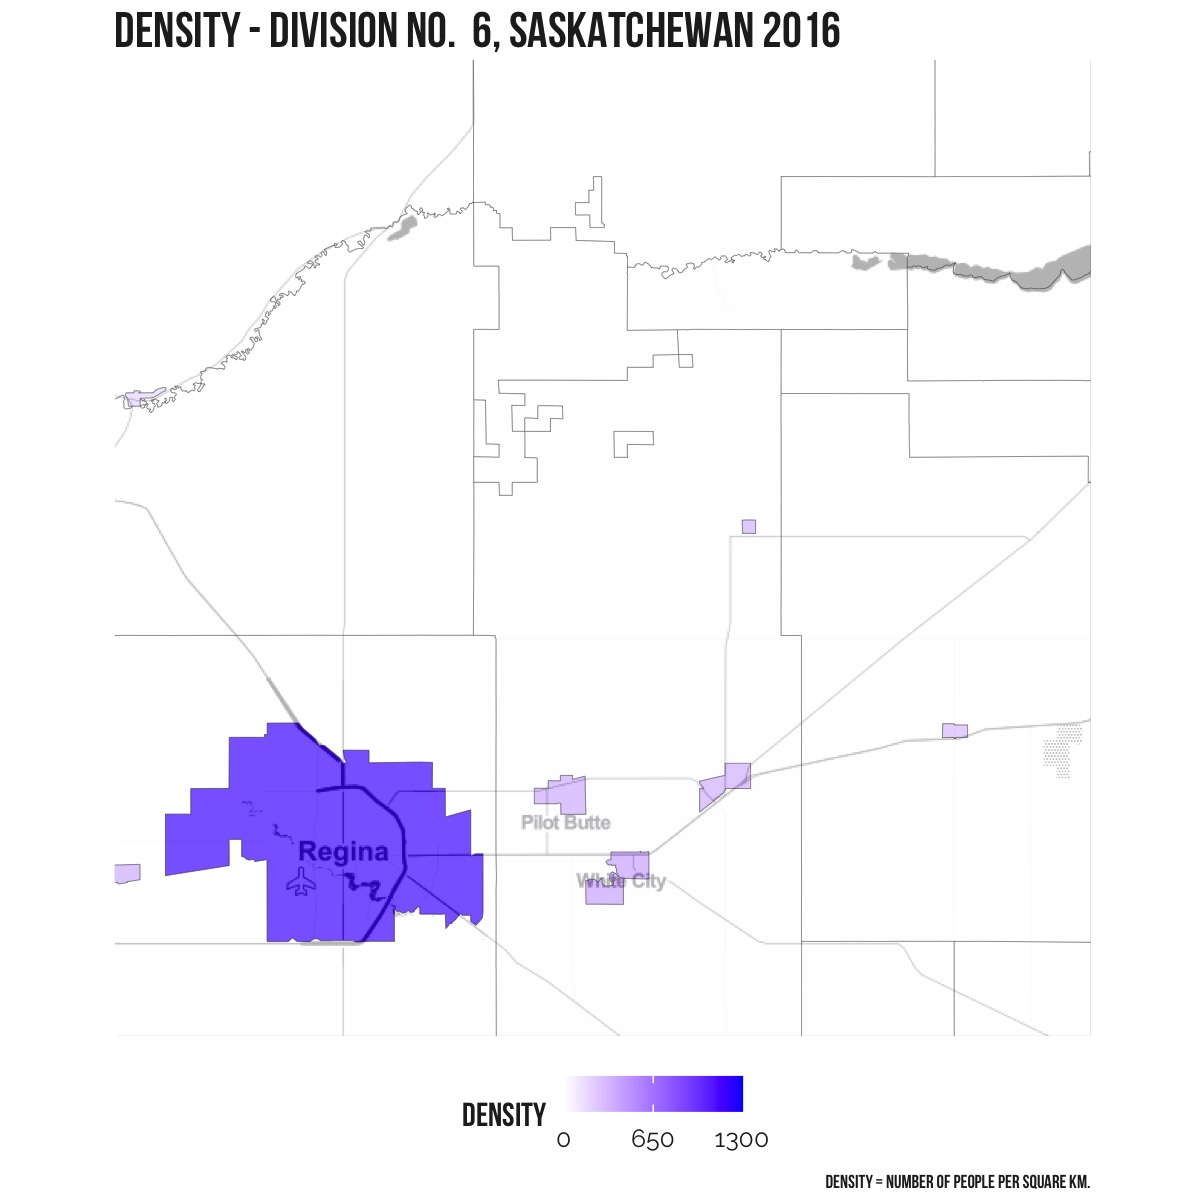
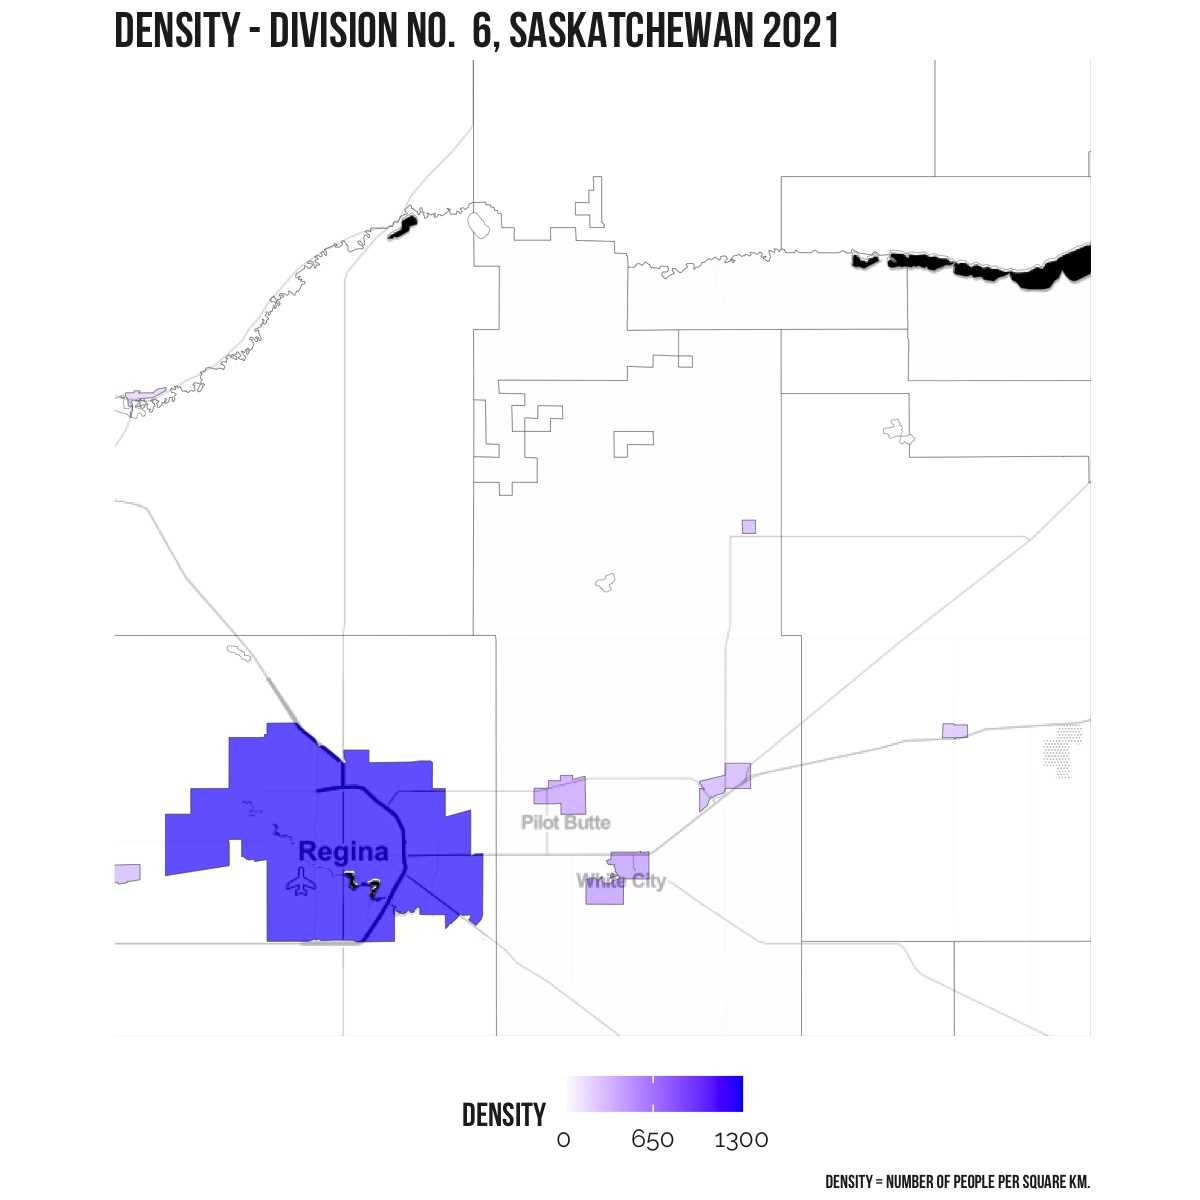
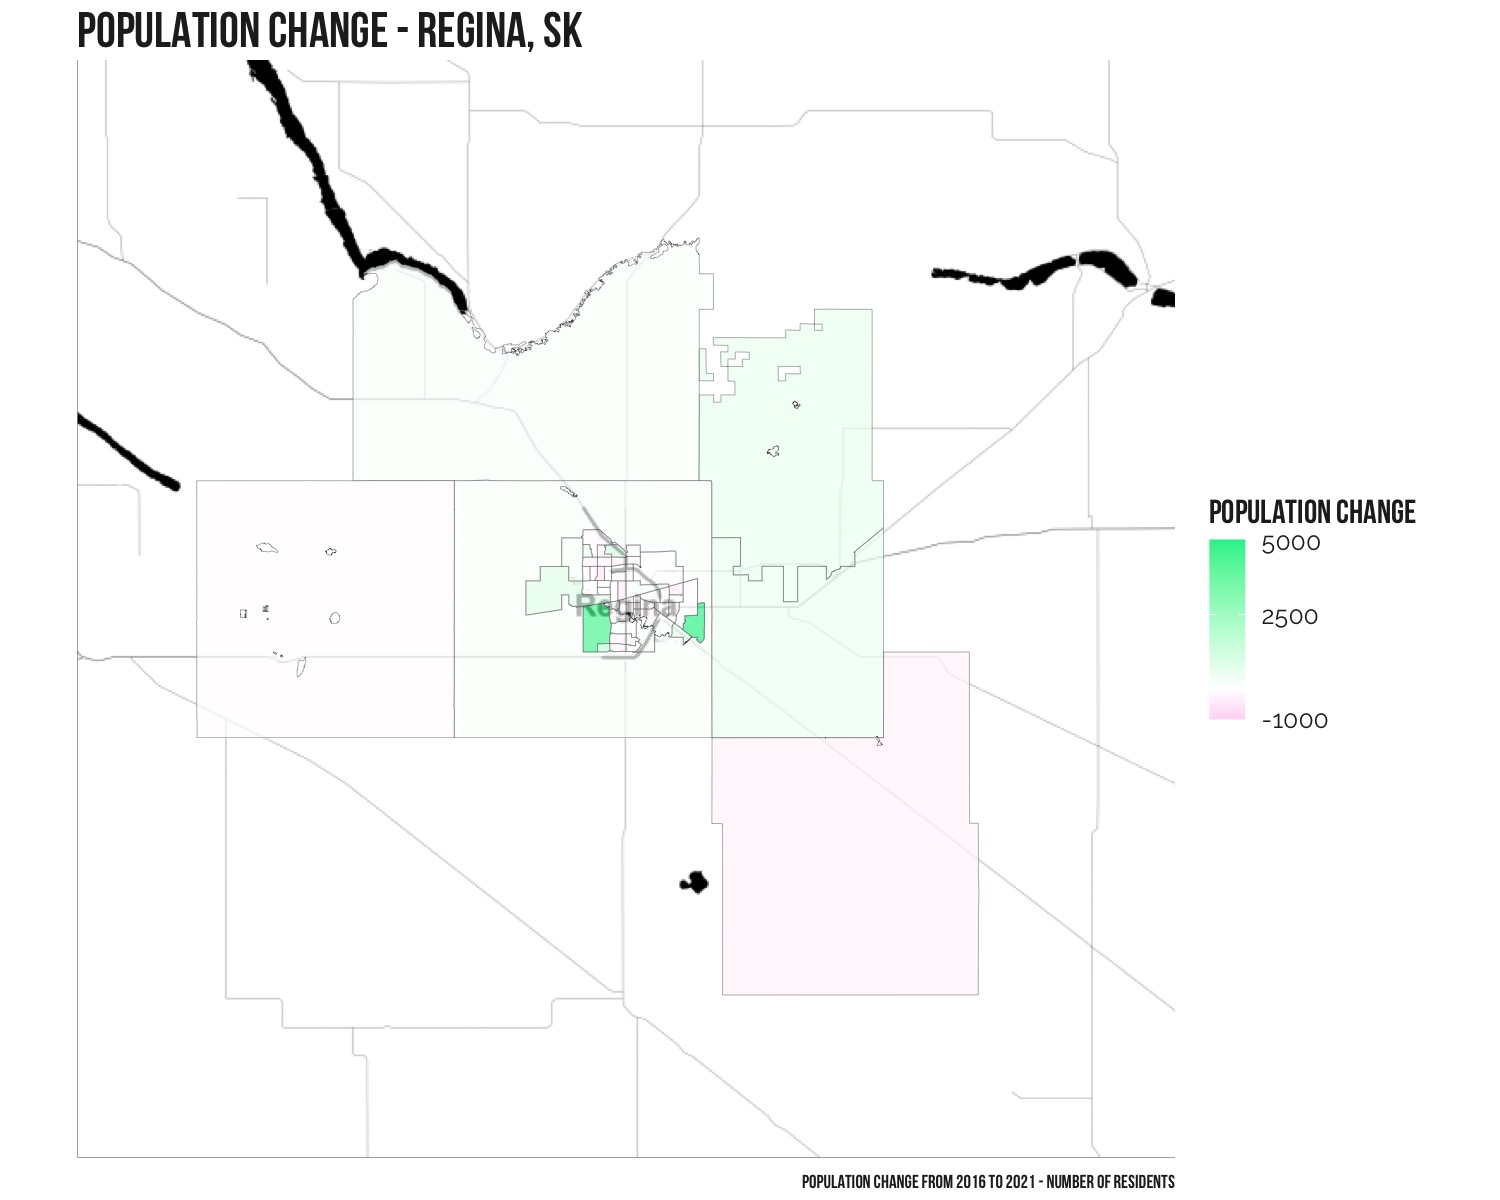
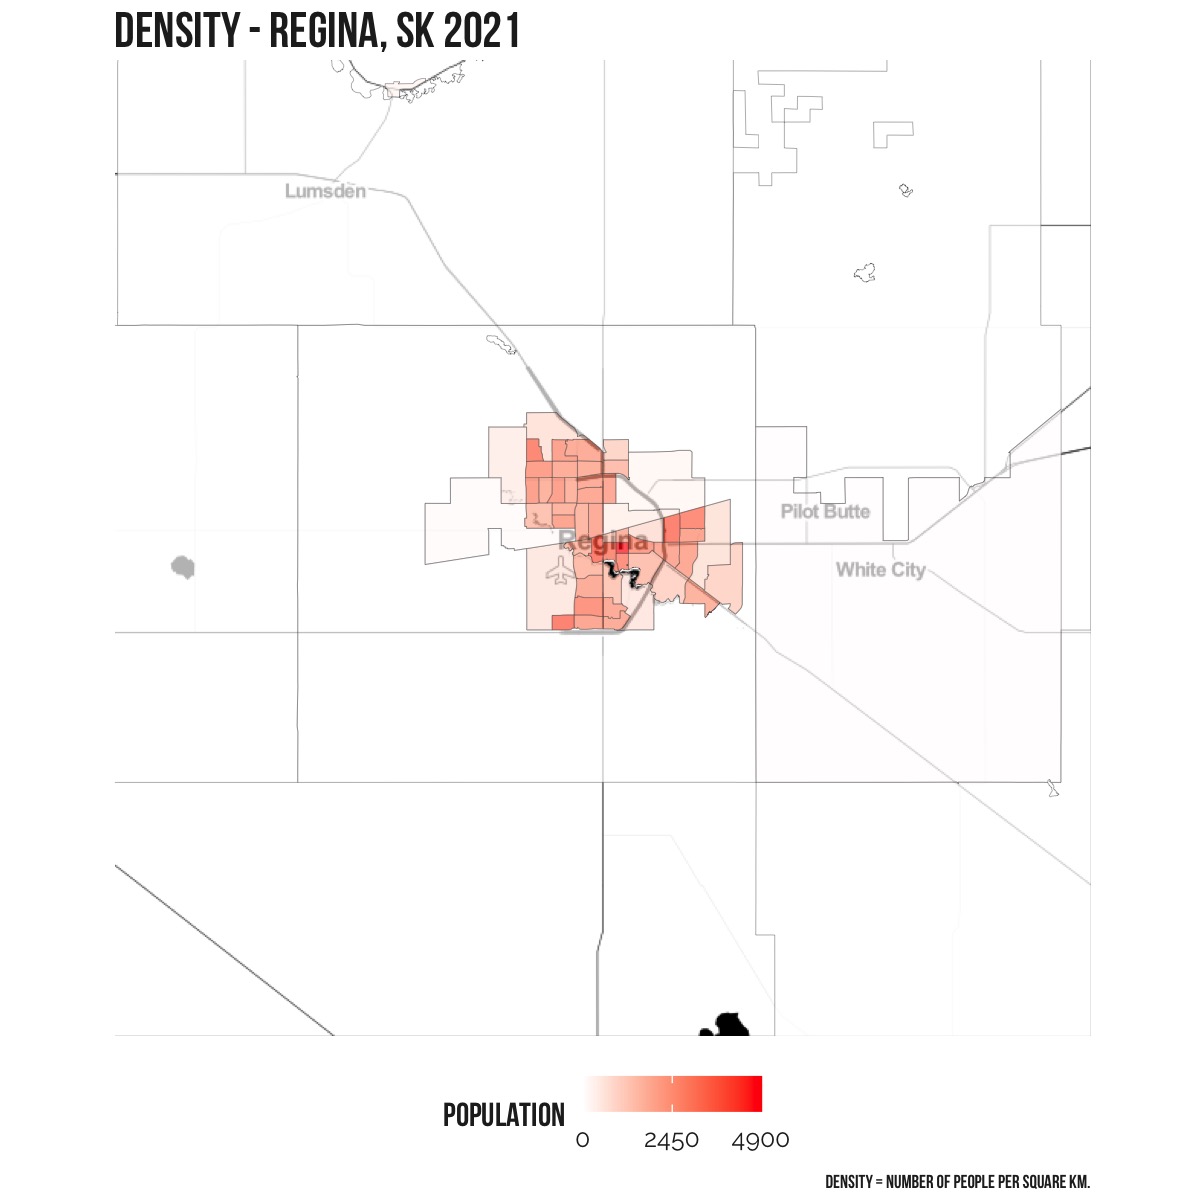
Division No. 6, which includes Regina, saw the second largest increase in population of 13,727 residents from 262,837 in 2016 to 276,564 in 2021 (5.2%).
High growth area #3
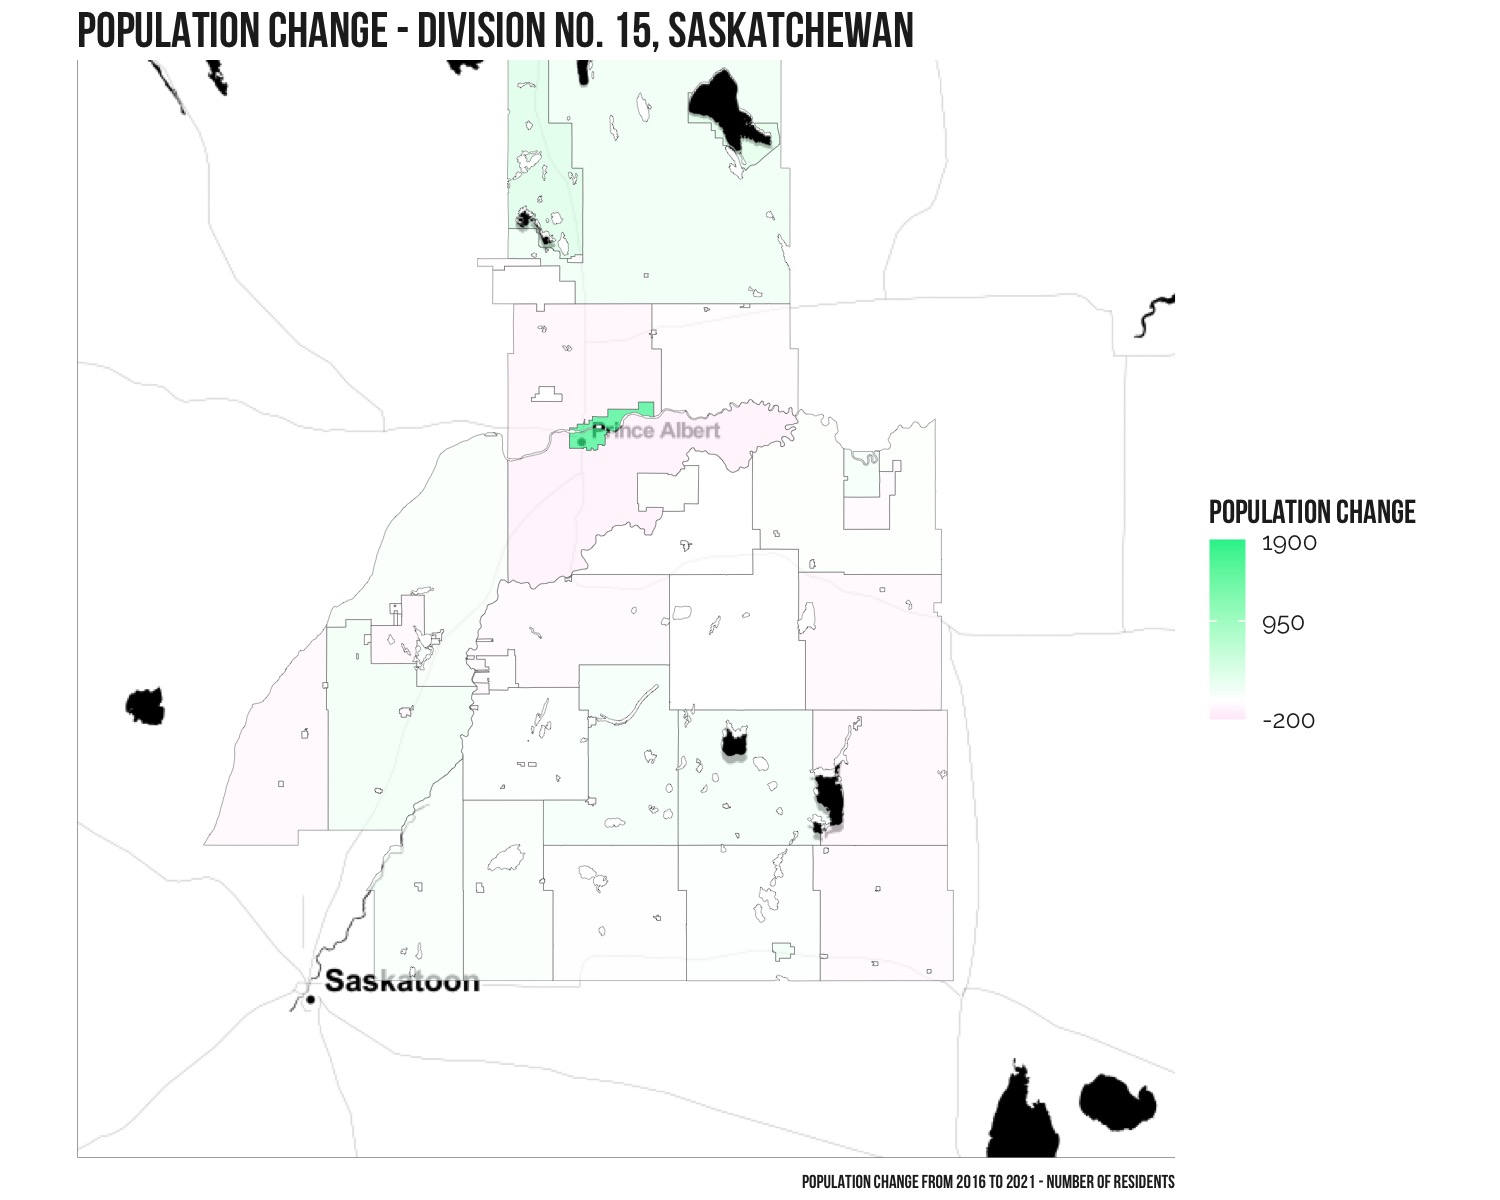
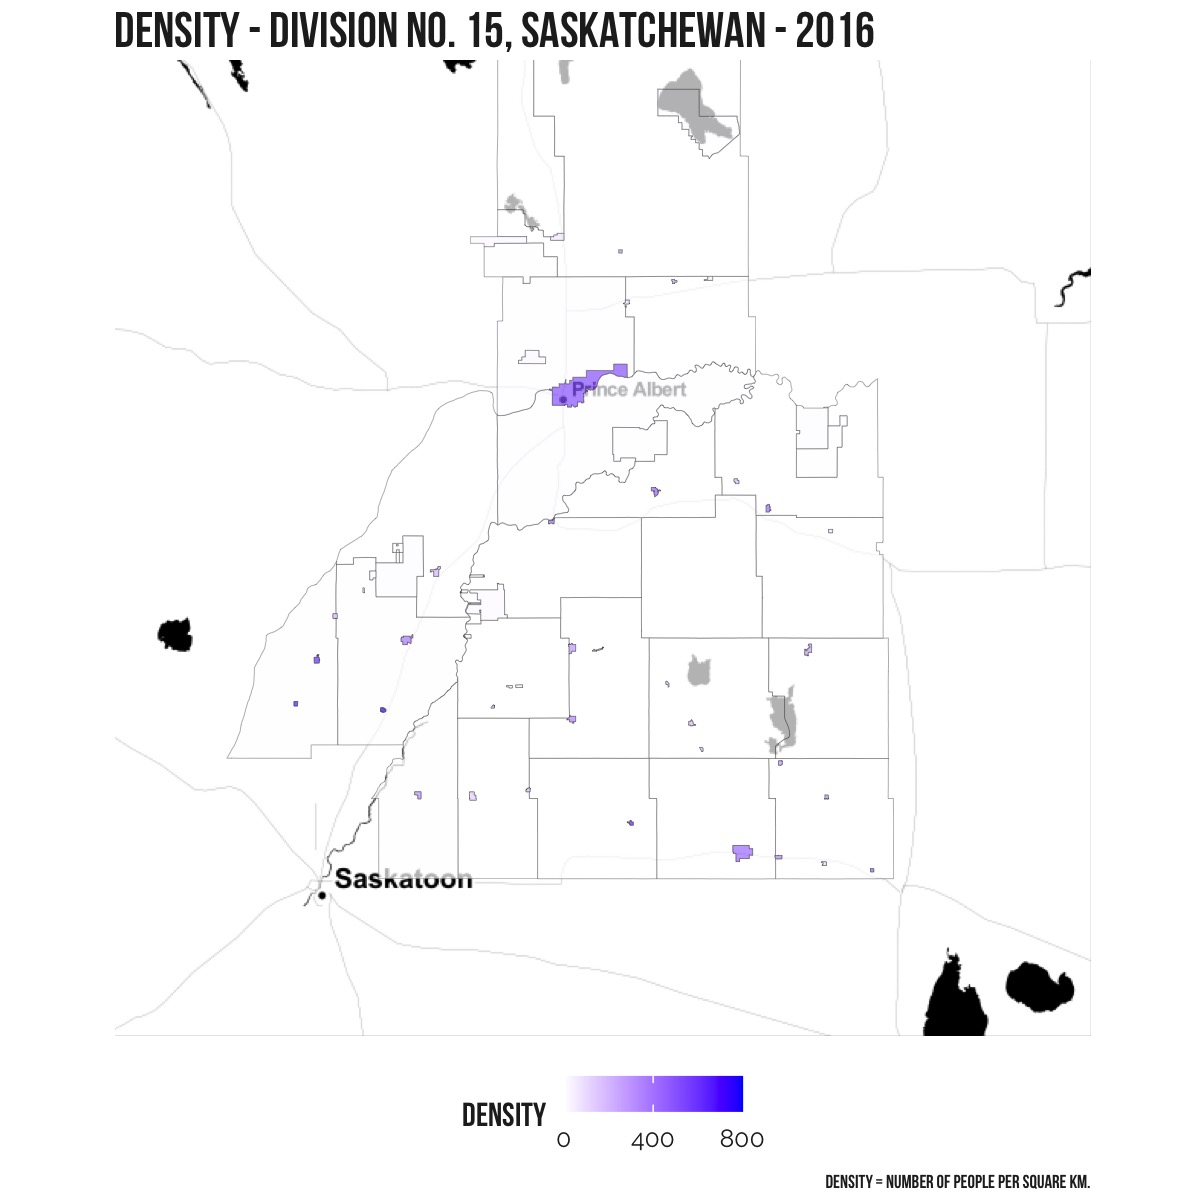
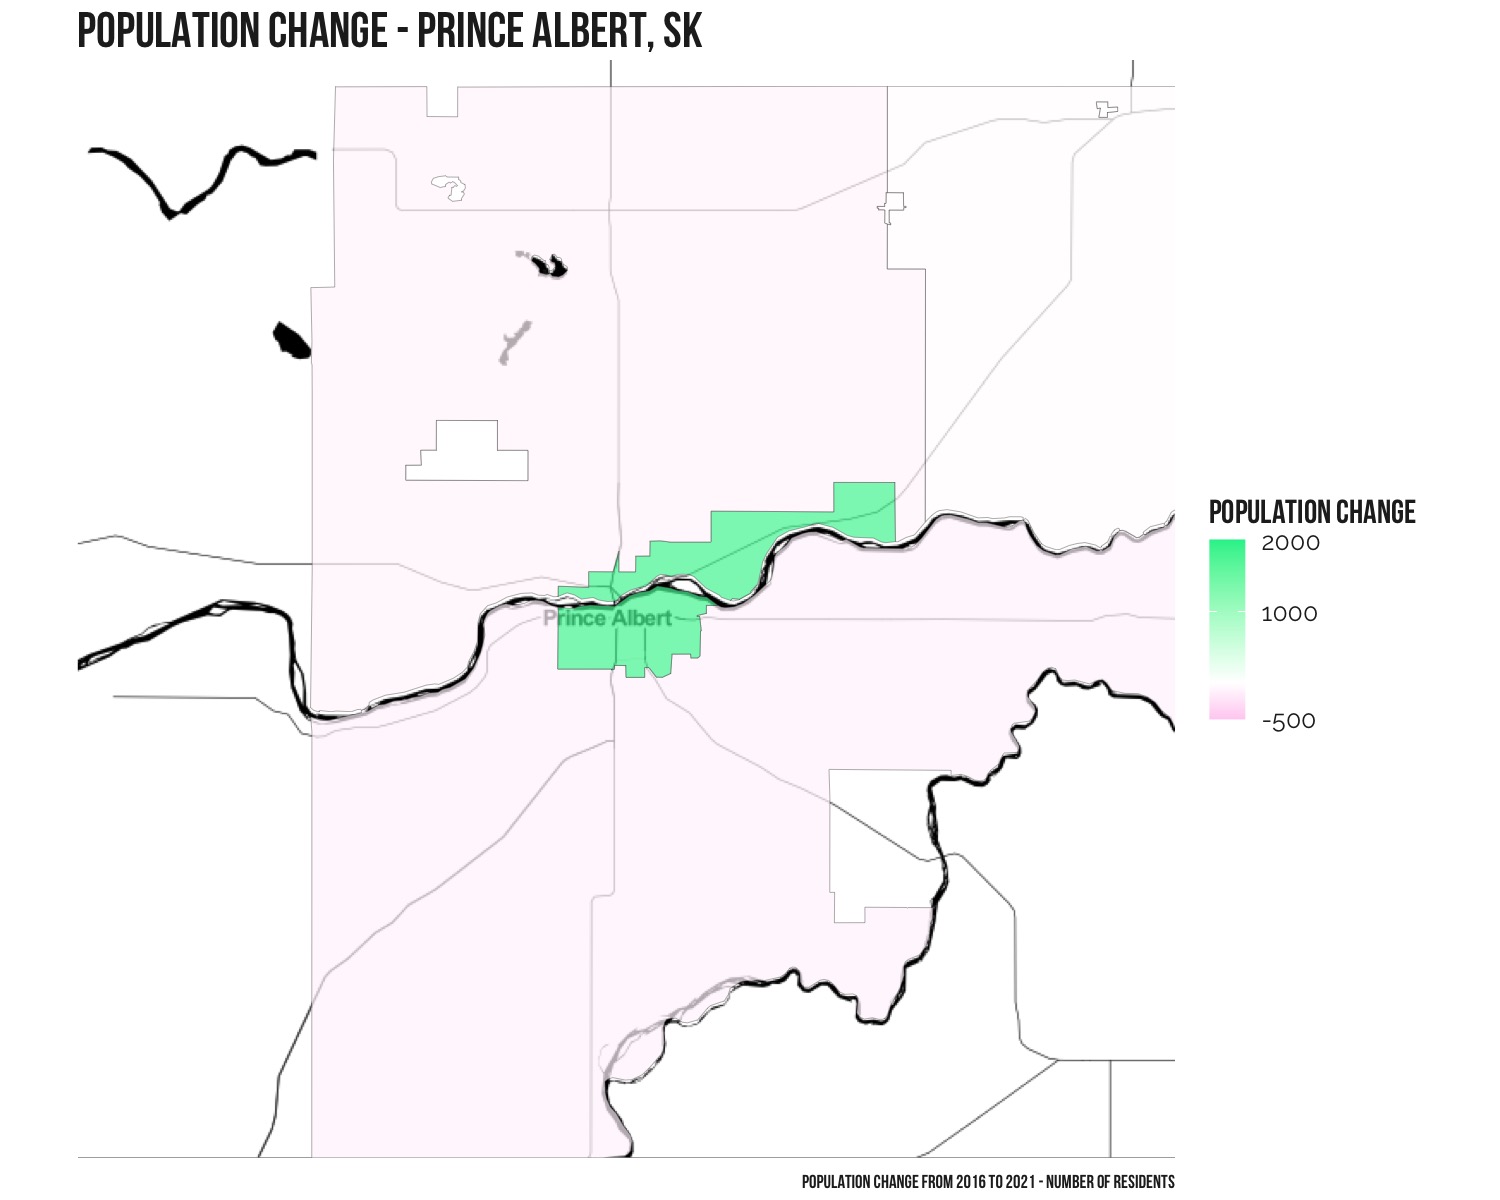
Division No. 15, which includes Prince Albert, saw the third largest increase in population of 3,080 residents from 85,908 in 2016 to 88,988 in 2021 (3.6%).
Which areas have seen the lowest growth?
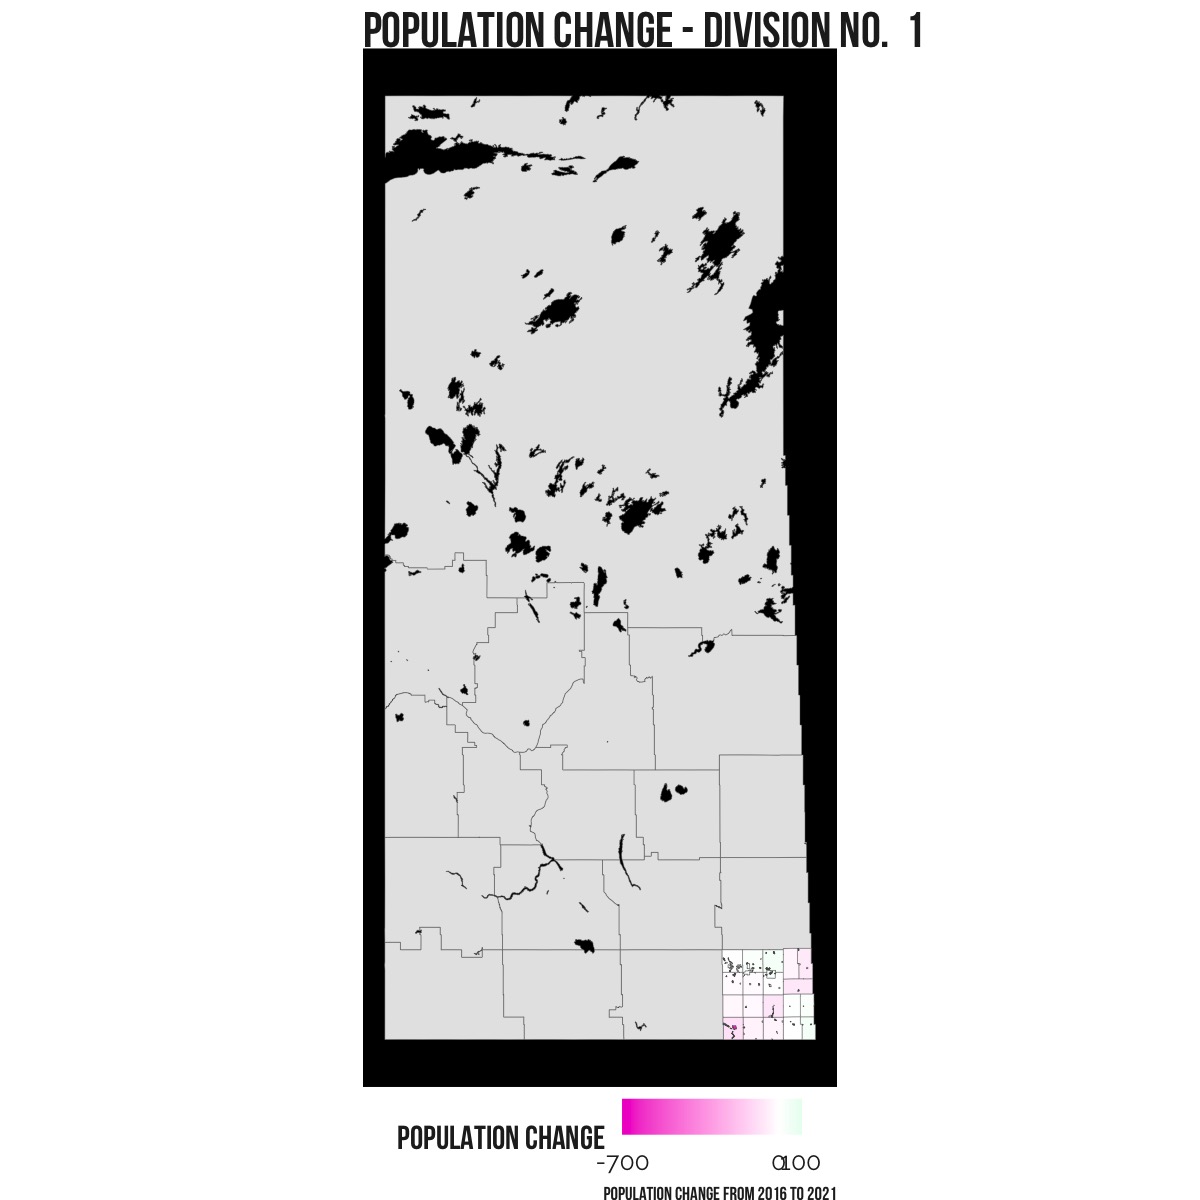
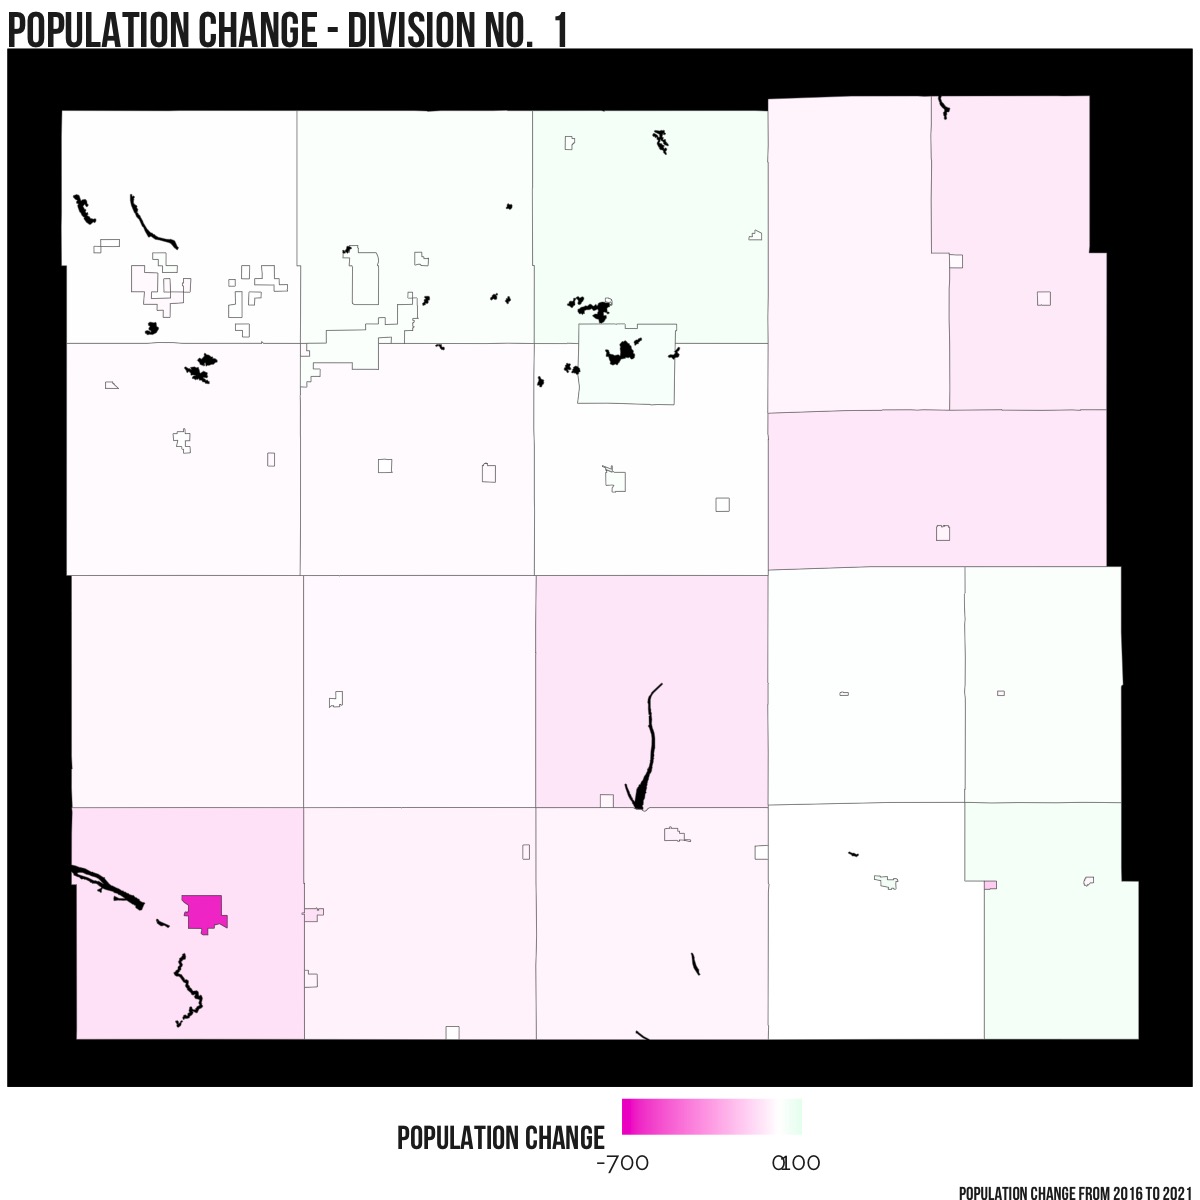
11 of the 18 census divisions in Saskatchewan saw a drop in population. The highest decline as a percentage was Division No. 13 with a 5% drop (1,177 residents). The highest absolute decline was Division No. 1 (including Estevan) with a decline of 1,415 residents, from 31,766 in 2016 to 30,351 in 2021.
Population changes in major cities
There are 10 census metropolitan areas in Saskatchewan. Statistics Canada defines a census metropolitan area (CMA) as “…one or more adjacent municipalities centred on a population centre (known as the core). A CMA must have a total population of at least 100,000 of which 50,000 or more must live in the core.”
Saskatoon is the largest with an overall population of 317,480.
CMA – Saskatoon
The census metropolitan area (CMA) of Saskatoon grew by 22,385 residents from 295,095 in 2016 to 317,480 in 2021.
CMA – Regina
The census metropolitan area (CMA) of Regina grew by 12,522 residents from 236,695 in 2016 to 249,217 in 2021.

CMA – Prince Albert
The census metropolitan area (CMA) of Prince Albert grew by 1,558 residents from 44,160 in 2016 to 45,718 in 2021.
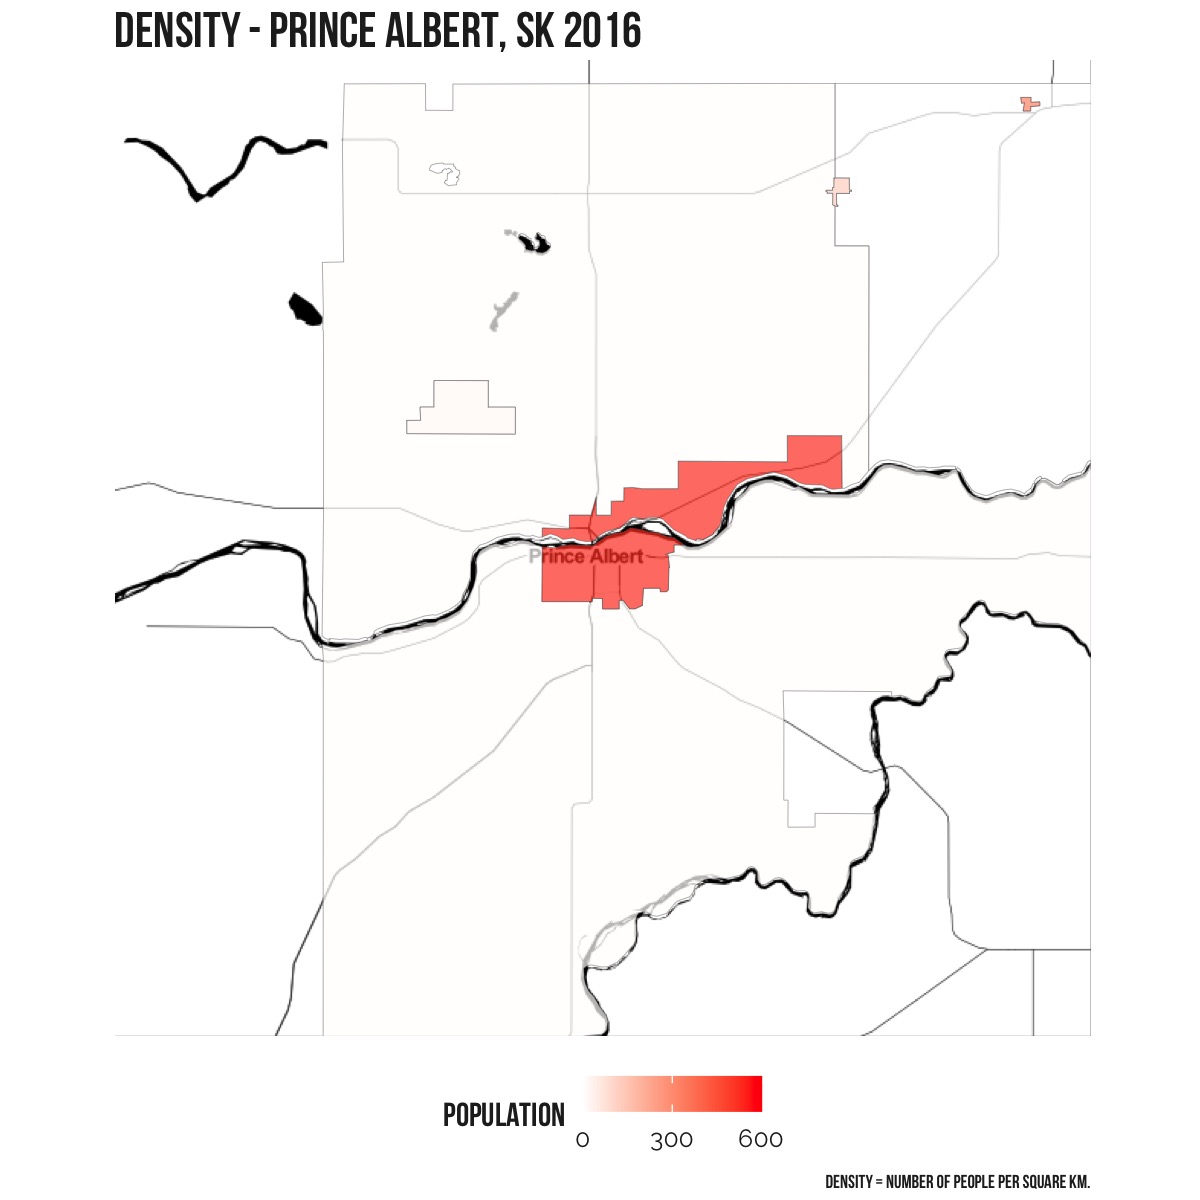
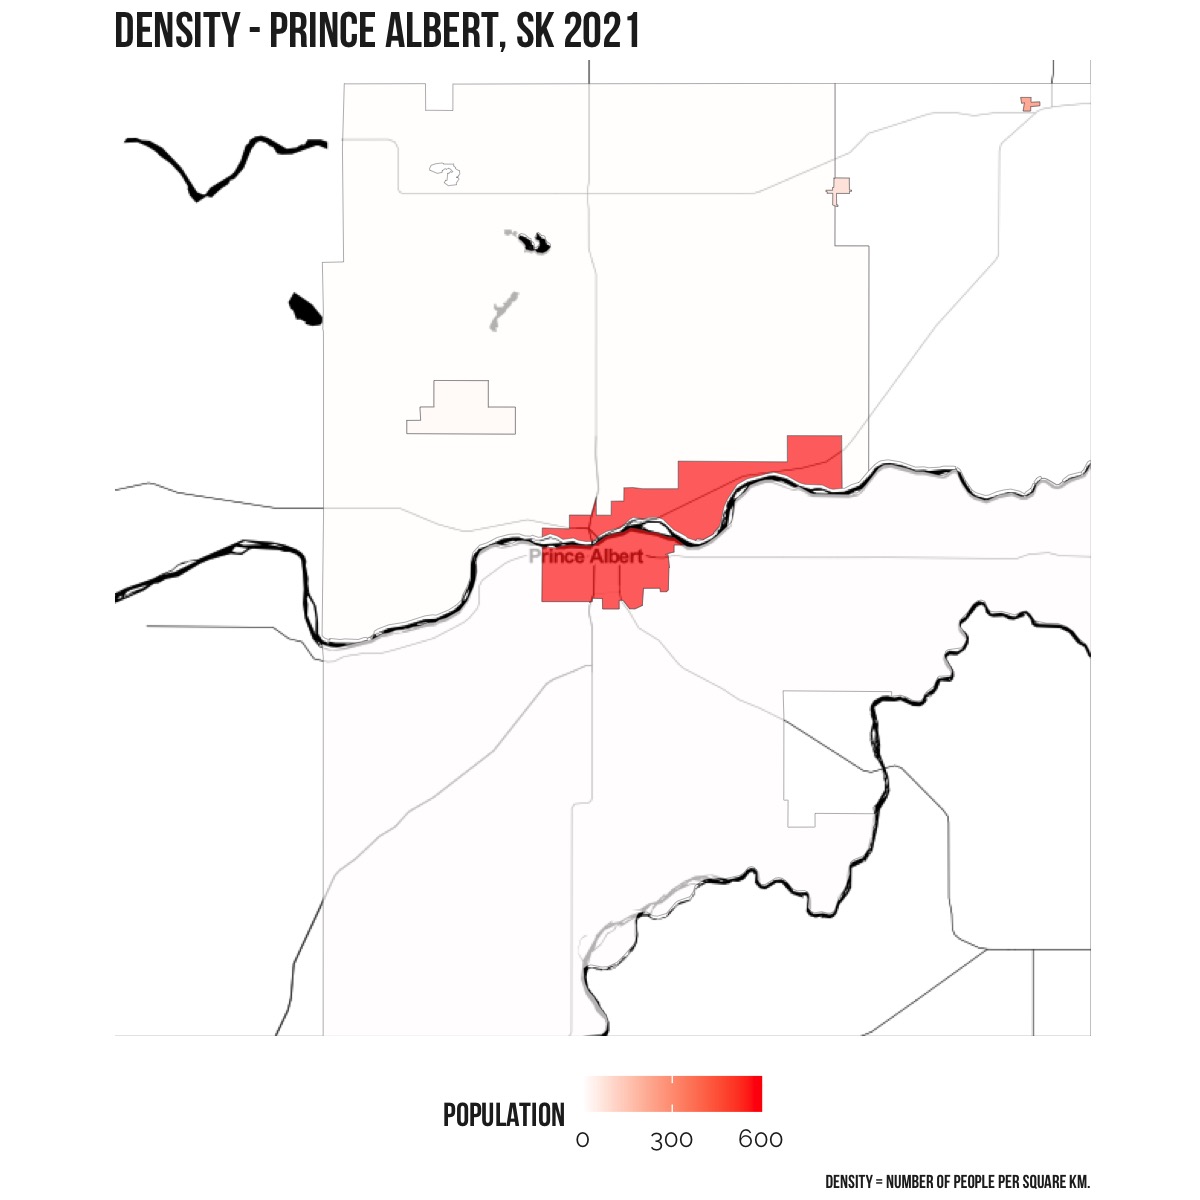
Overall population density