The 2021 census has been released and that means it is time to dive right into some population trends. Population numbers all across Canada have changed substantially between 2016 and 2021 – you can read more about changes across Ontario and other provinces here – News.
At a local level, it is interesting to see how population and density has changed within cities. This post will go into more detail about the changes in Niagara between 2016 and 2021.
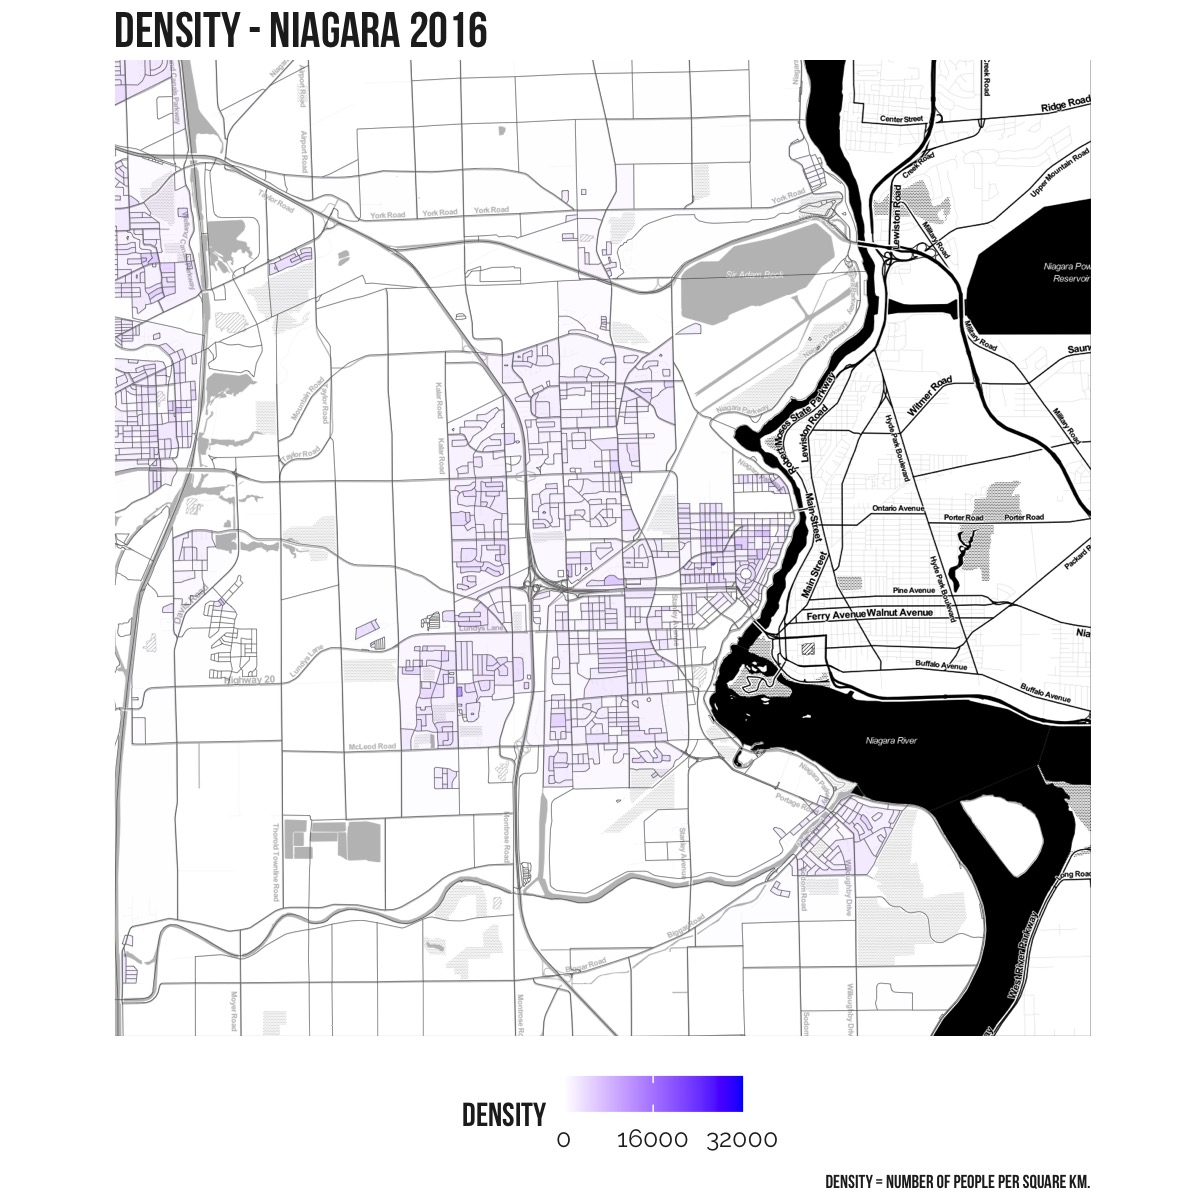
This post specifically looks at the CMA of “St. Catharines – Niagara”, which might be different than what you think of as “Niagara” if you are familiar with the area. This CMA covers Lincoln, Pelham, Wainfleet, St. Catharines, Thorold, Welland, Port Colborne, Niagara-on-the-Lake, Niagara Falls, and Fort Erie. It does not include West Lincoln or Grimsby. Specifically Statistics Canada defines a census metropolitan area (CMA) as “…one or more adjacent municipalities centred on a population centre (known as the core). A CMA must have a total population of at least 100,000 of which 50,000 or more must live in the core.”
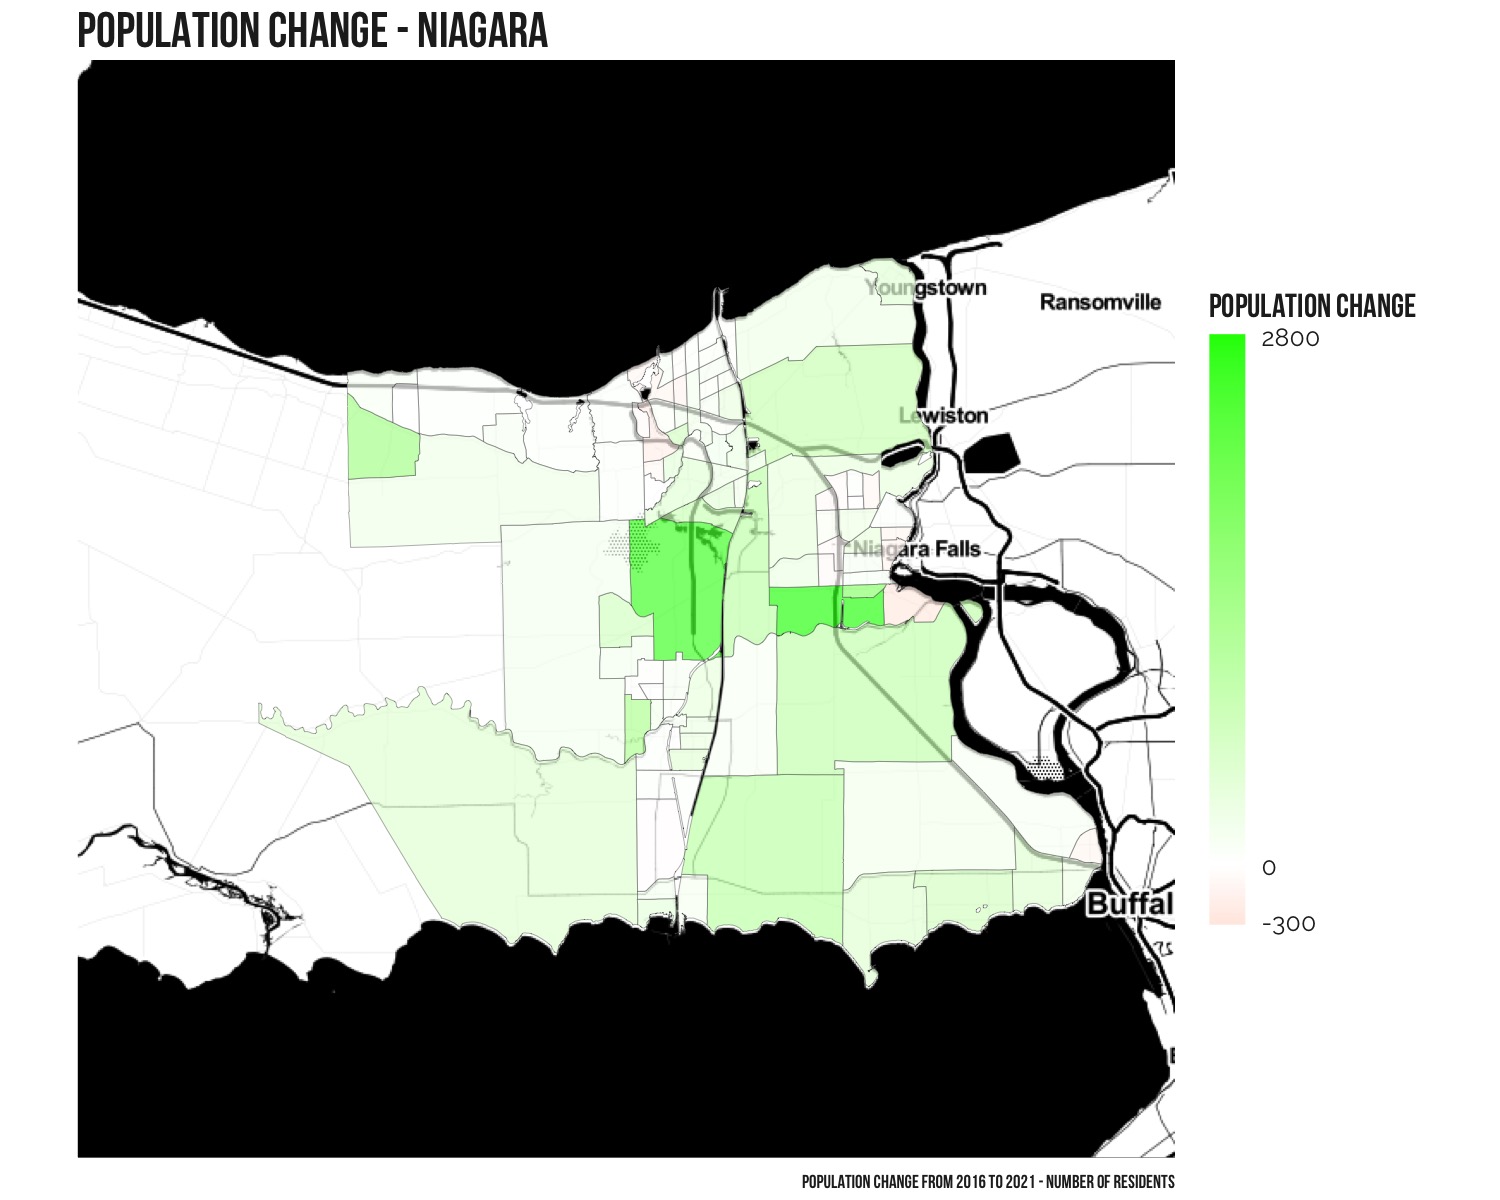
Overall this area has seen an increase of 27,530 residents, from 406,074 in 2016 to 433,604 in 2021. The map below shows how population has changed across the 98 different Census Tracts across St. Catharines/Niagara with green an increase, white no change, and red a decrease.
Highest Growth Areas
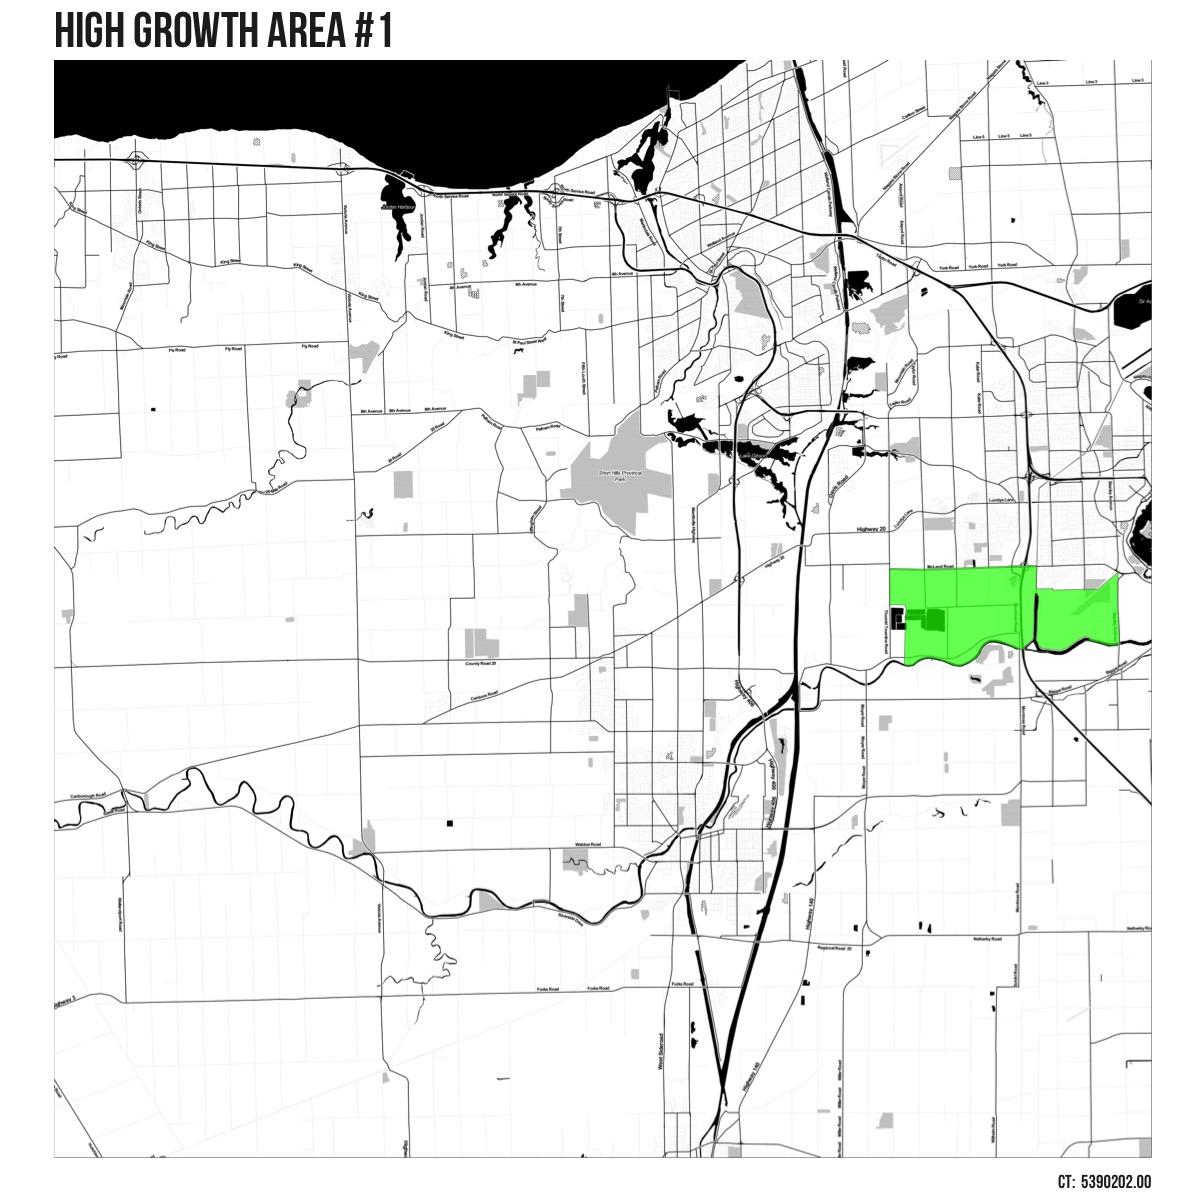
High Growth Area #1
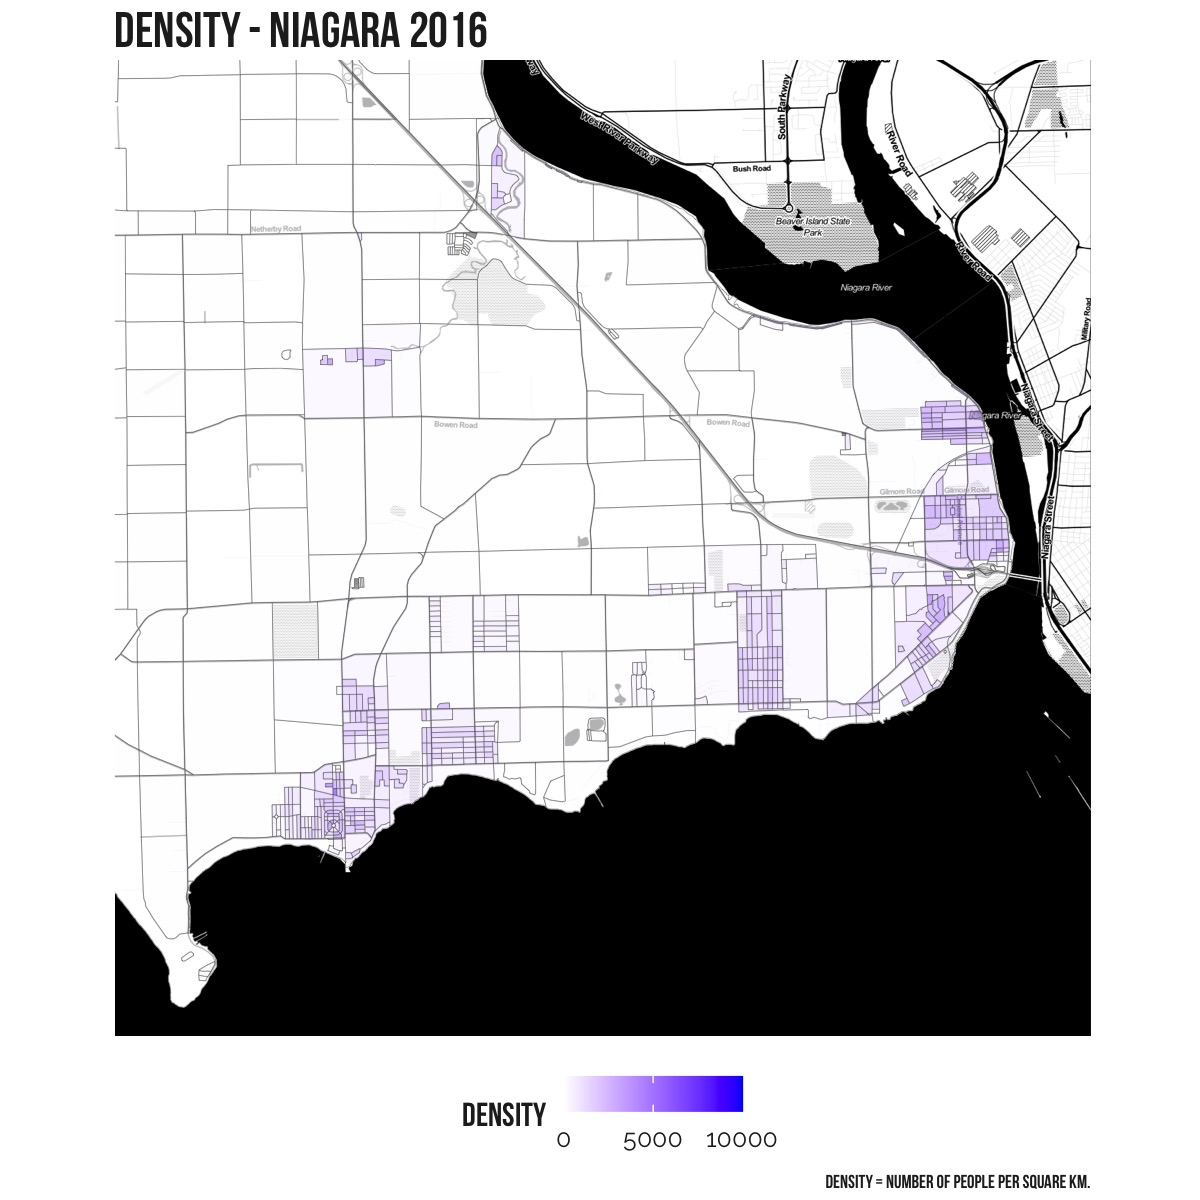
South Niagara Falls has seen the largest amount of growth – more than 2,700 people. This census tract is bordered by McLeod Rd to the north and the Welland river to the South.
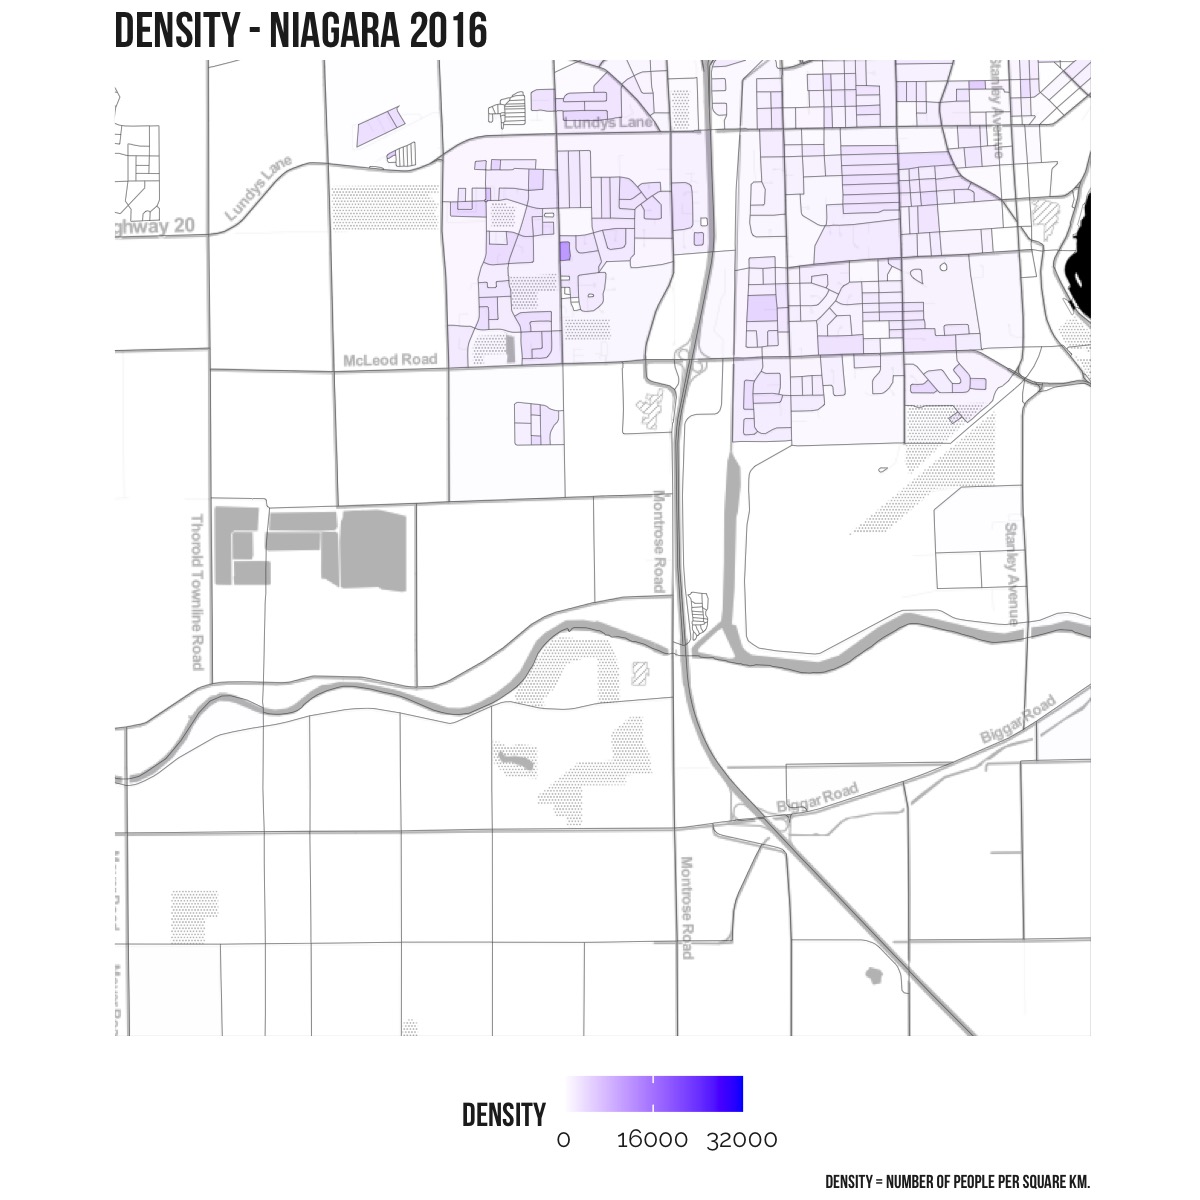
Drag the slider on the map below to see how population density has changed in this area between 2016 and 2021.
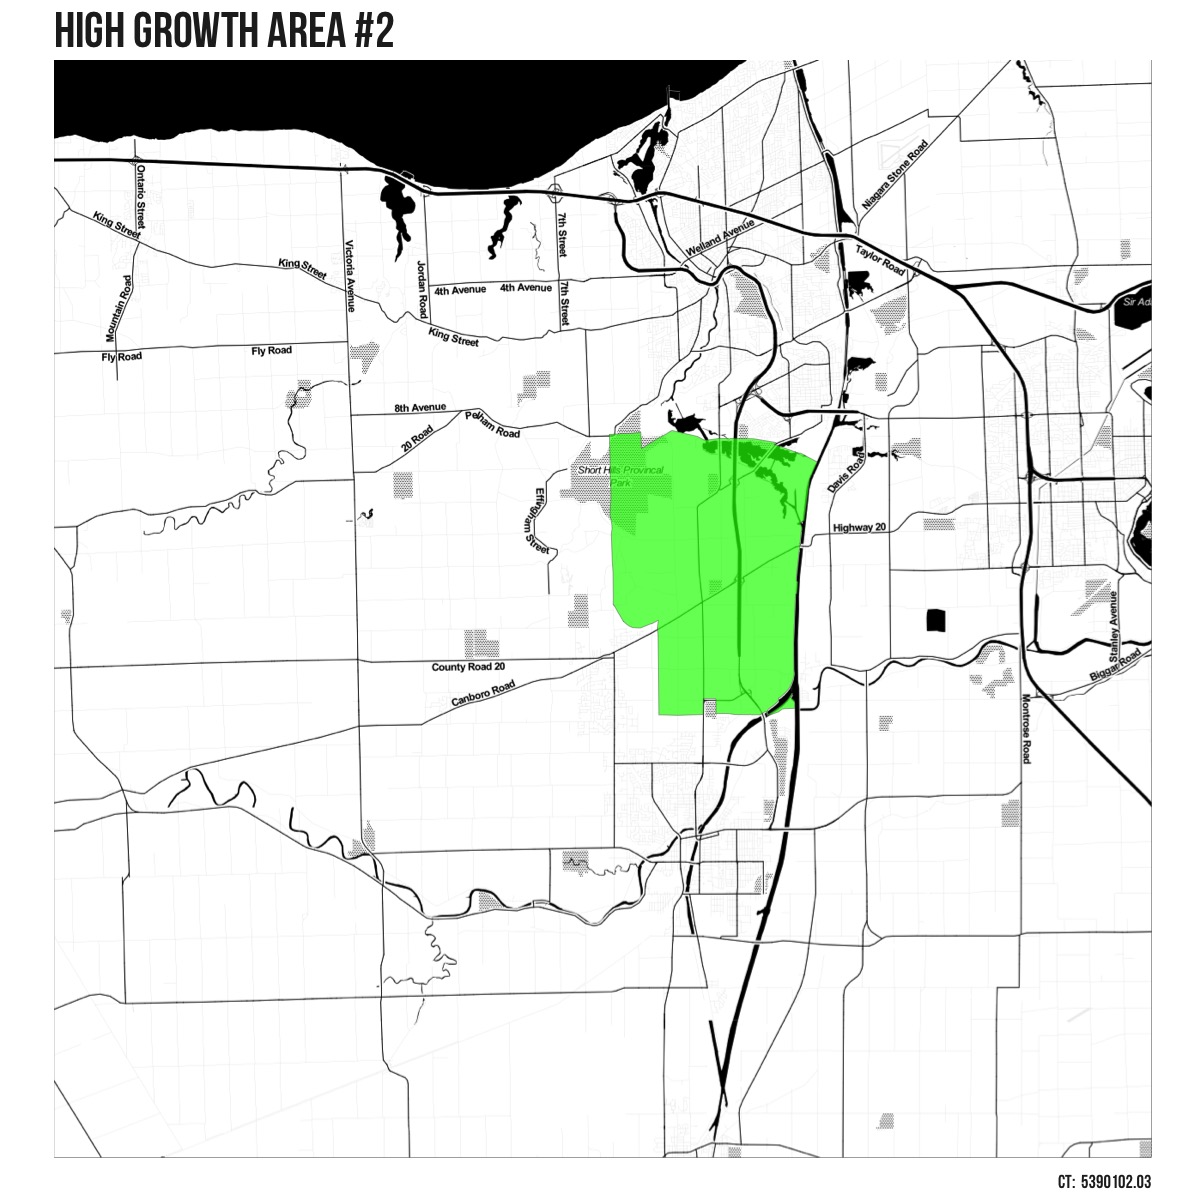
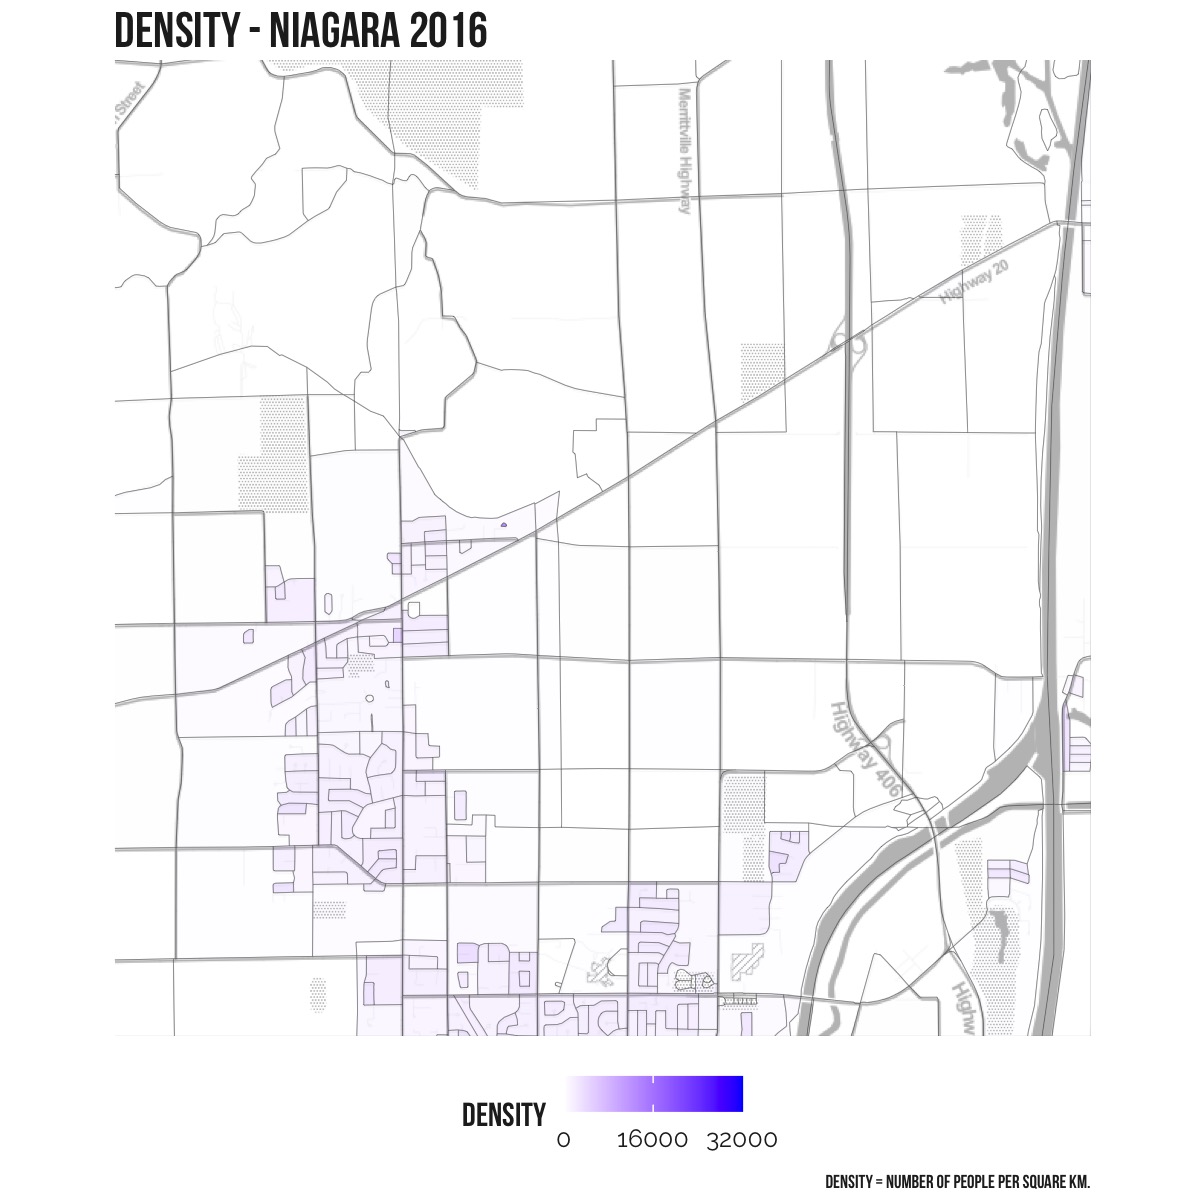
High Growth Area #2
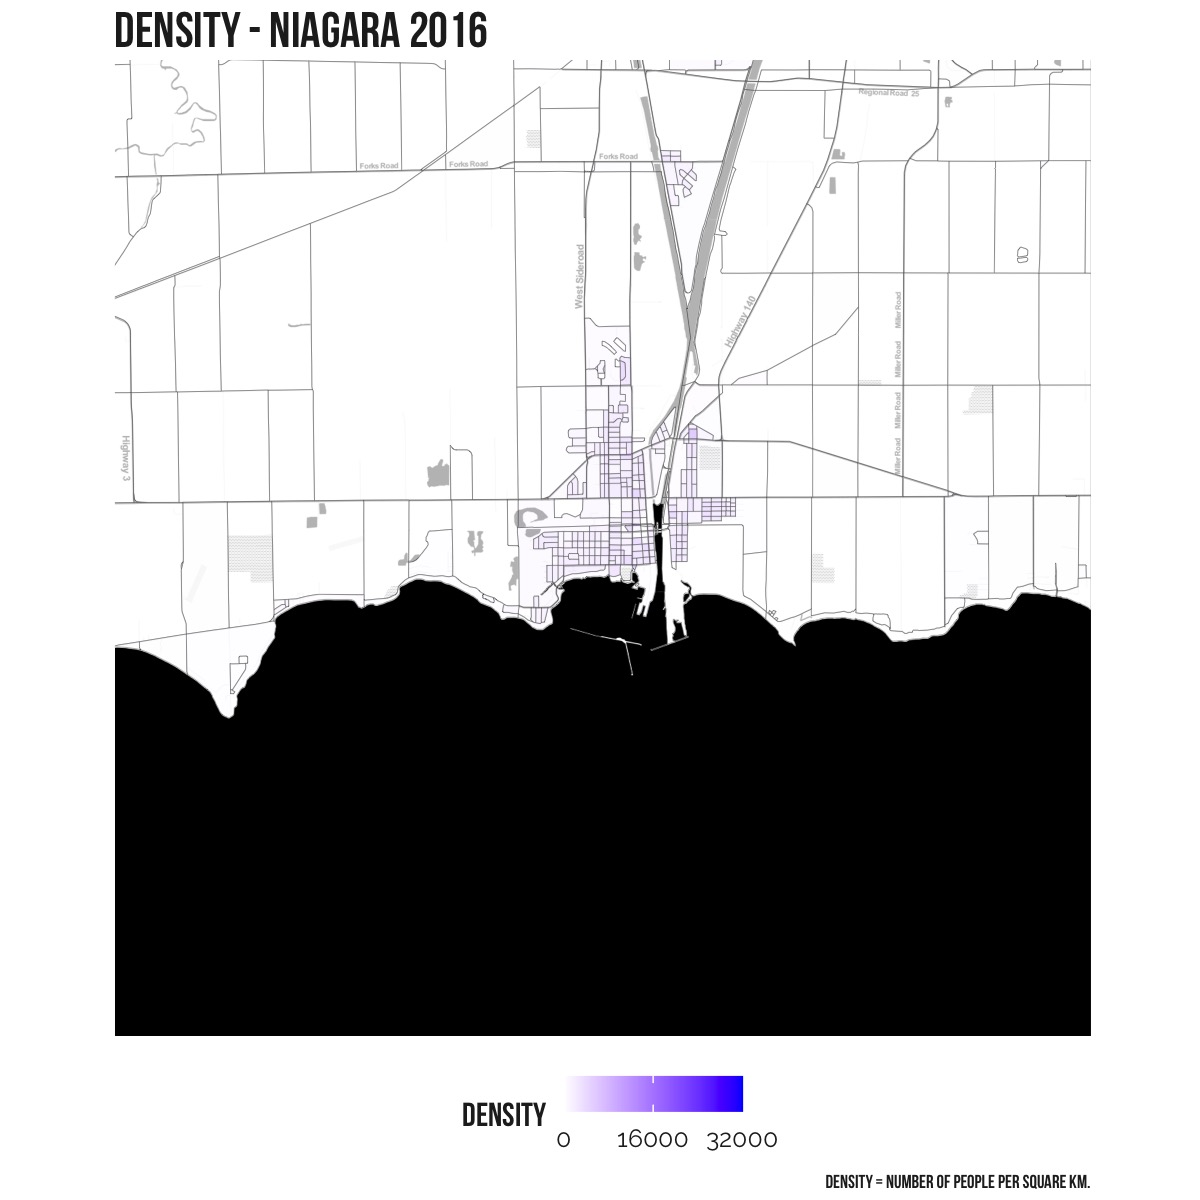
The north area of Welland (north of Quaker Rd) has seen the second highest amount of growth – more than 2,500 people.
Drag the slider on the map below to see how population density has changed in this area between 2016 and 2021.
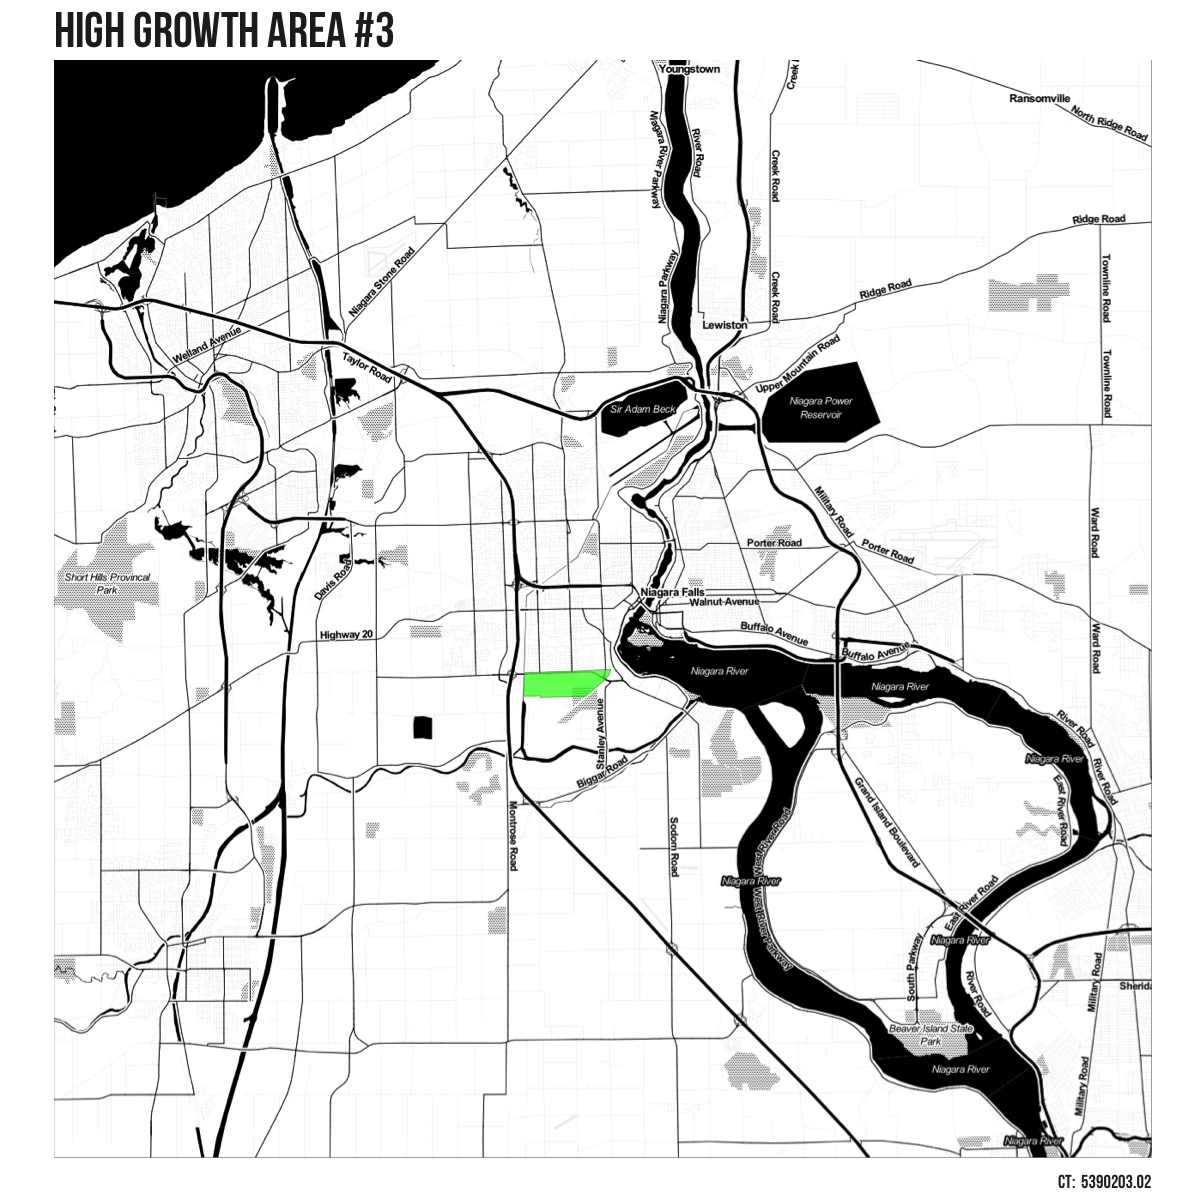
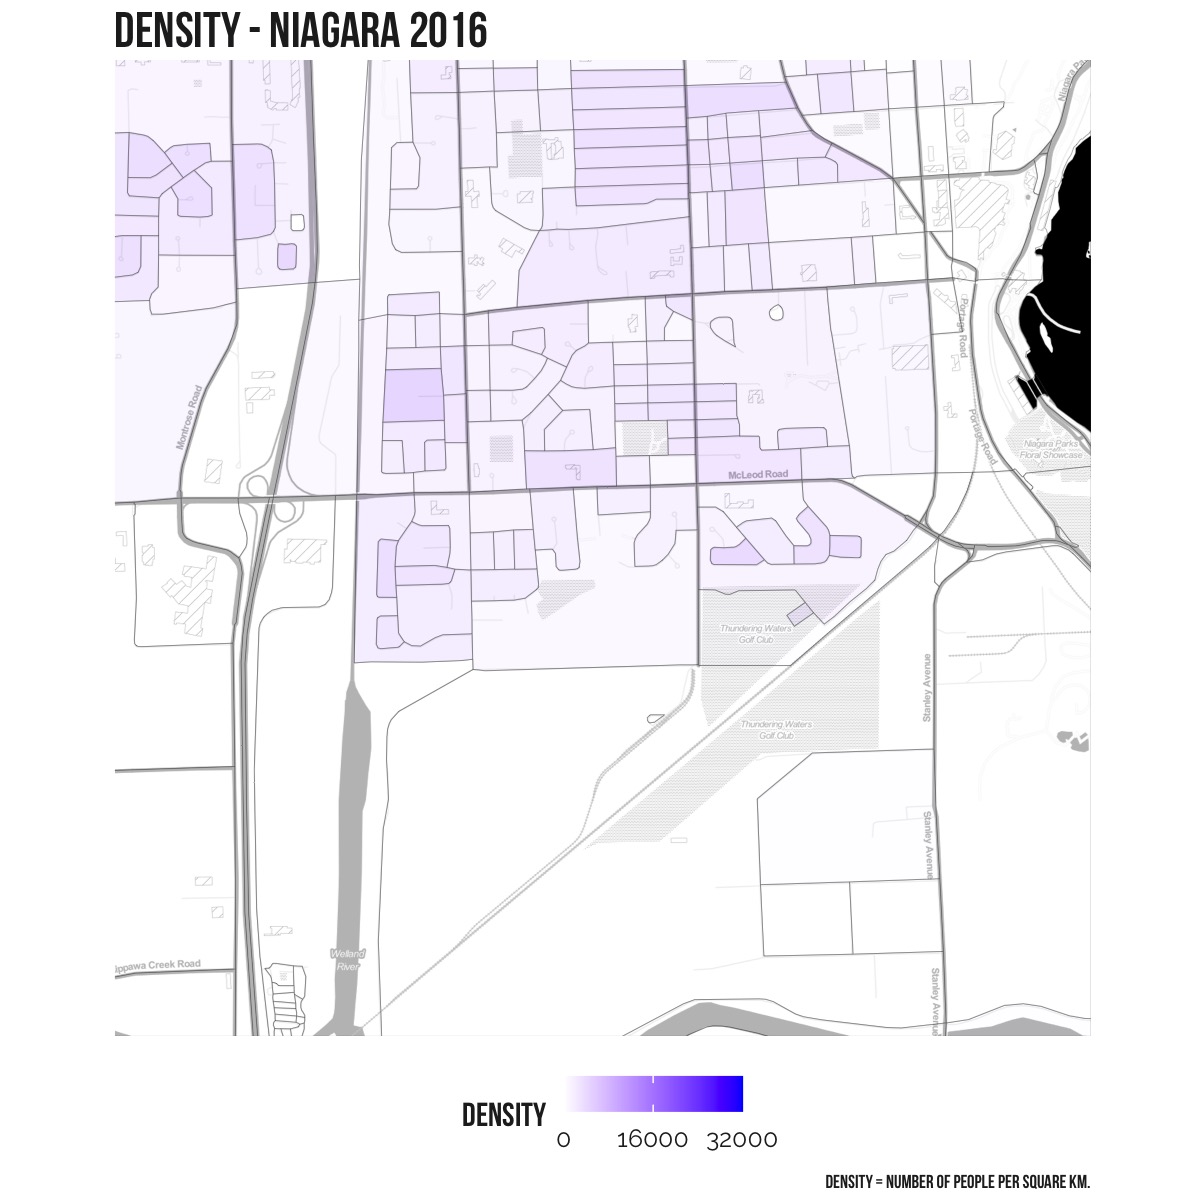
High Growth Area #3
The census tract with the third highest growth is also in south Niagara Falls and borders the area identified earlier in the highest growth position. This smaller area grew by more than 1,700 people and is bordered by the Hydro Canal on the west, Stanley Ave on the east, McCleod to the north, and Oldfield Rd to the south.
Drag the slider on the map below to see how population density has changed in this area between 2016 and 2021.
Low Growth Area
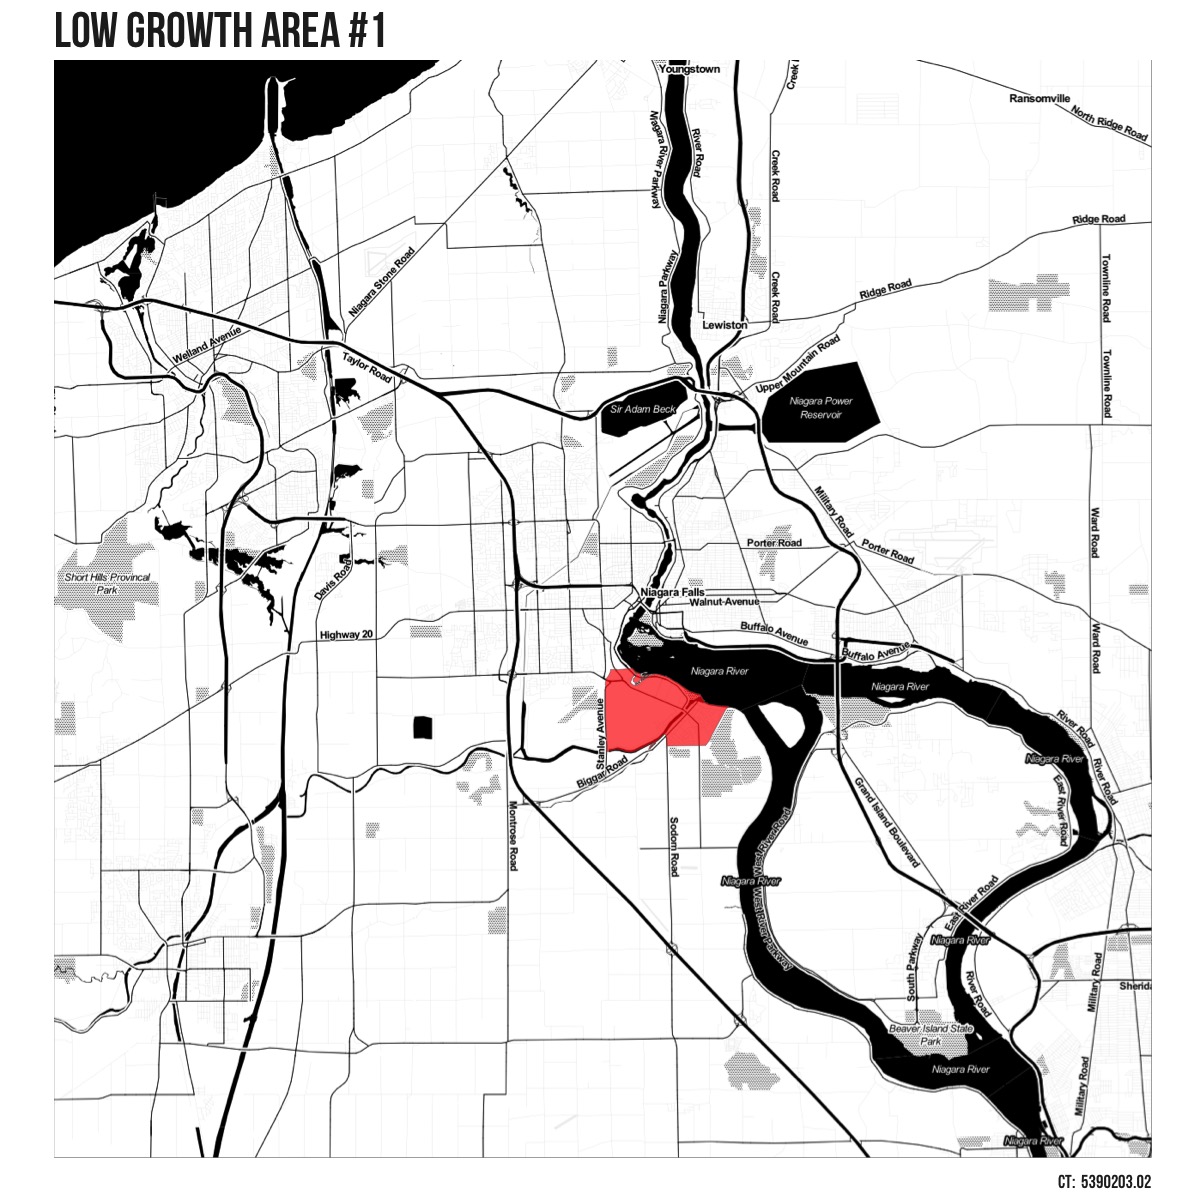
Low Growth Area #1
Surprisingly, the area with the largest decline in population borders two areas of high growth in Niagara Falls. The area east of Stanley Ave, to the Niagara River has seen a decline of more than 250 residents.
Other Areas of Interest
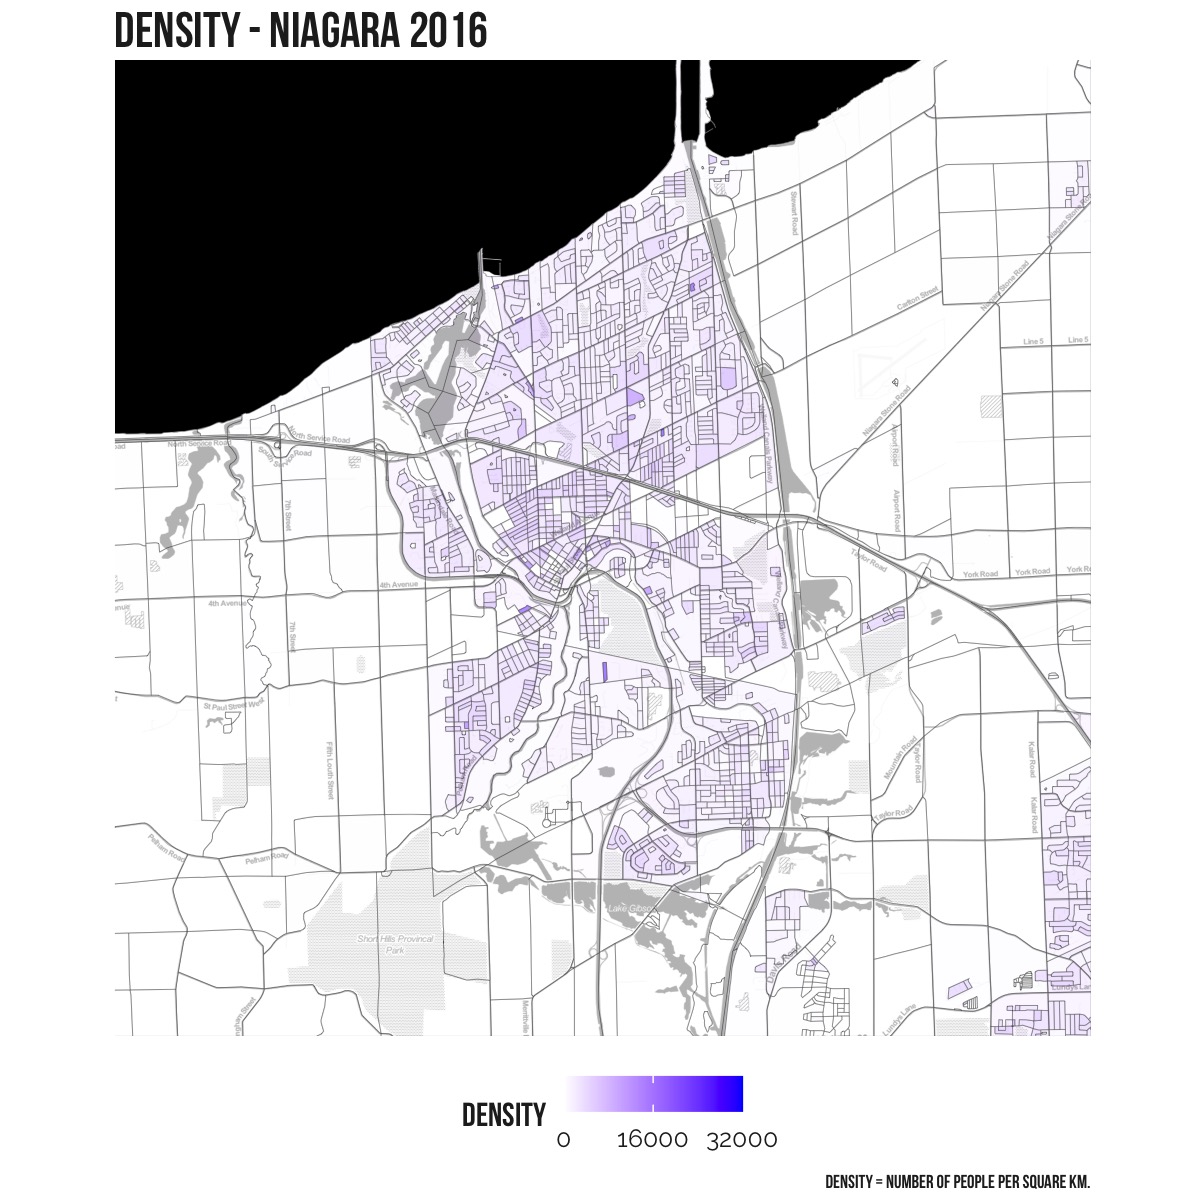
St. Catharines and Thorold
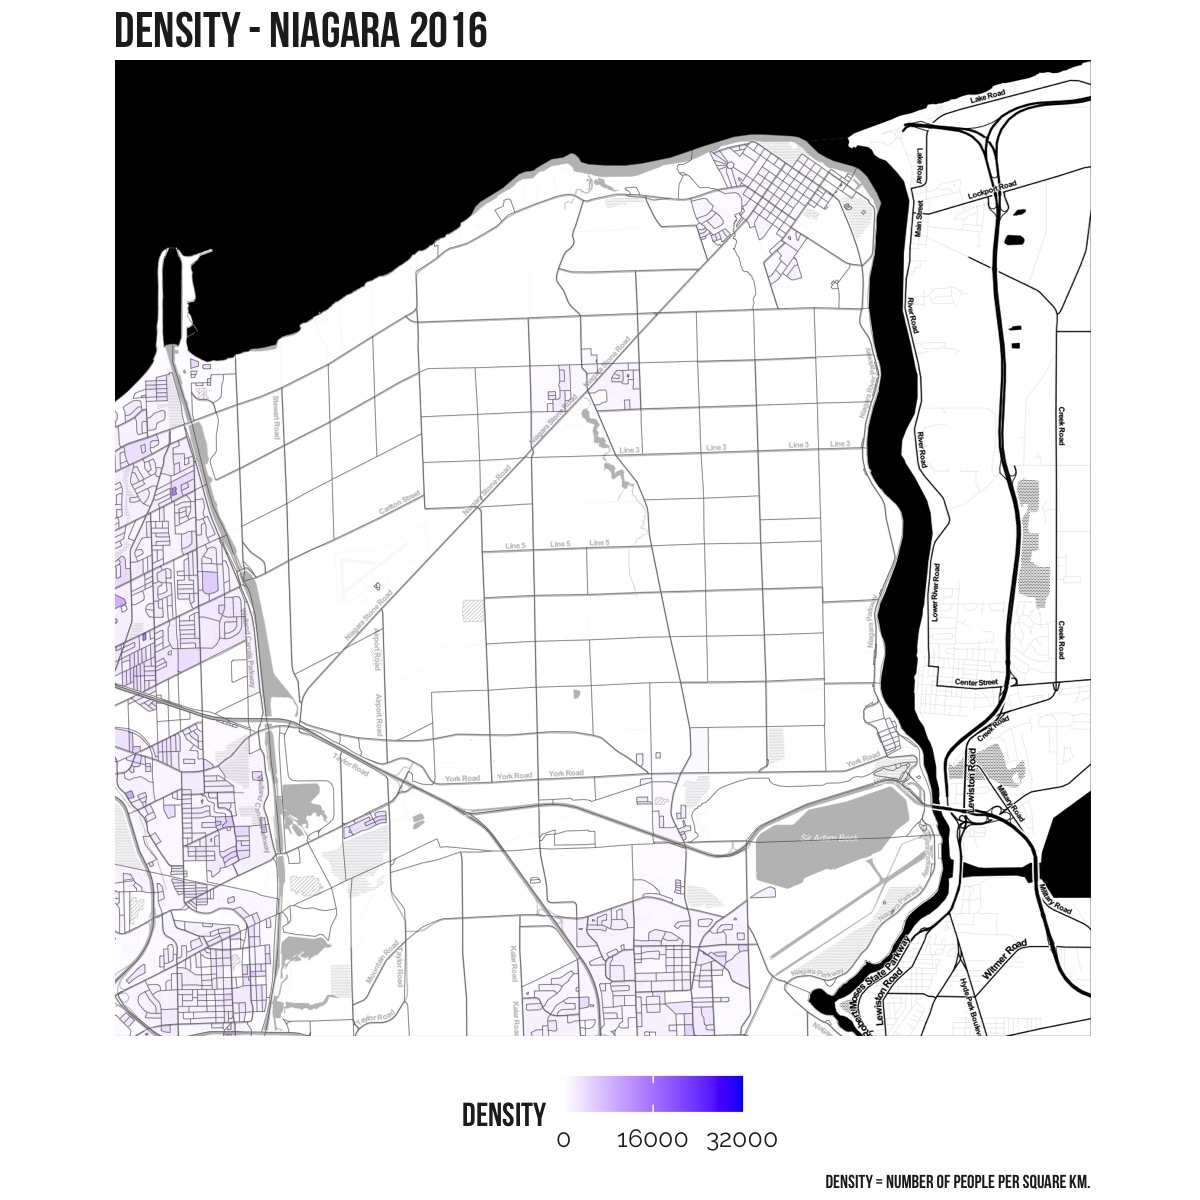
Niagara-on-the-Lake
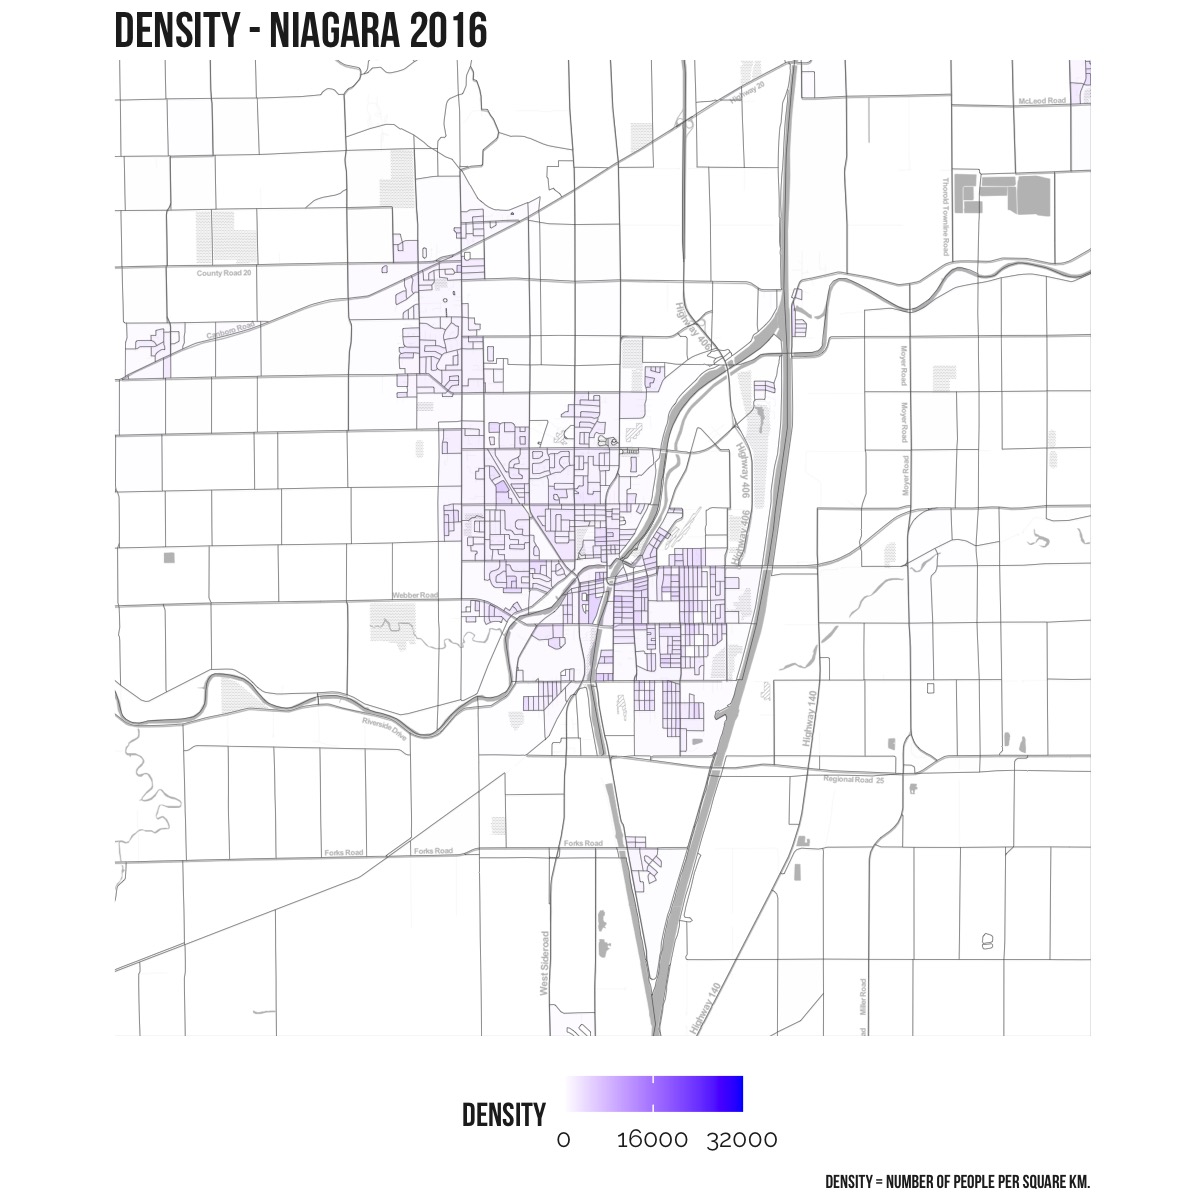
Welland, Fonthill, Pelham
Niagara Falls
Port Colborne
Fort Erie
What else do you want to see?
Is there other info you want to see? Or other locations? Get in touch – Contact Me
