Continuing with the 2021 census data, this post covers household income in all neighbourhoods of Niagara. More specifically, this post maps the “median total income of economic family” according to Statistics Canada. For more information on this definition, visit Total Income – Statistics Canada.
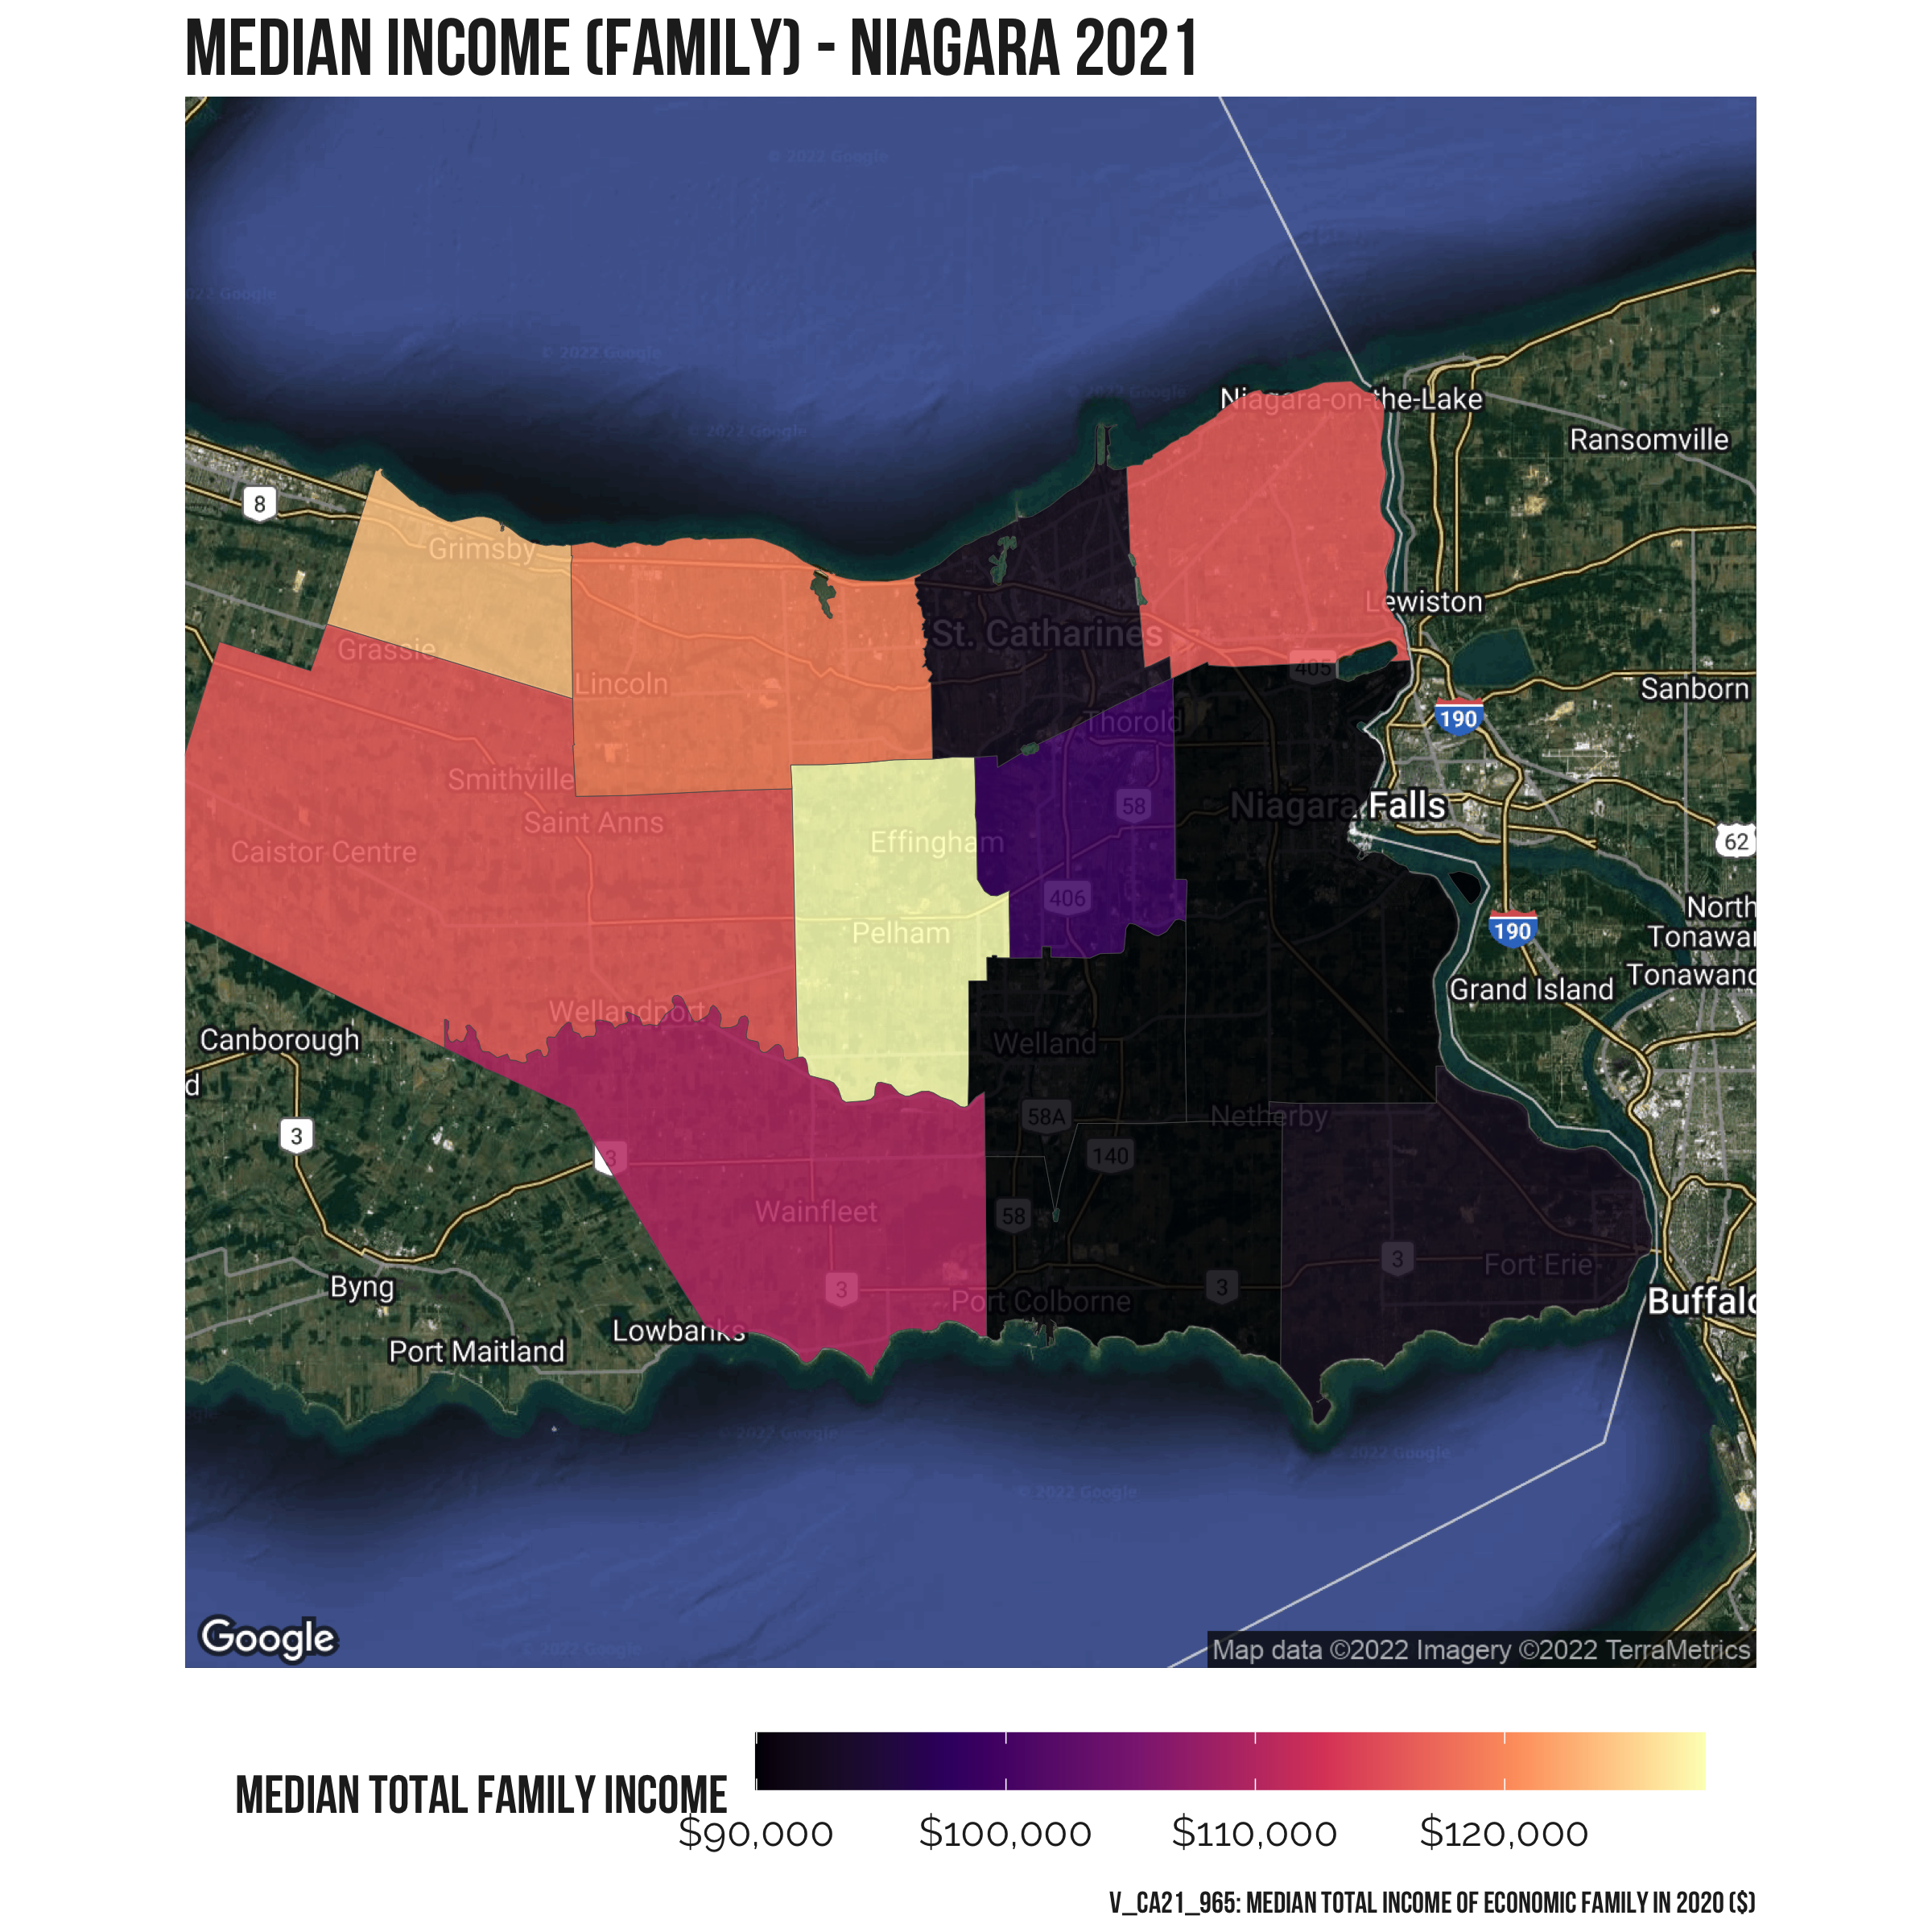
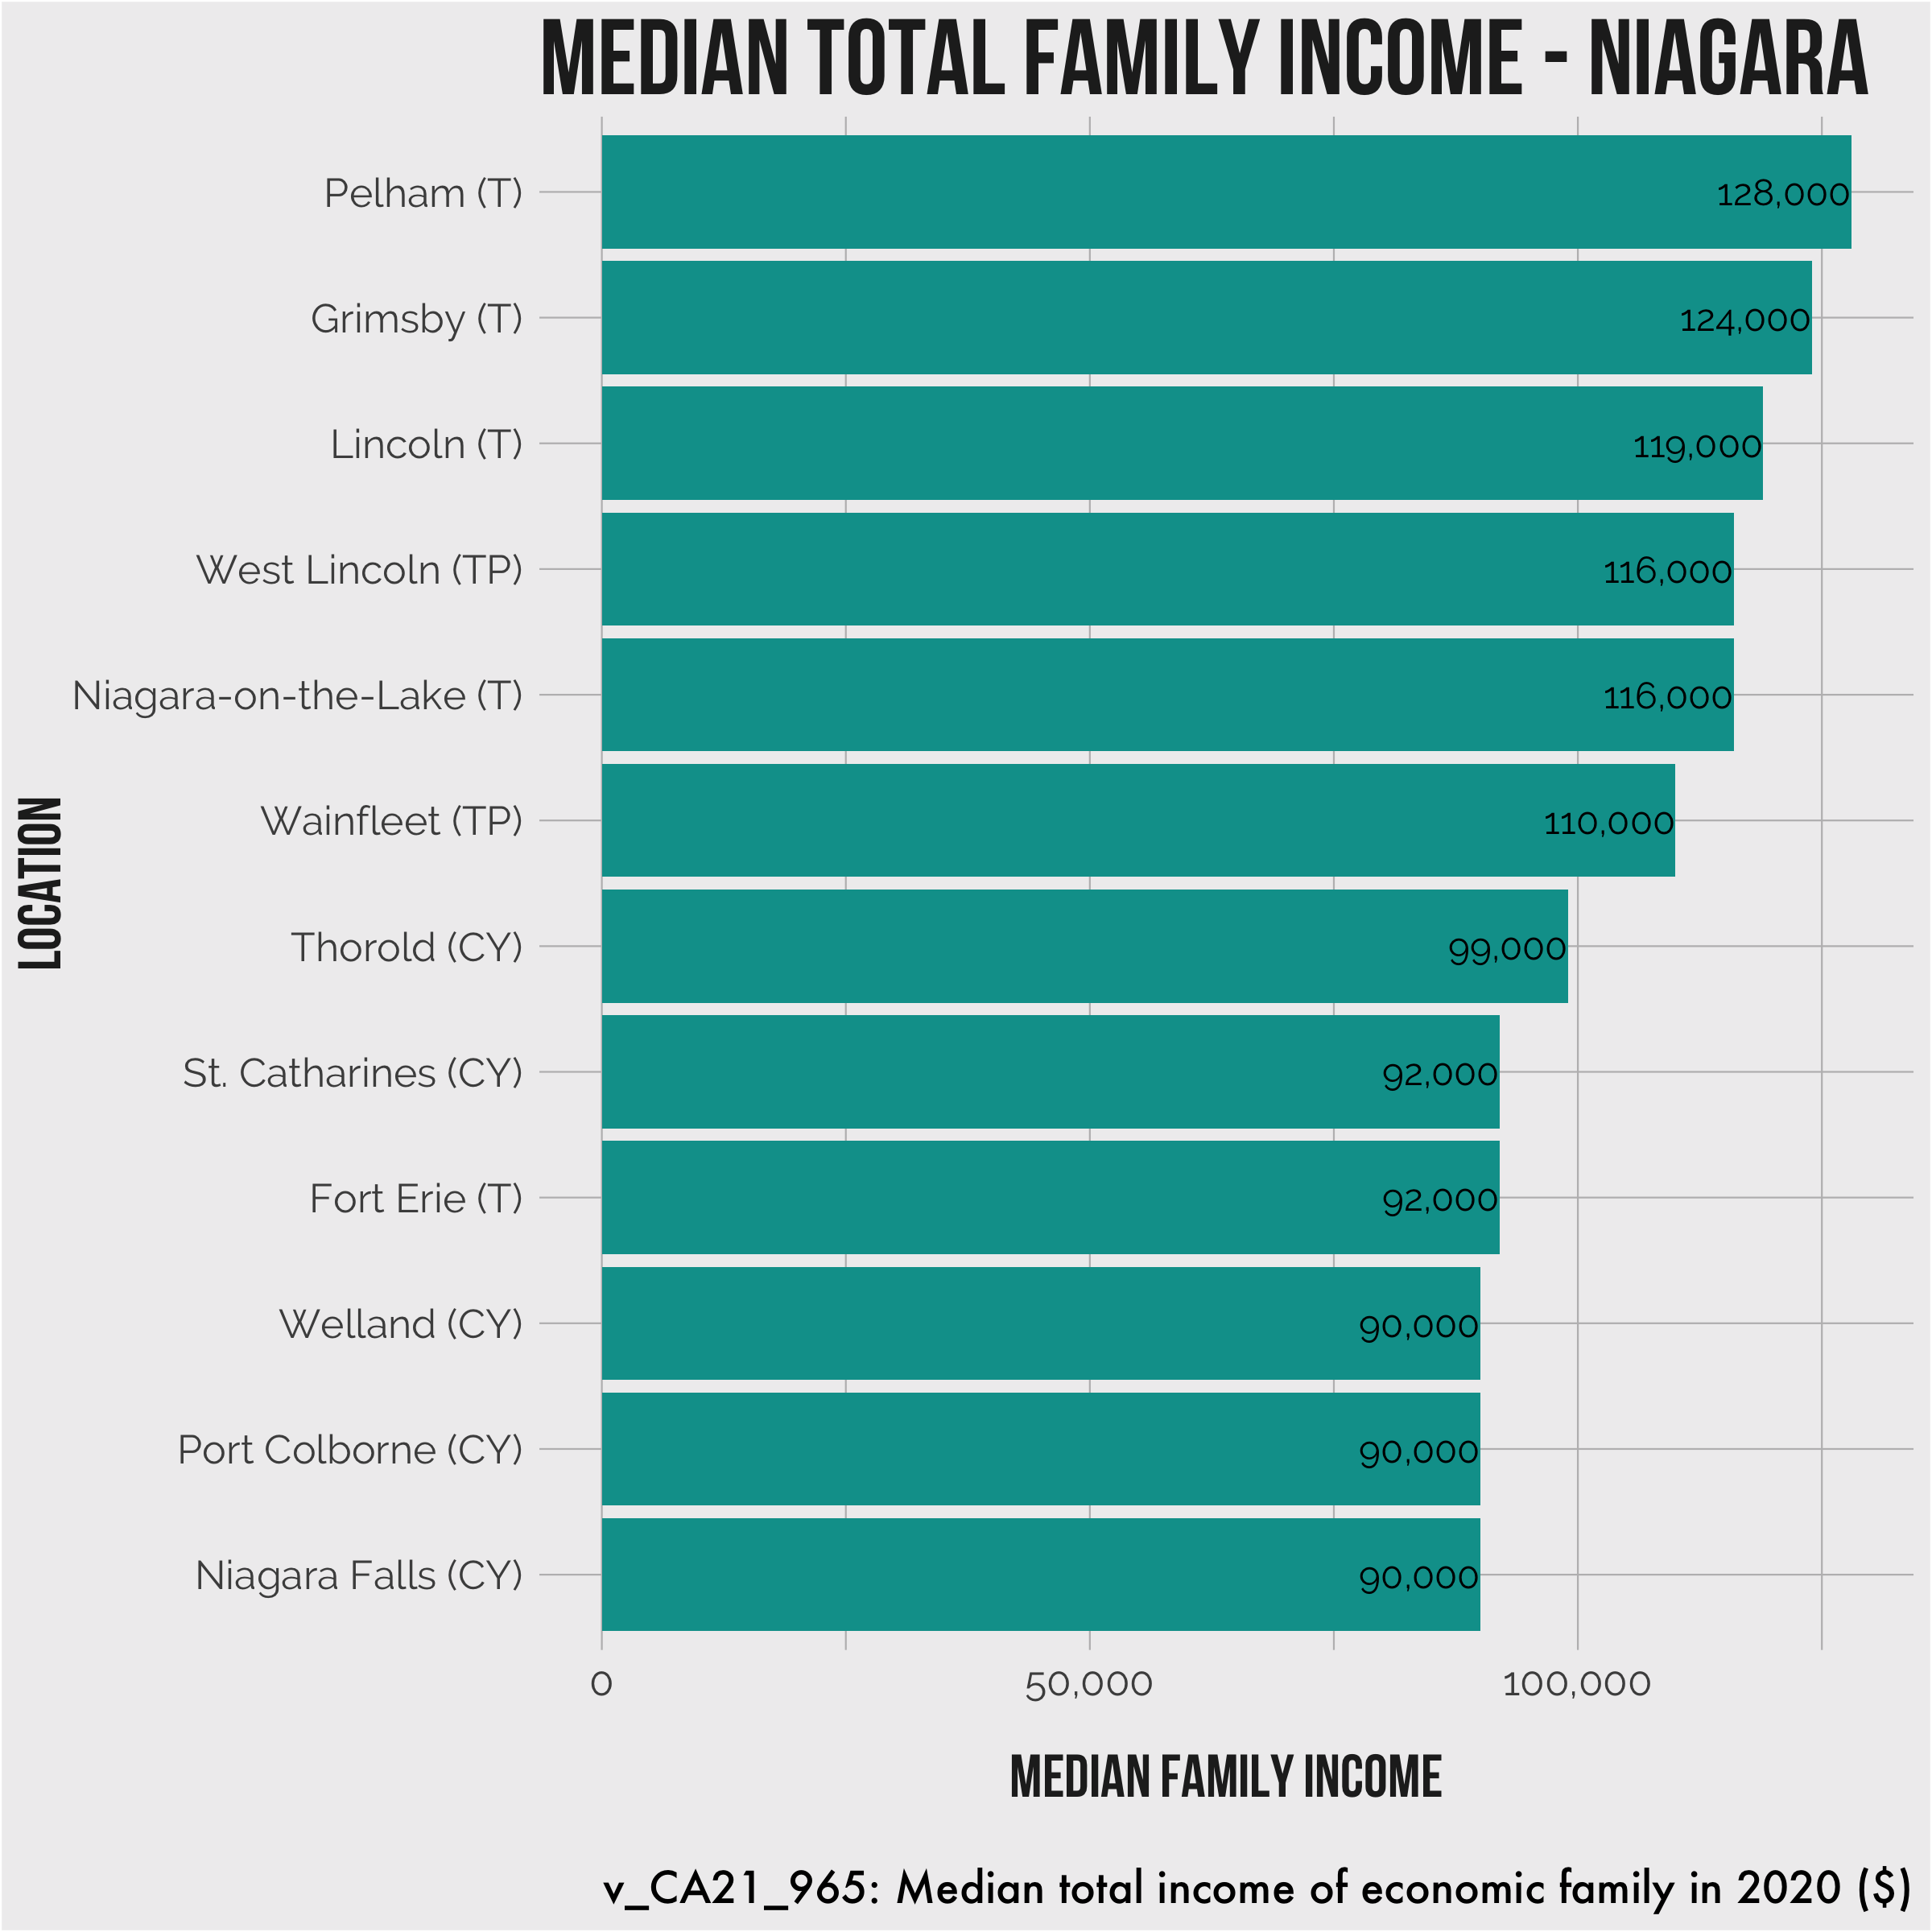
The map below shows the overall median income (family) for each of the 12 local municipalities in the region.
It is important to note that “income” does not necessarily equal wealth. An area that has a large number of wealthy retirees for example, might have a low median income since these individuals are no longer earning employment income.
A deeper look at median total income
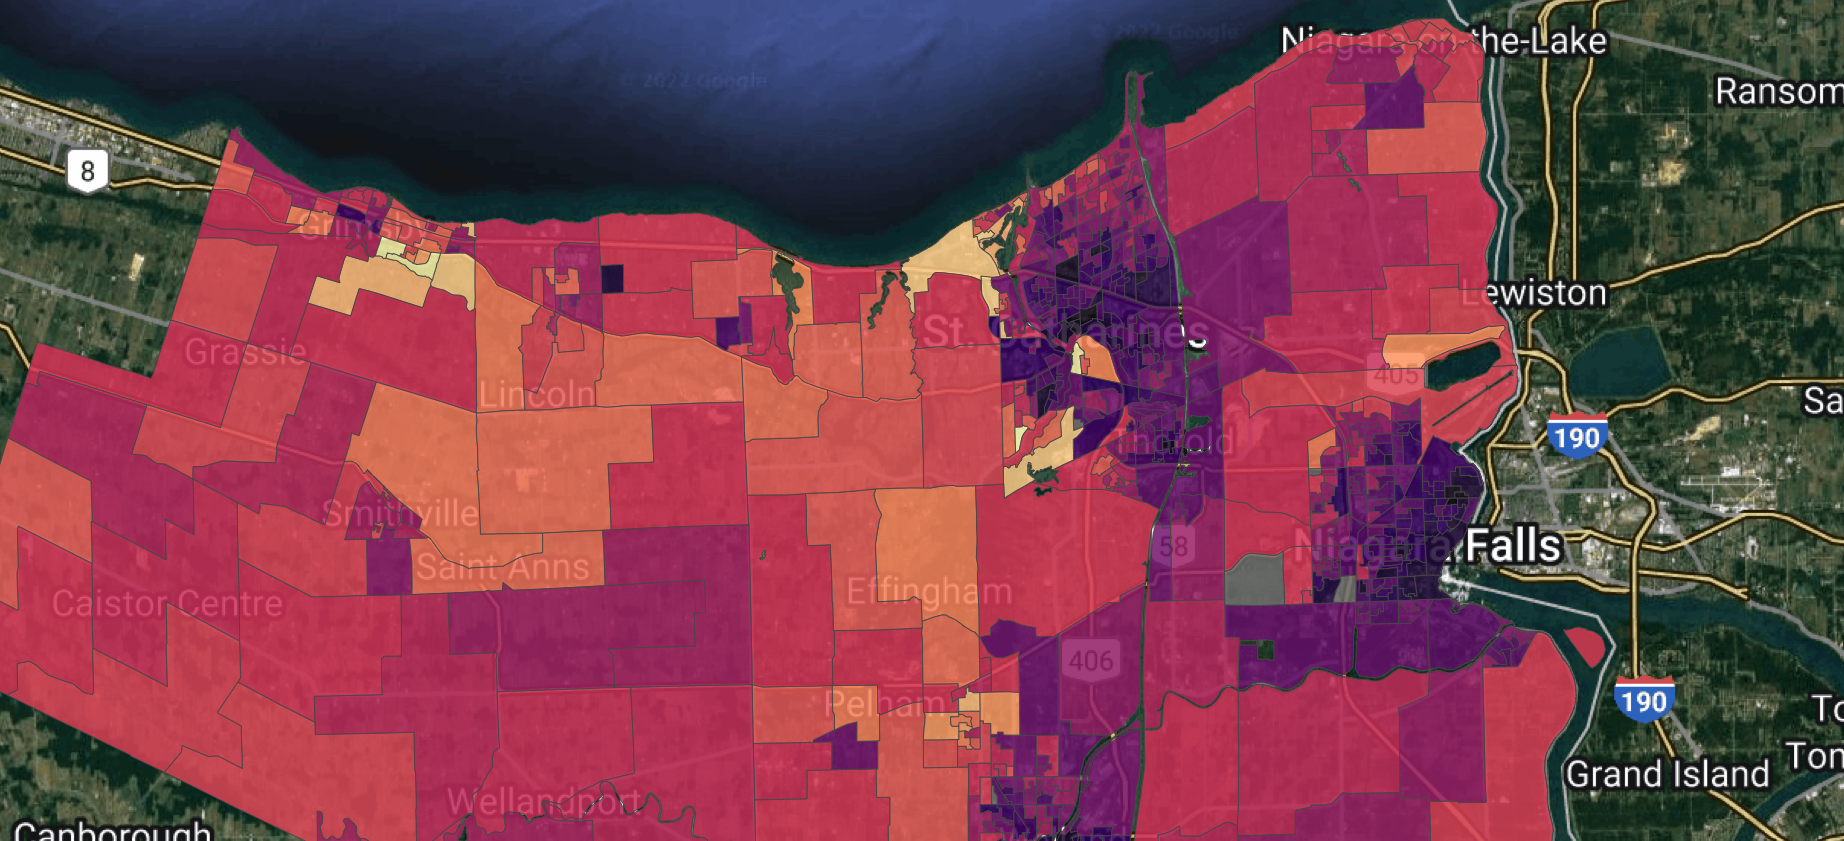
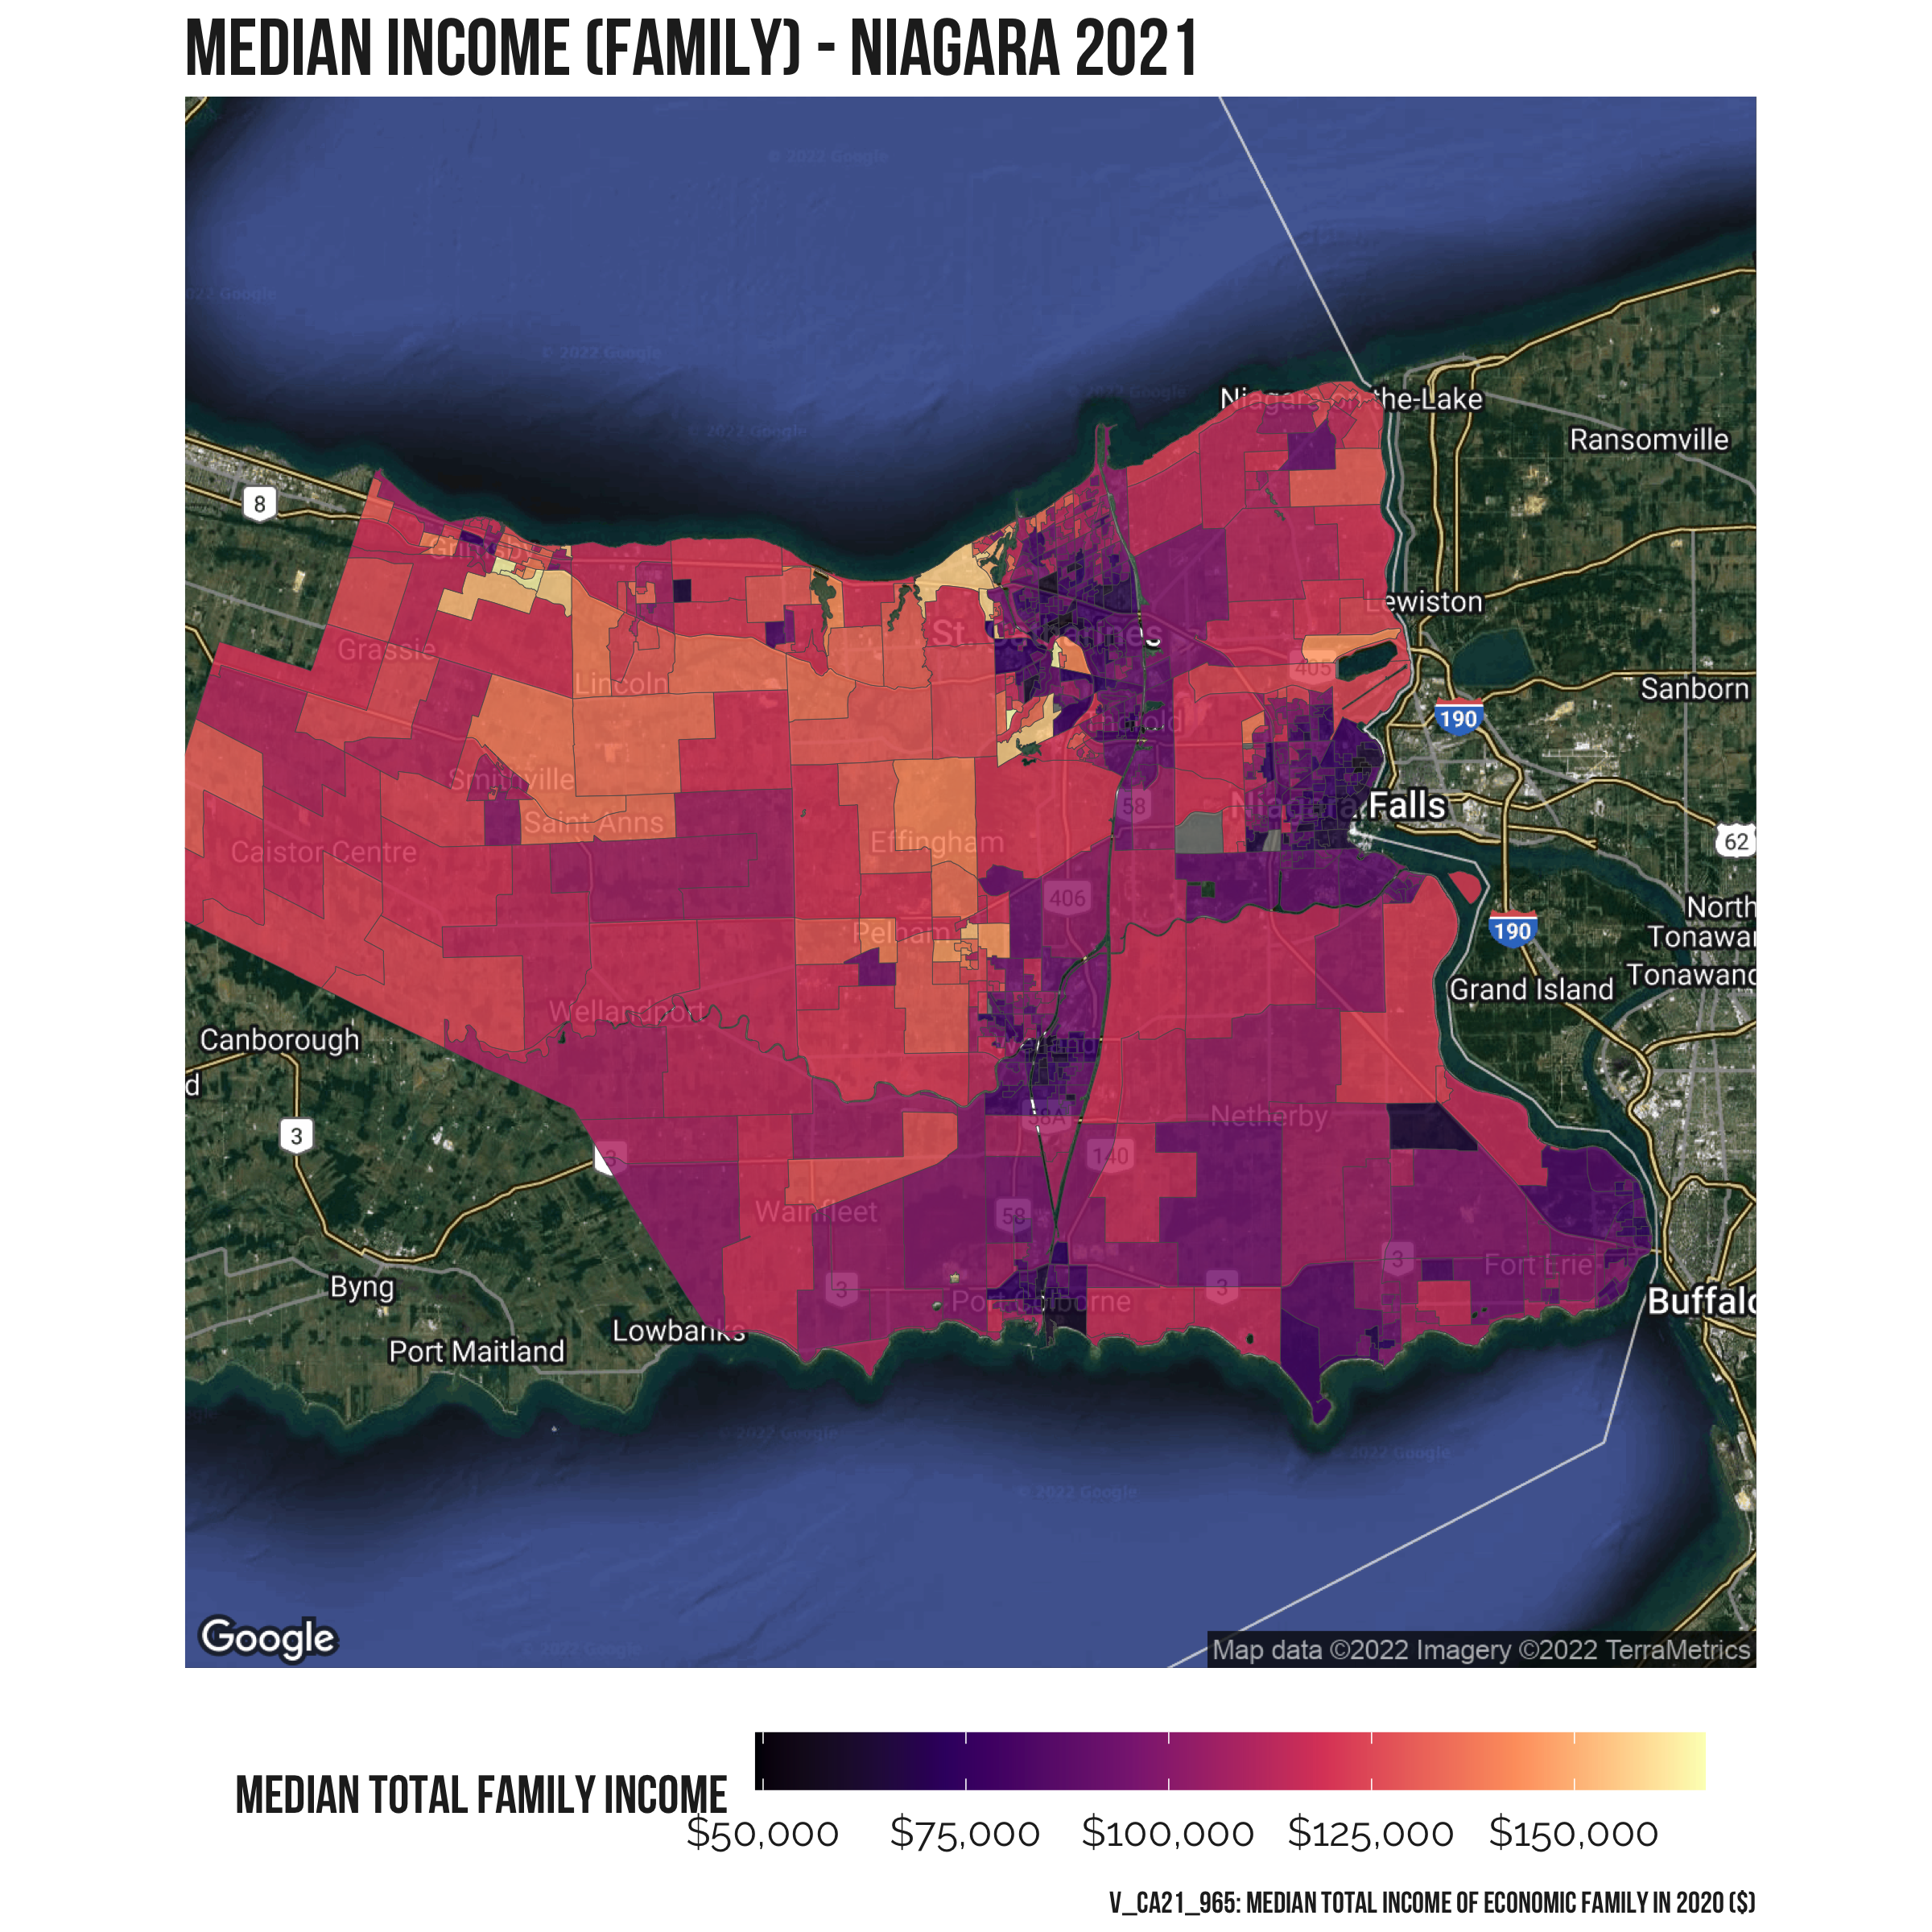
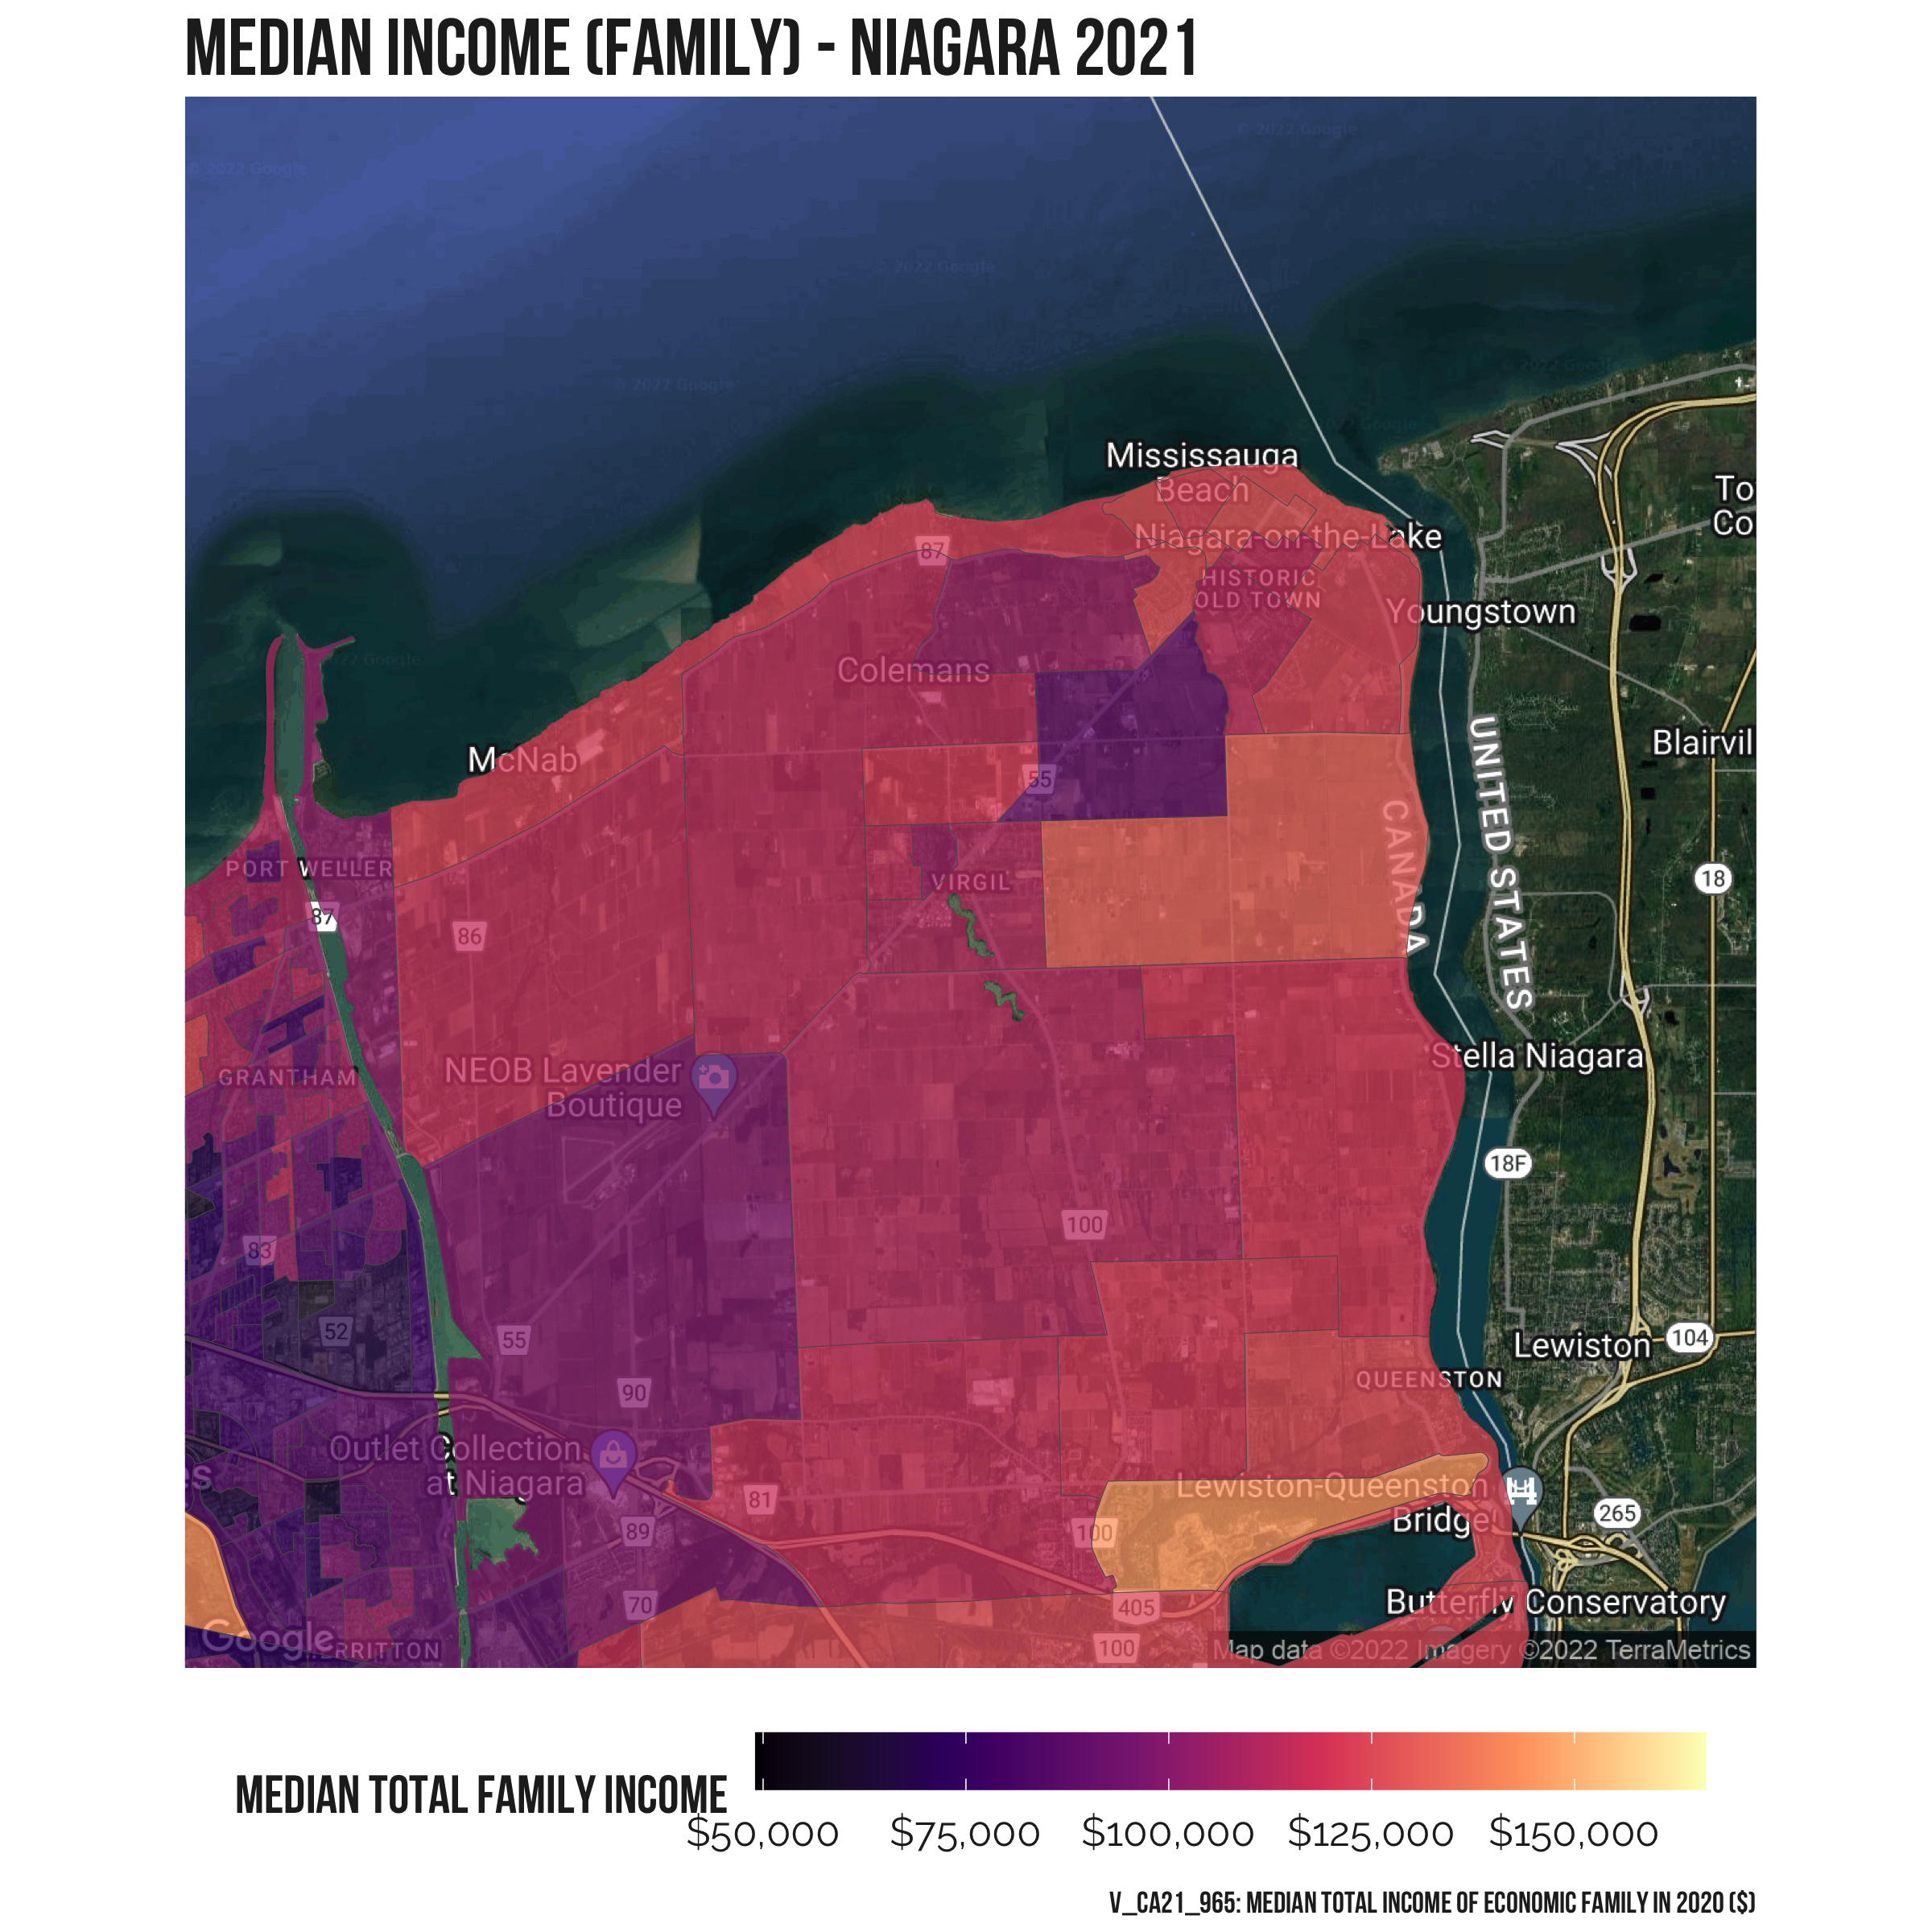
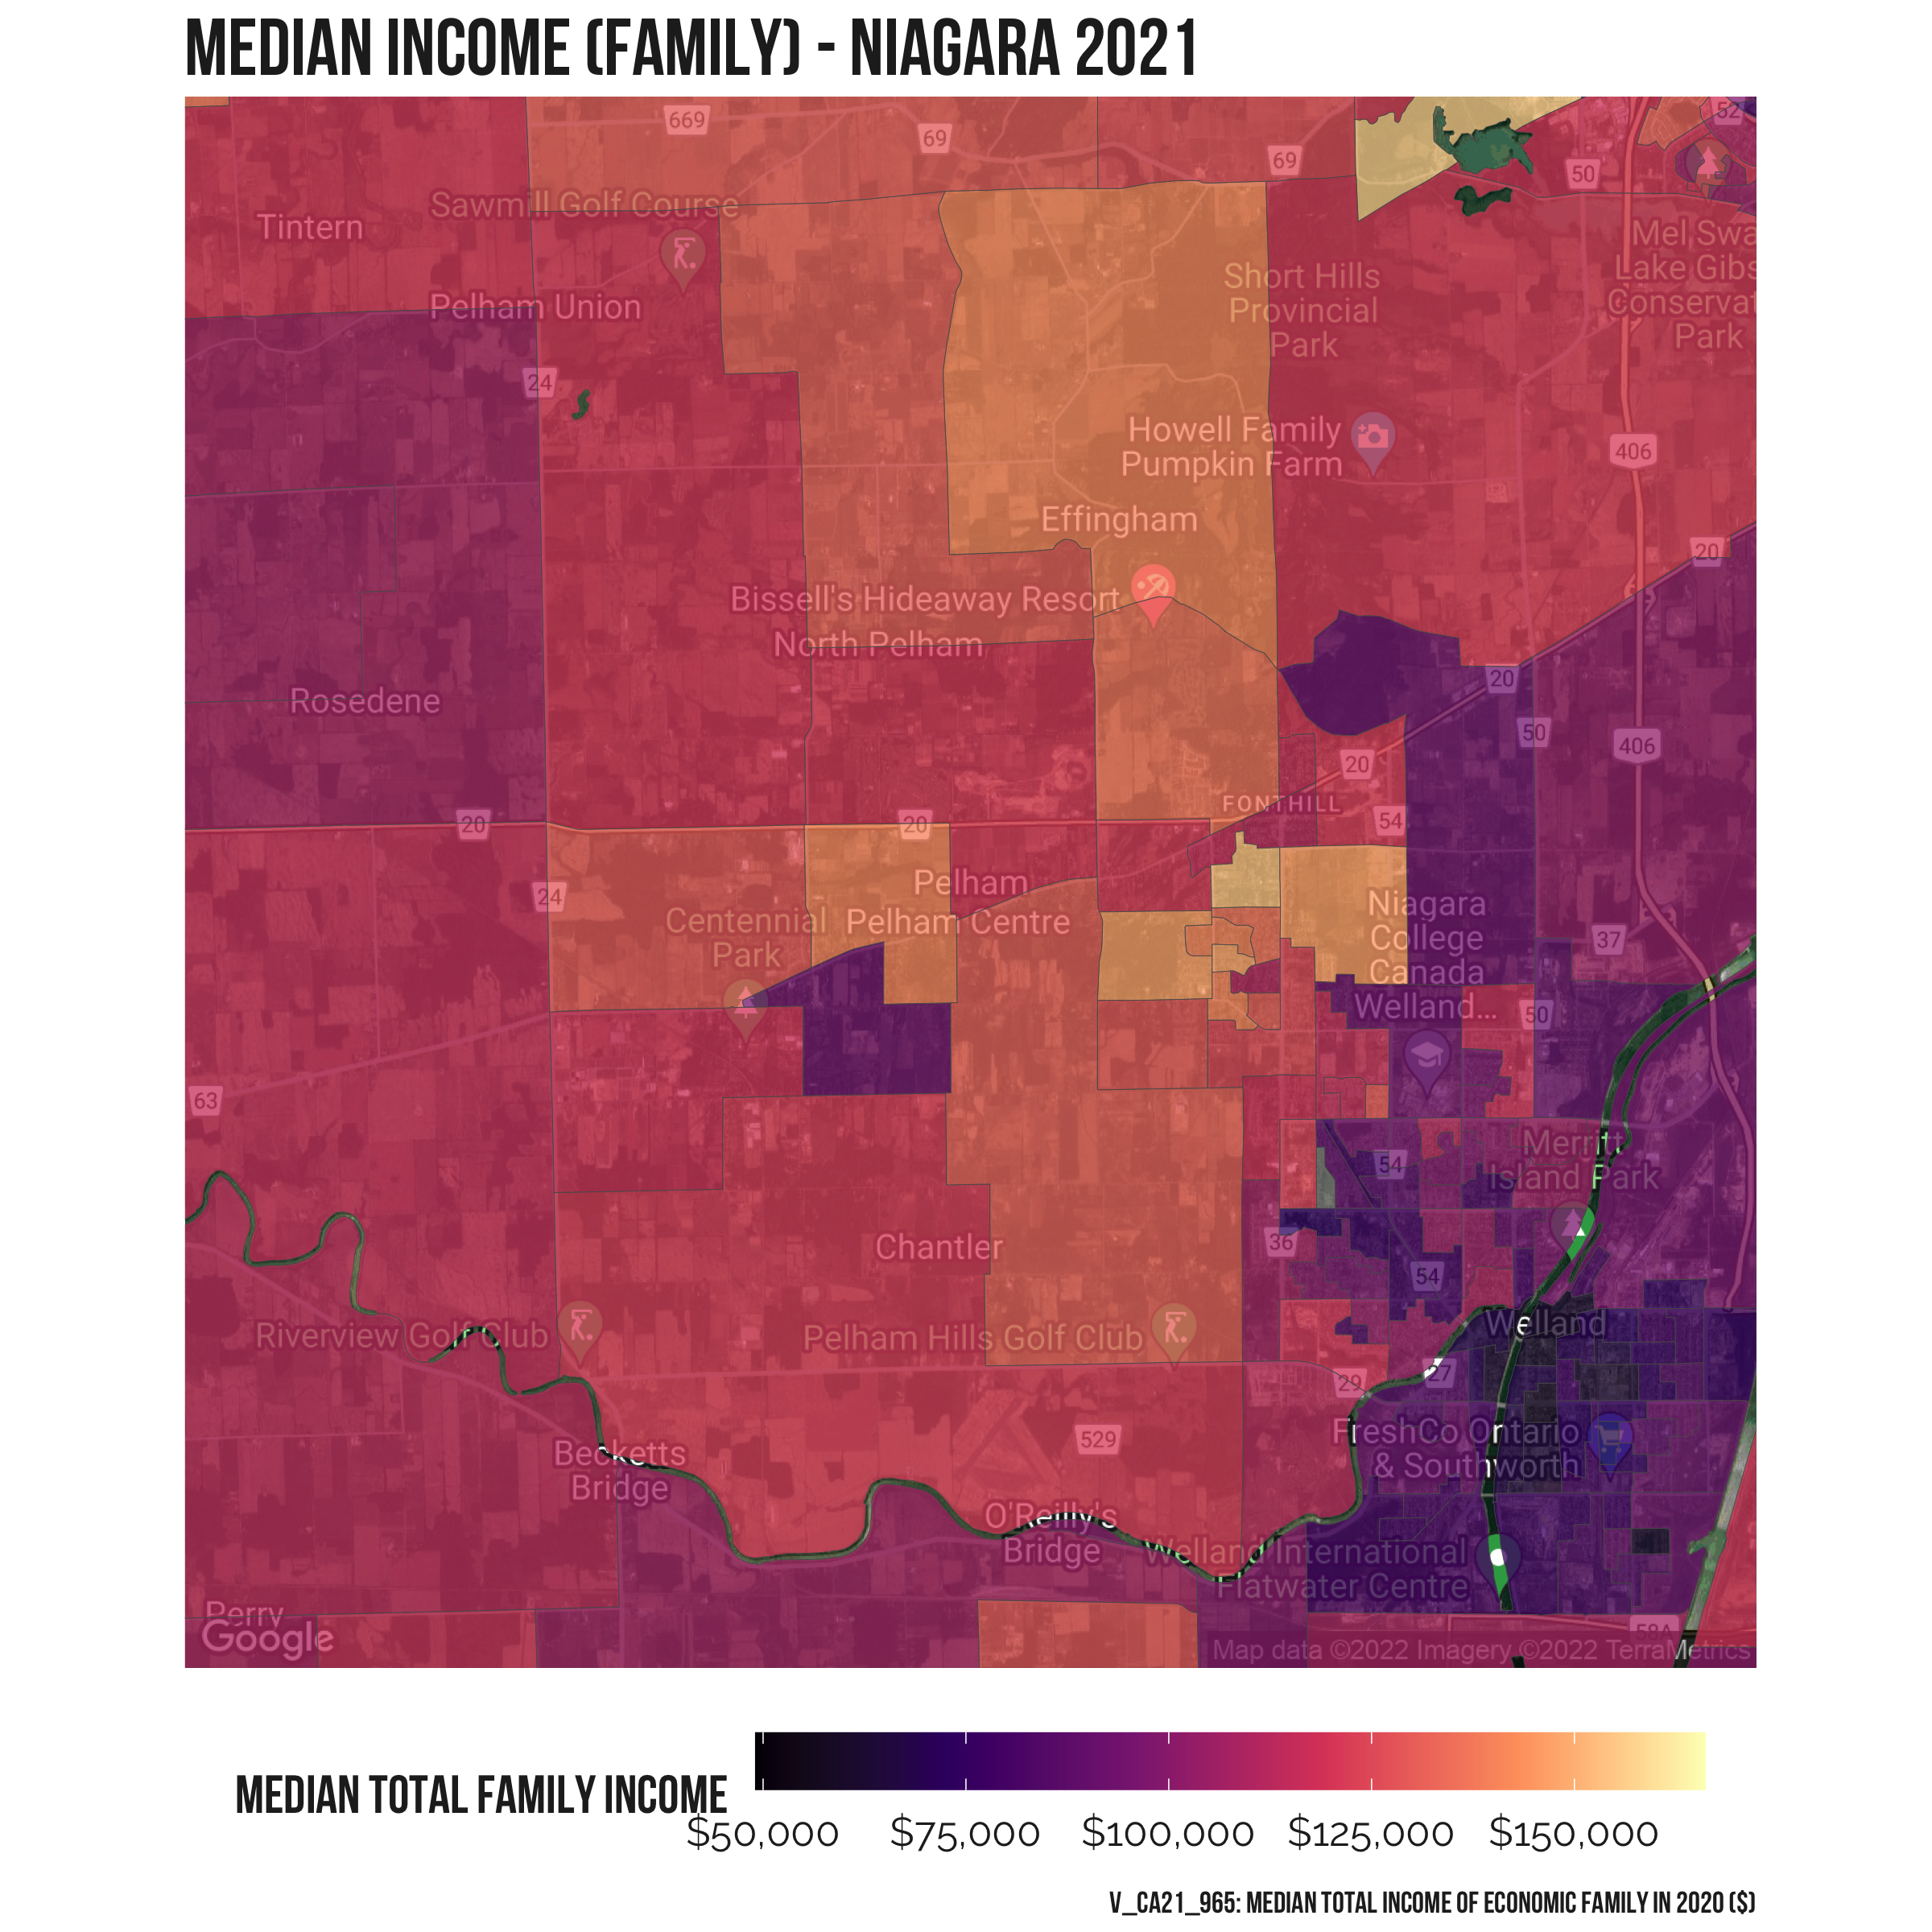
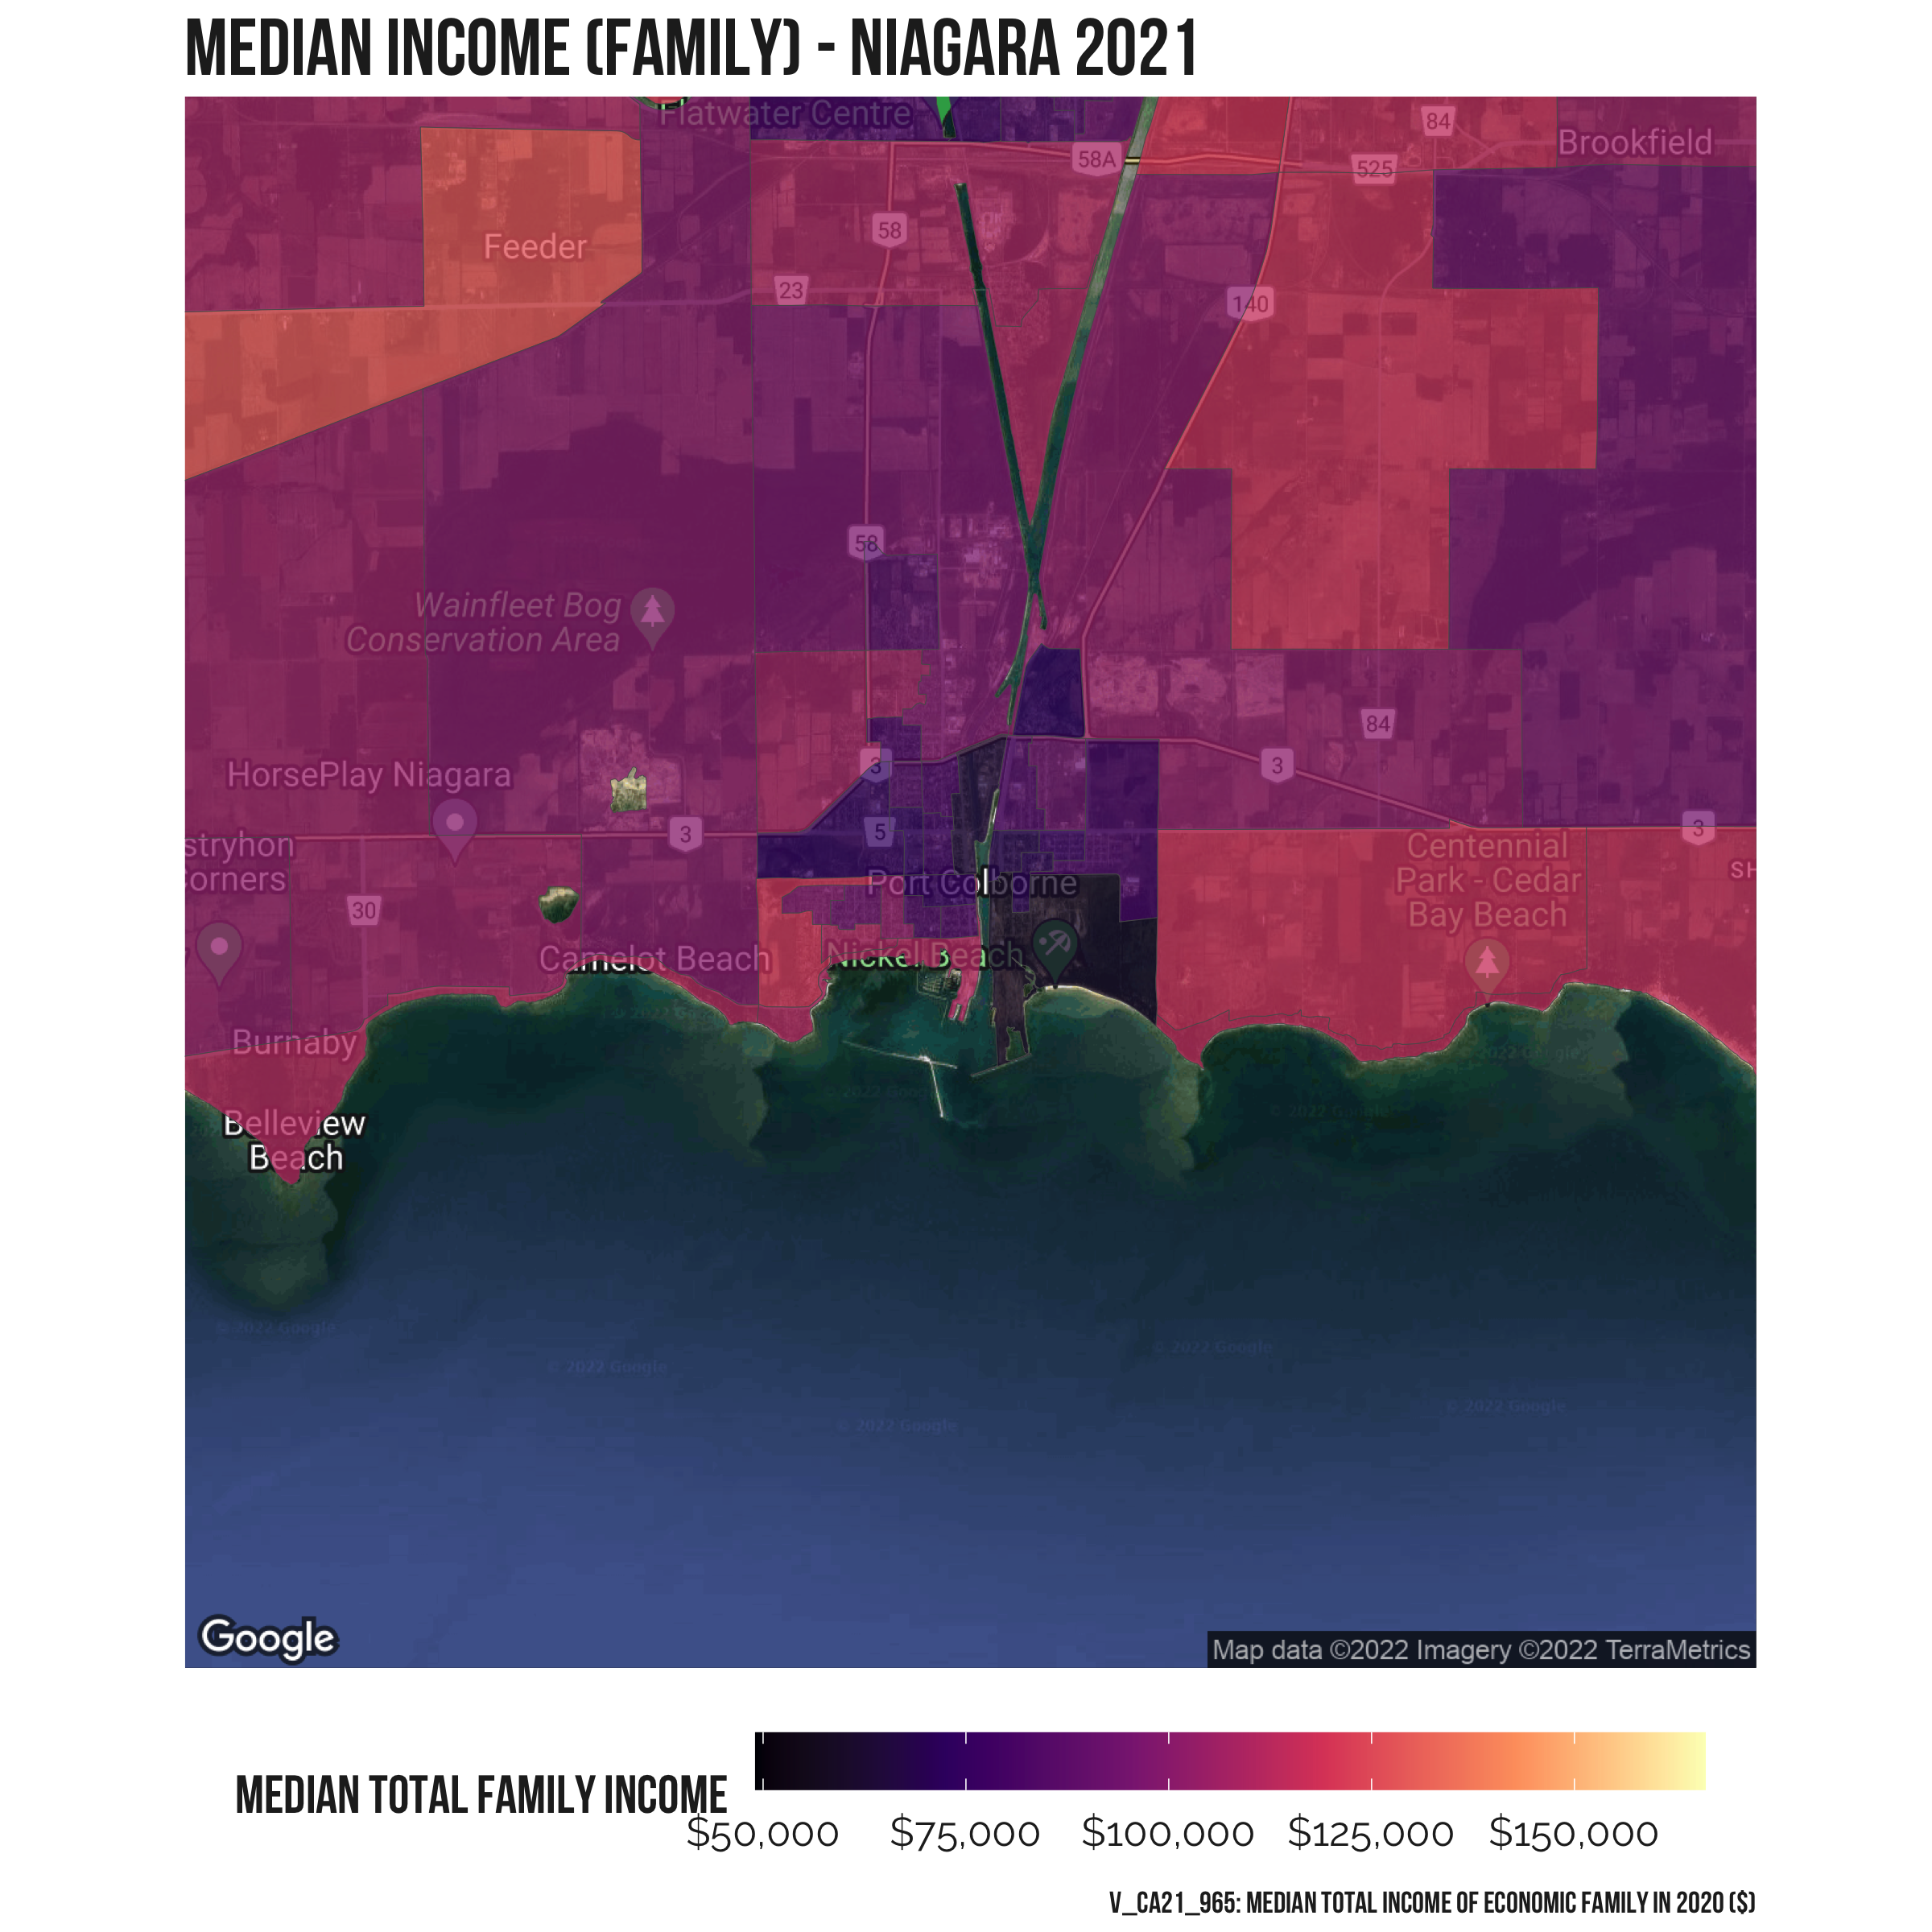
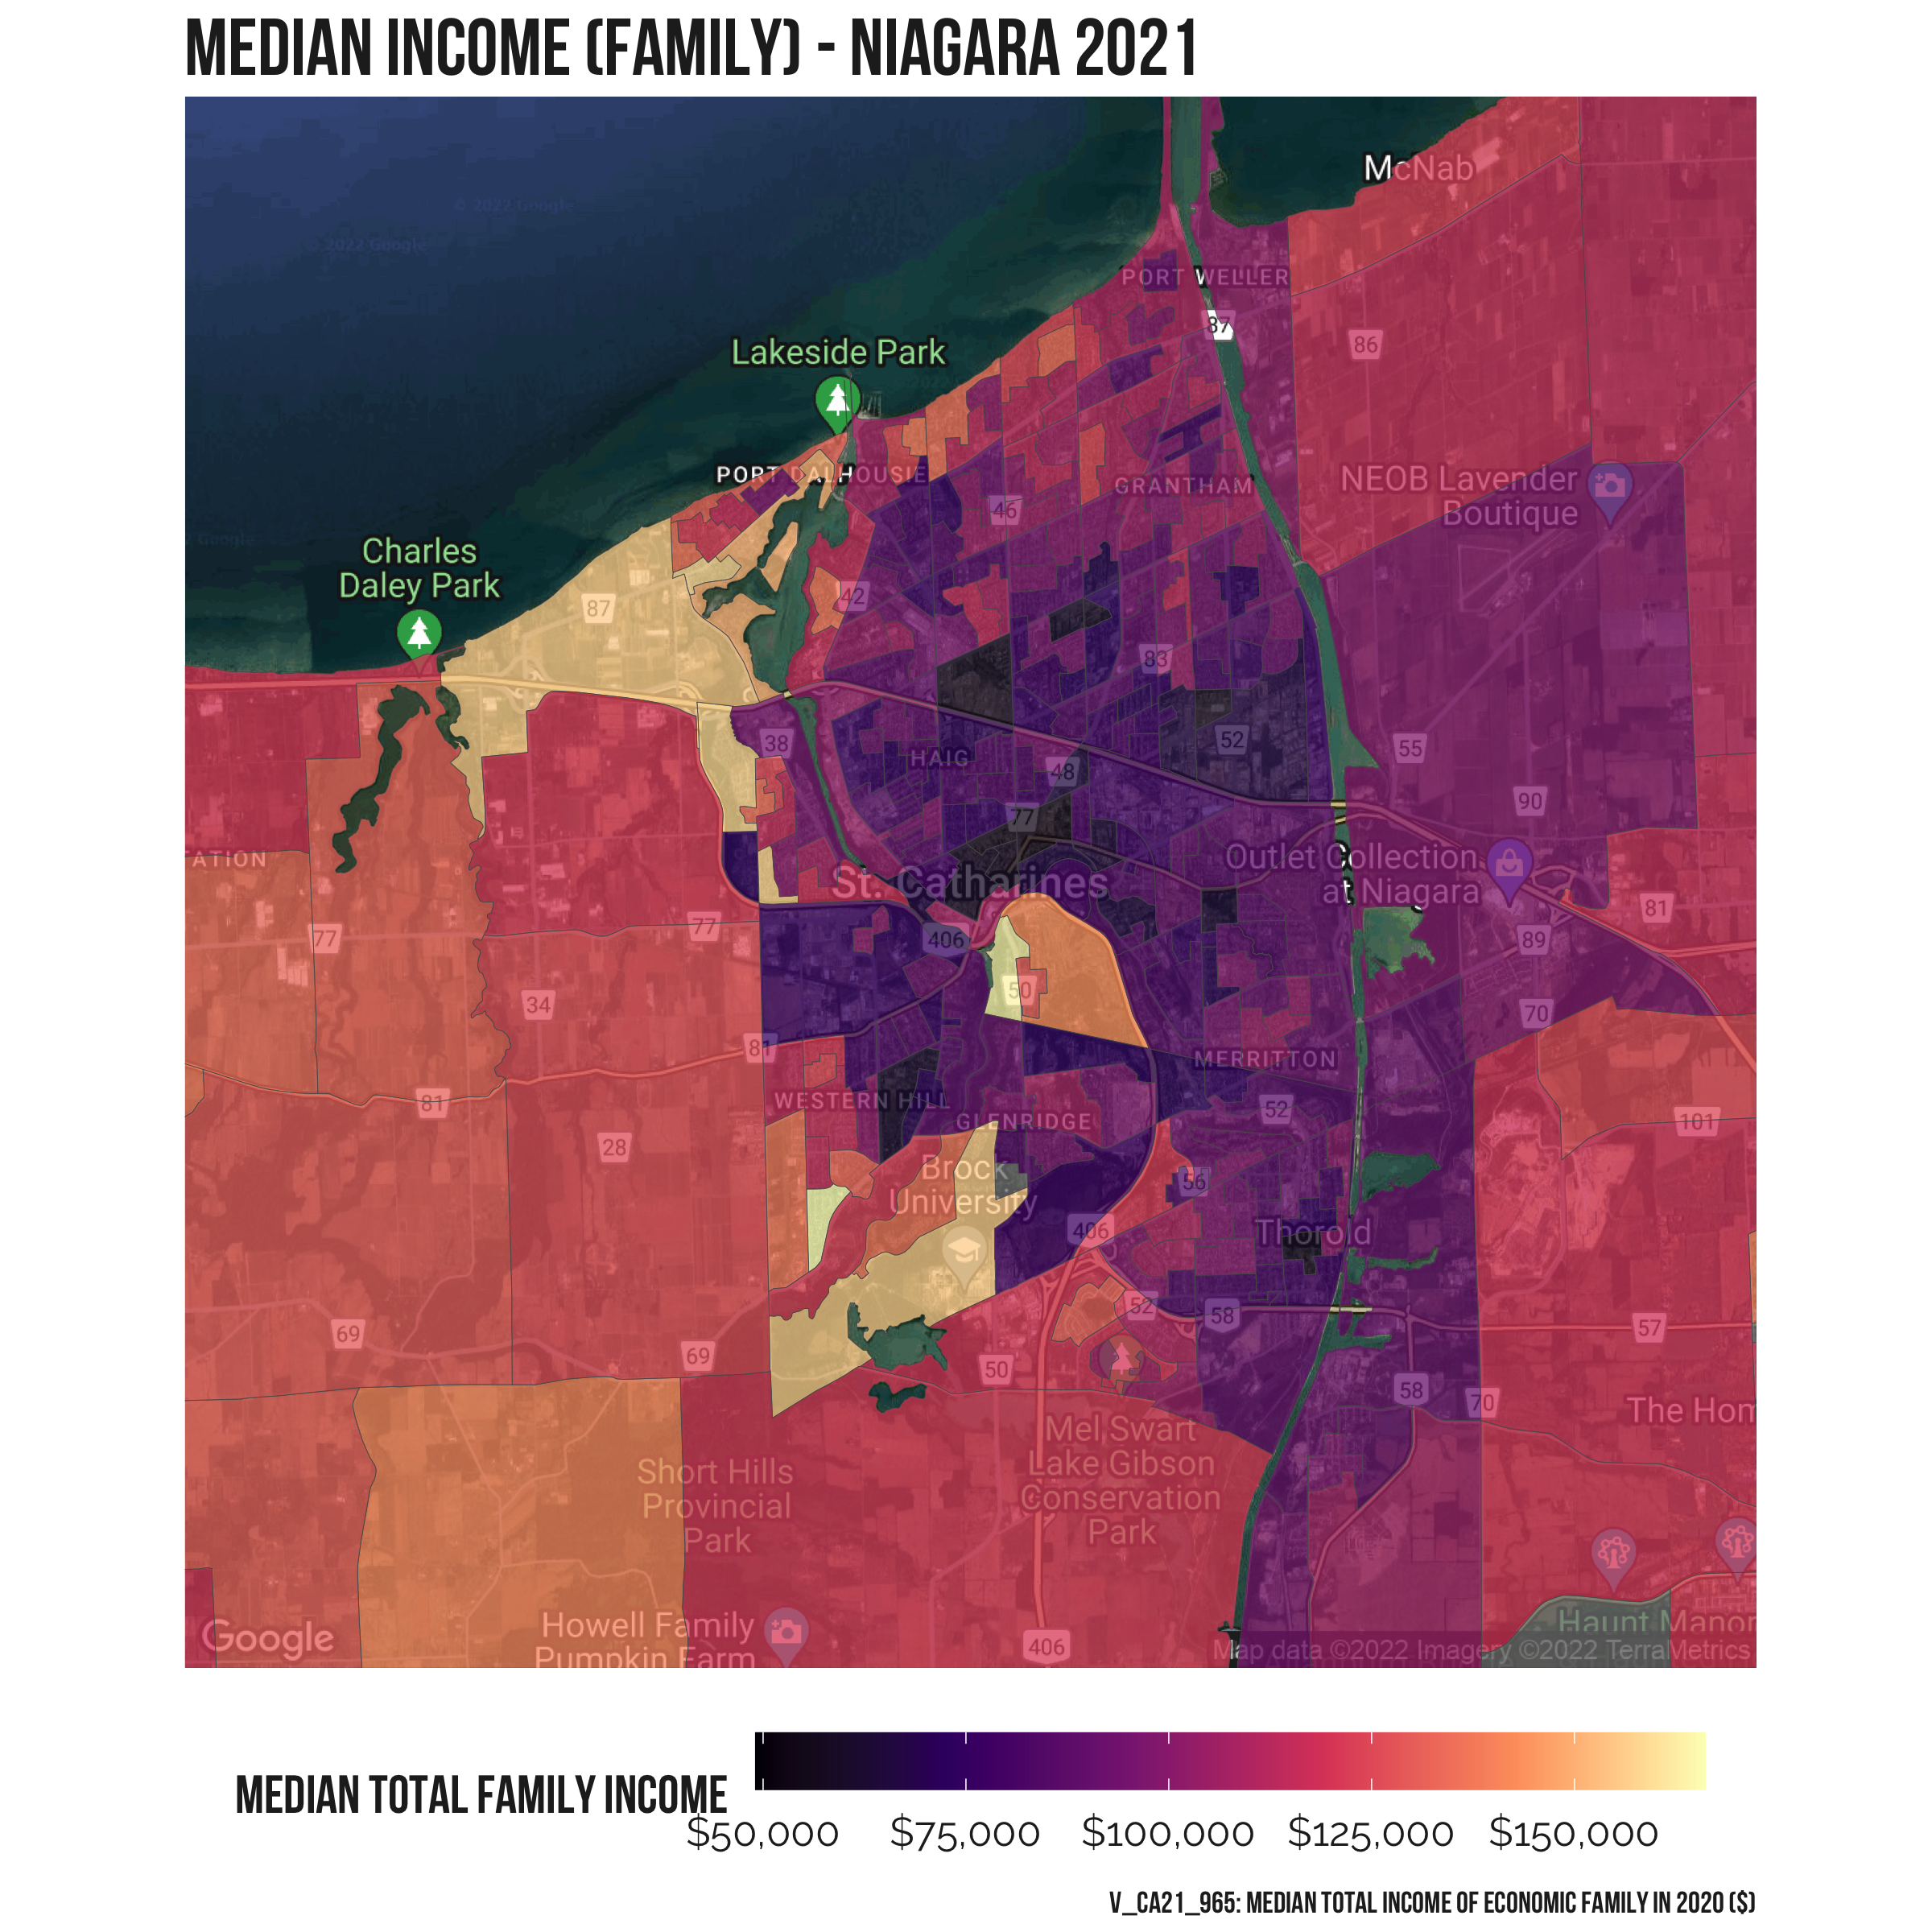
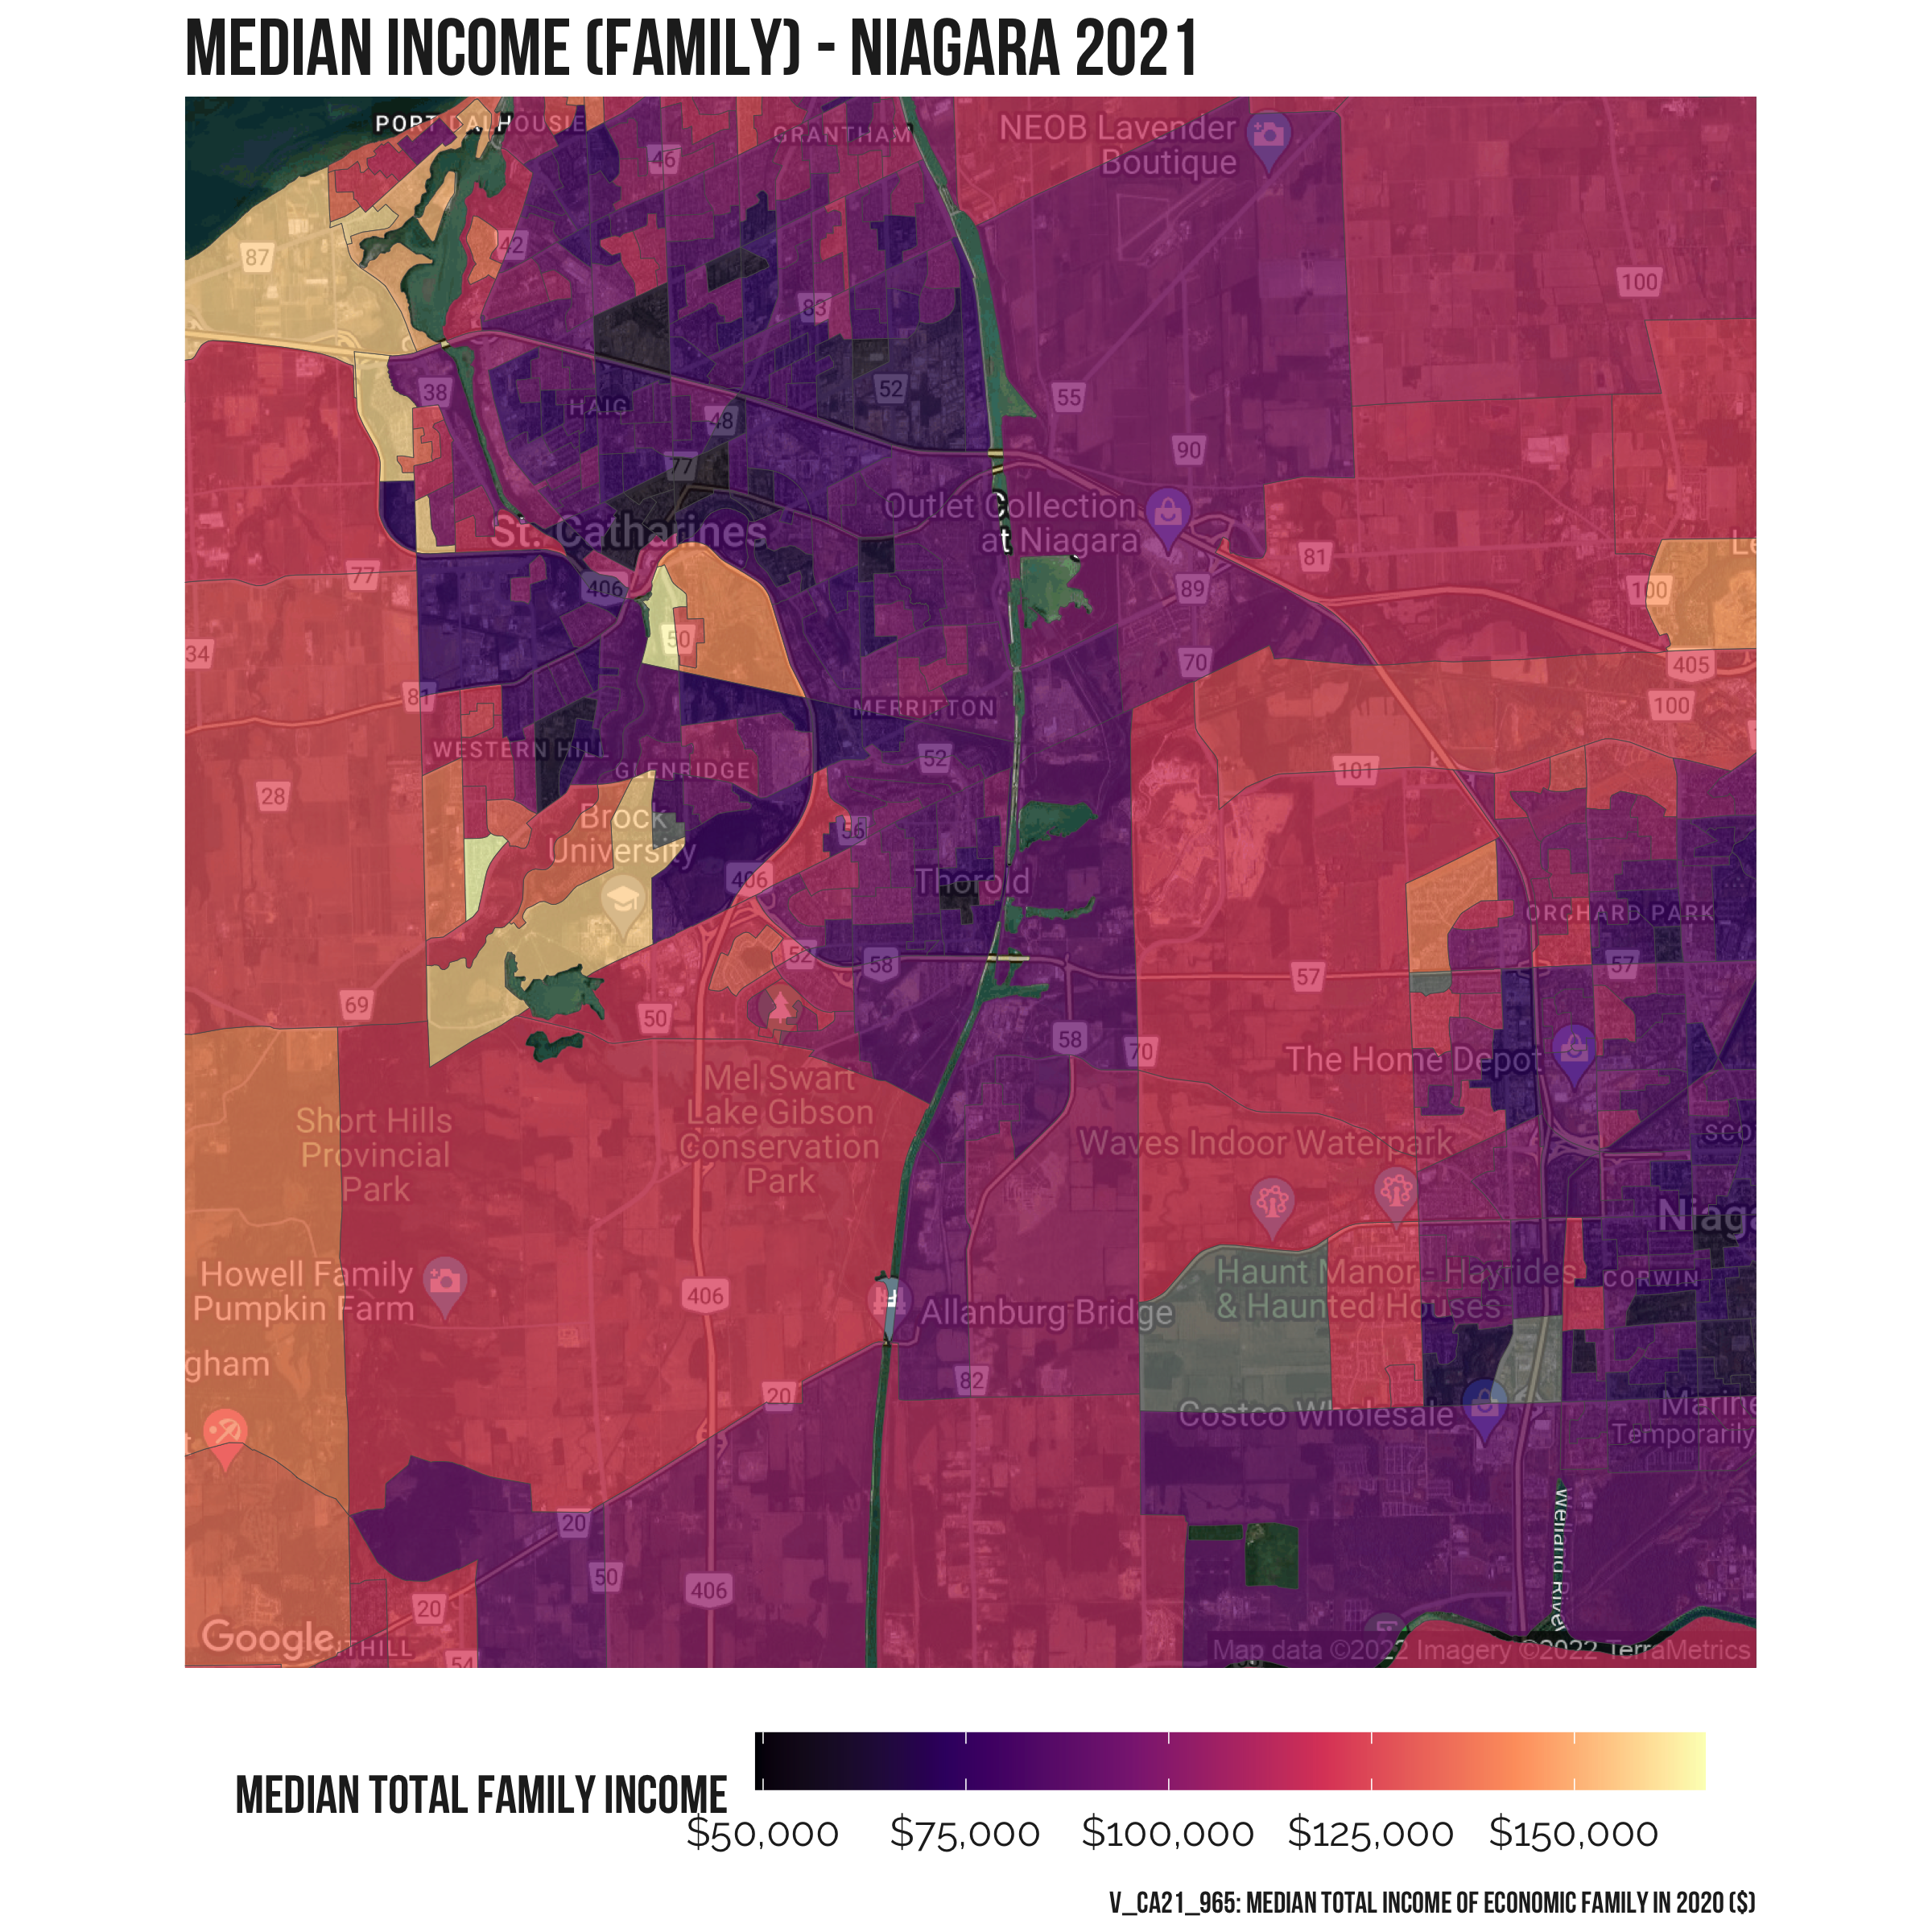
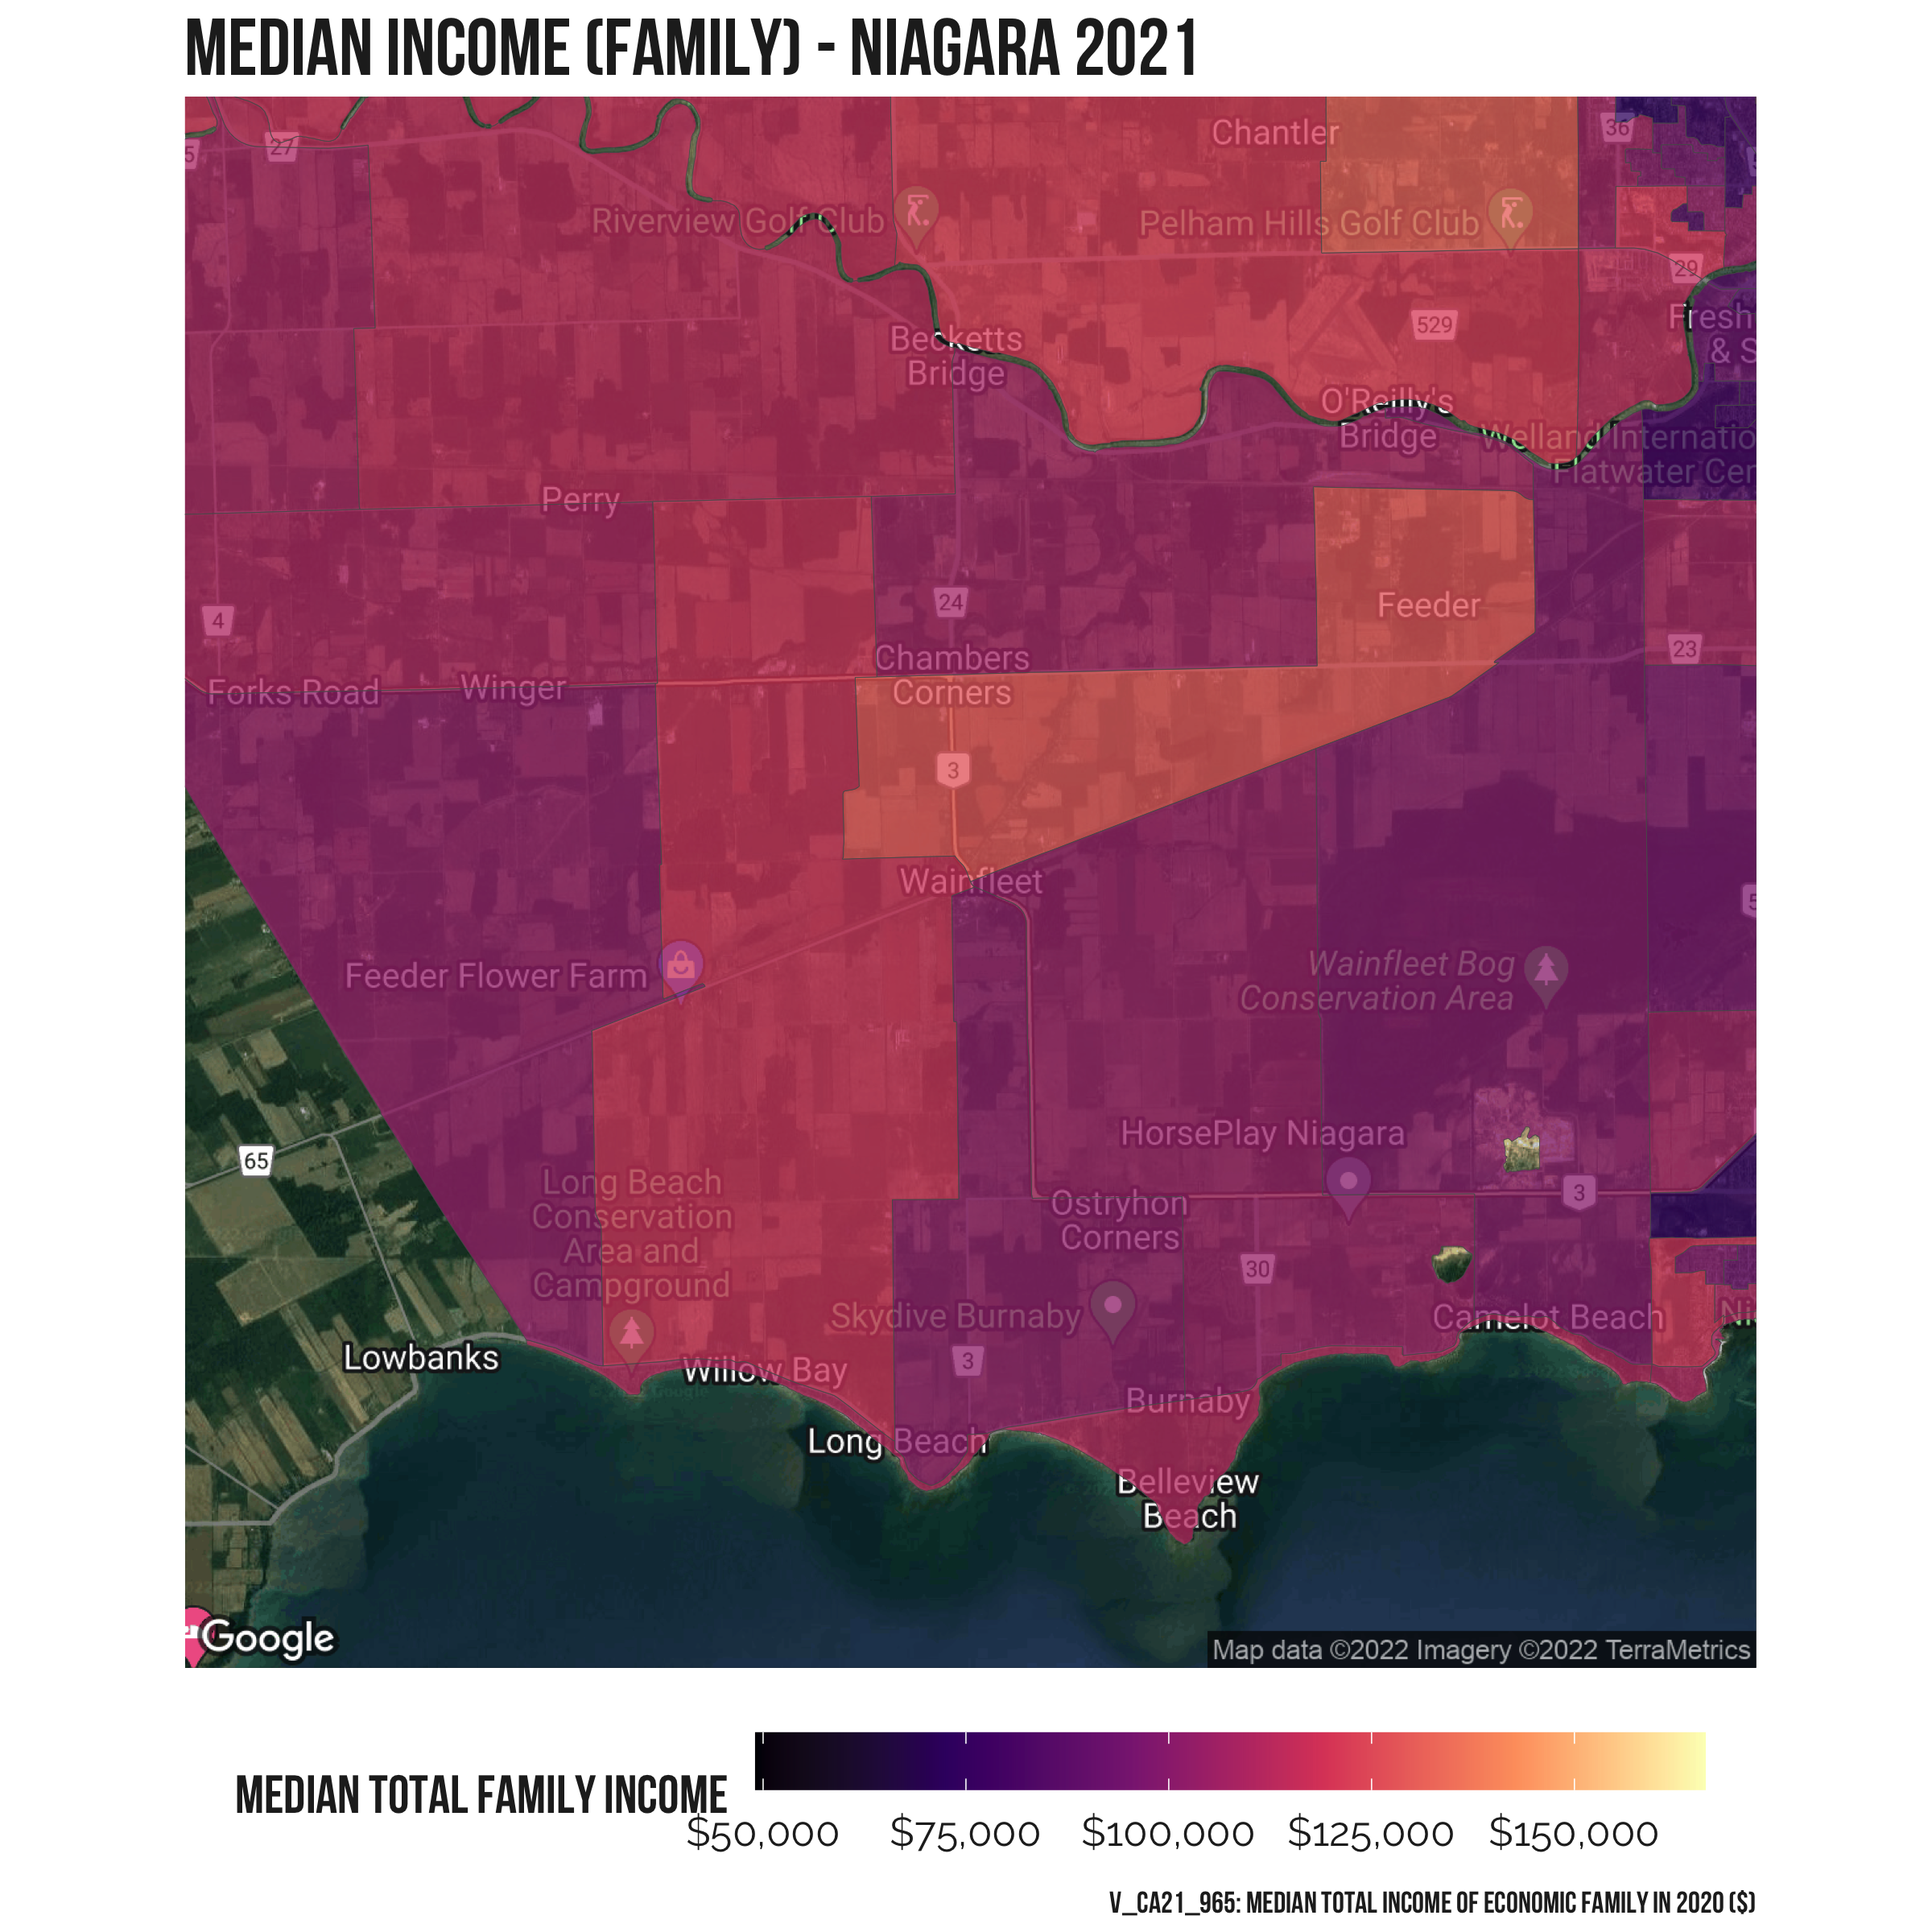
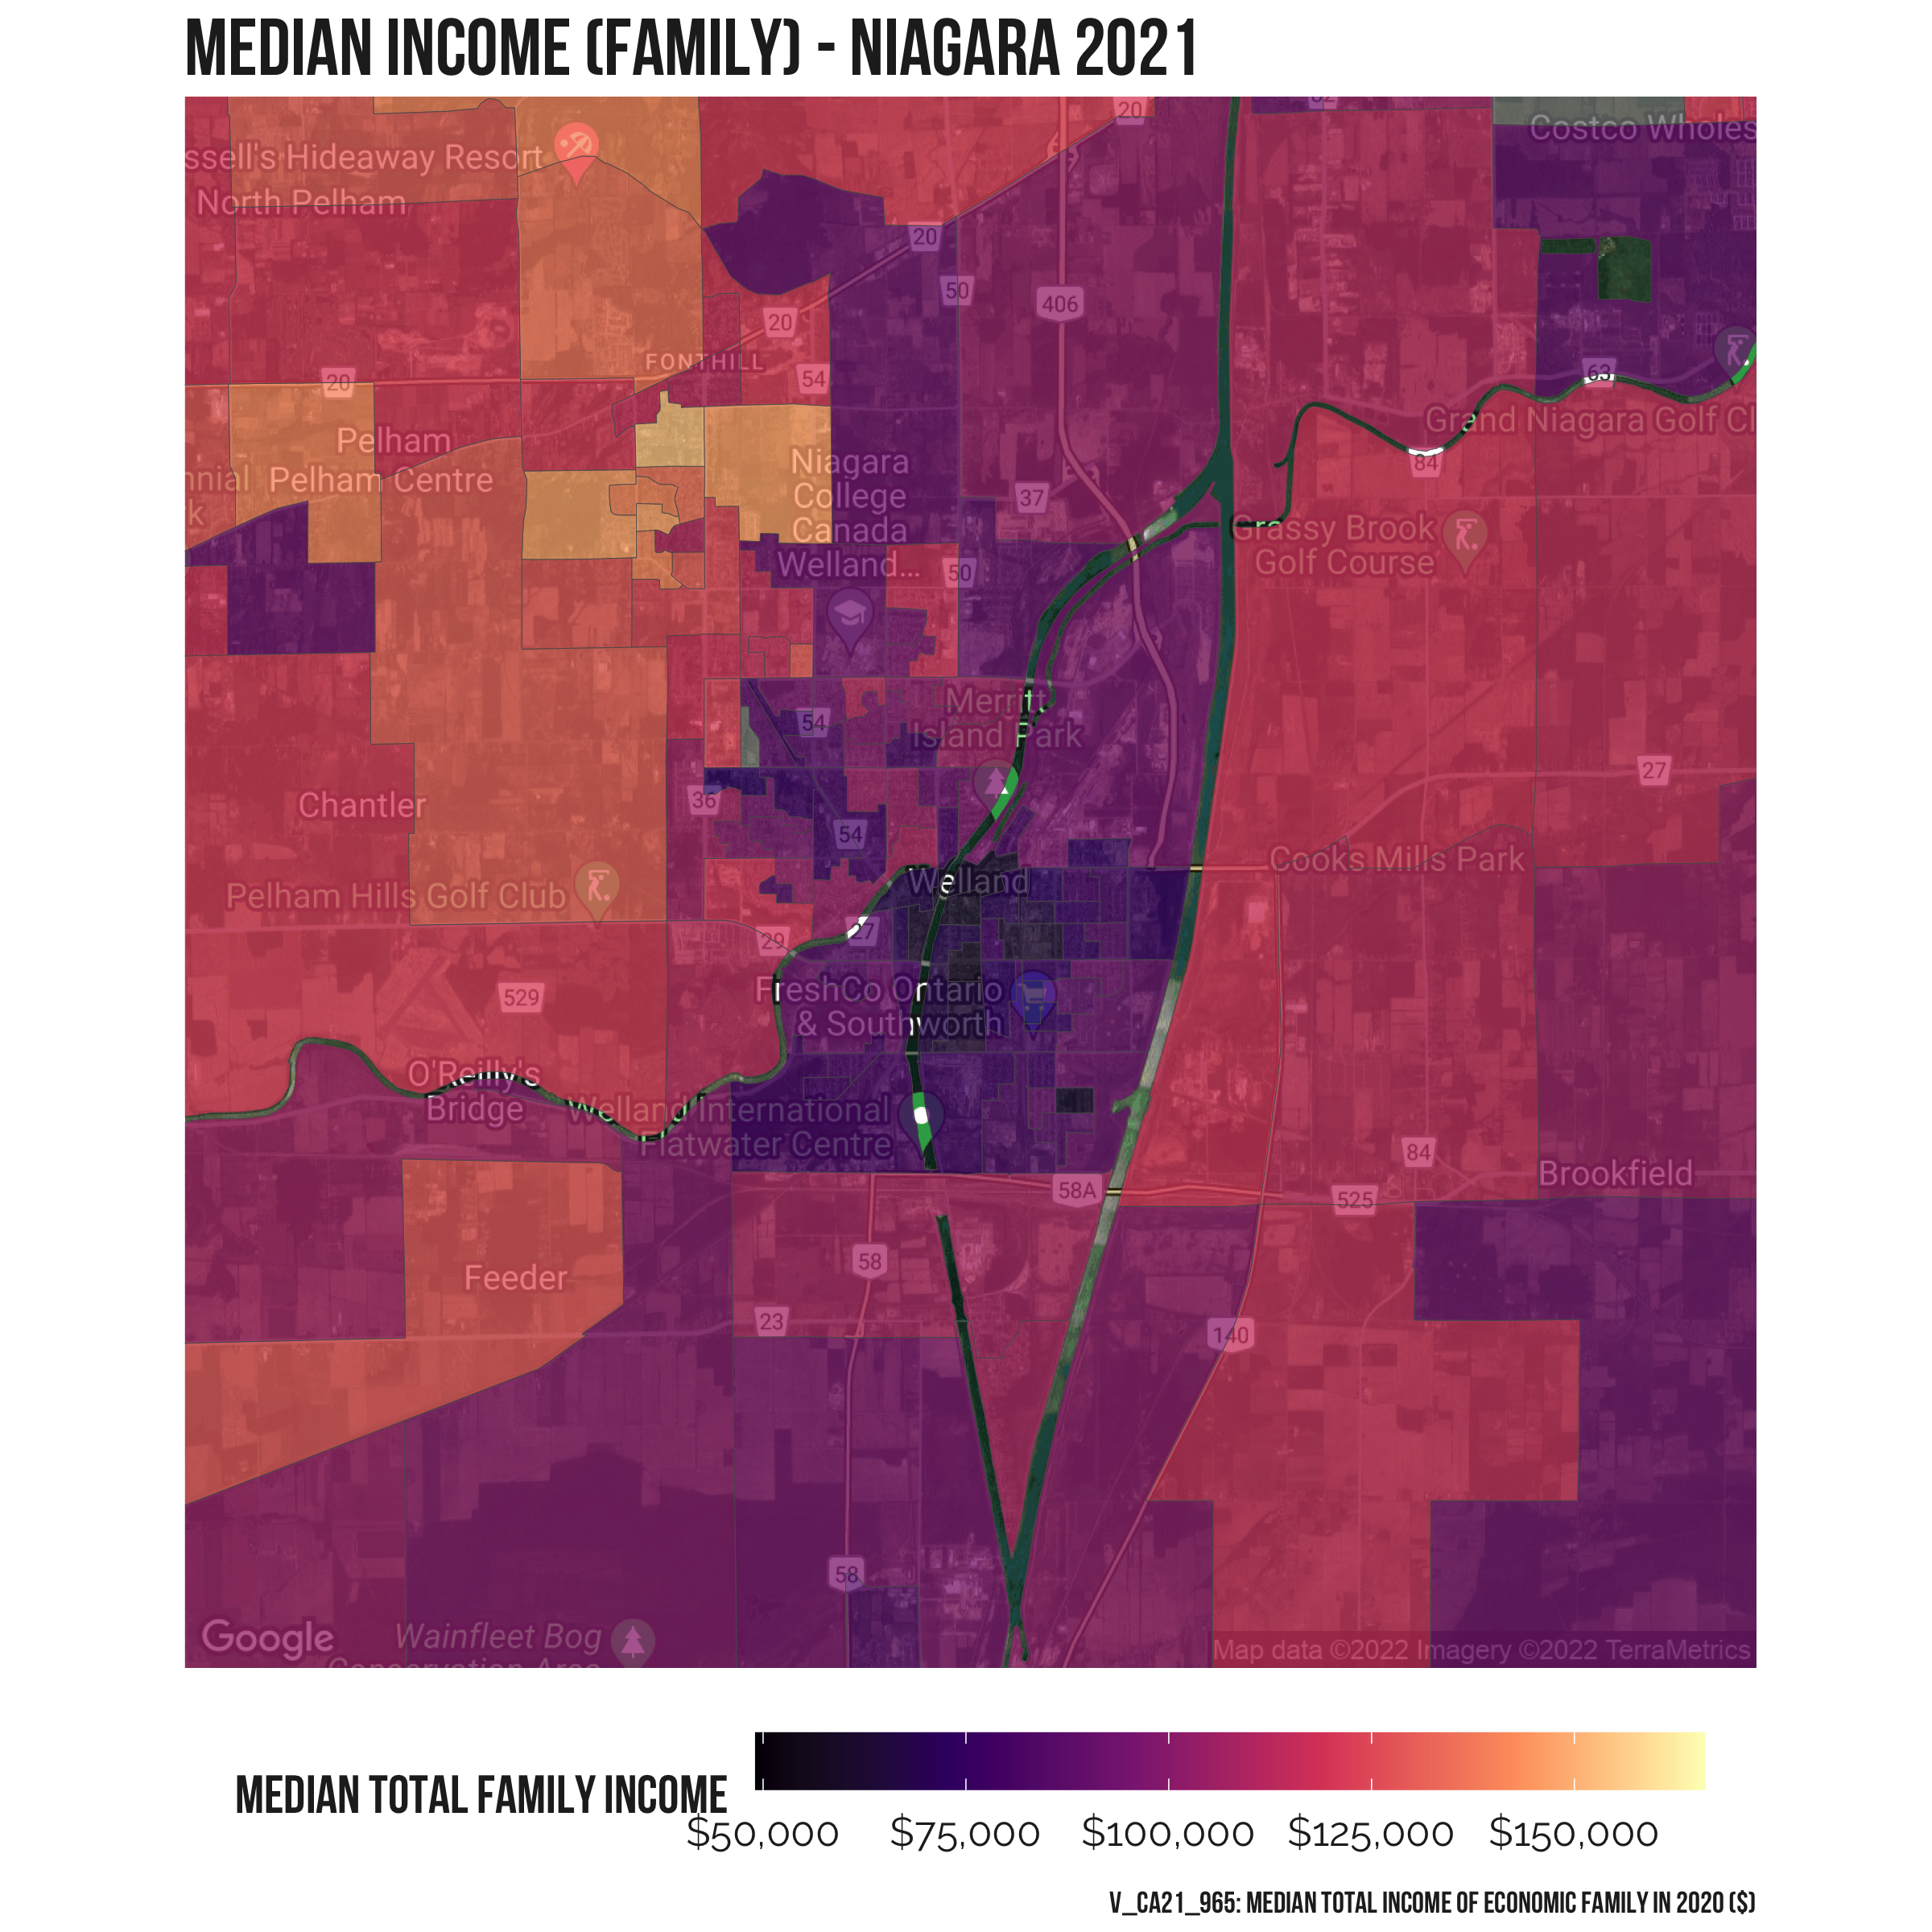
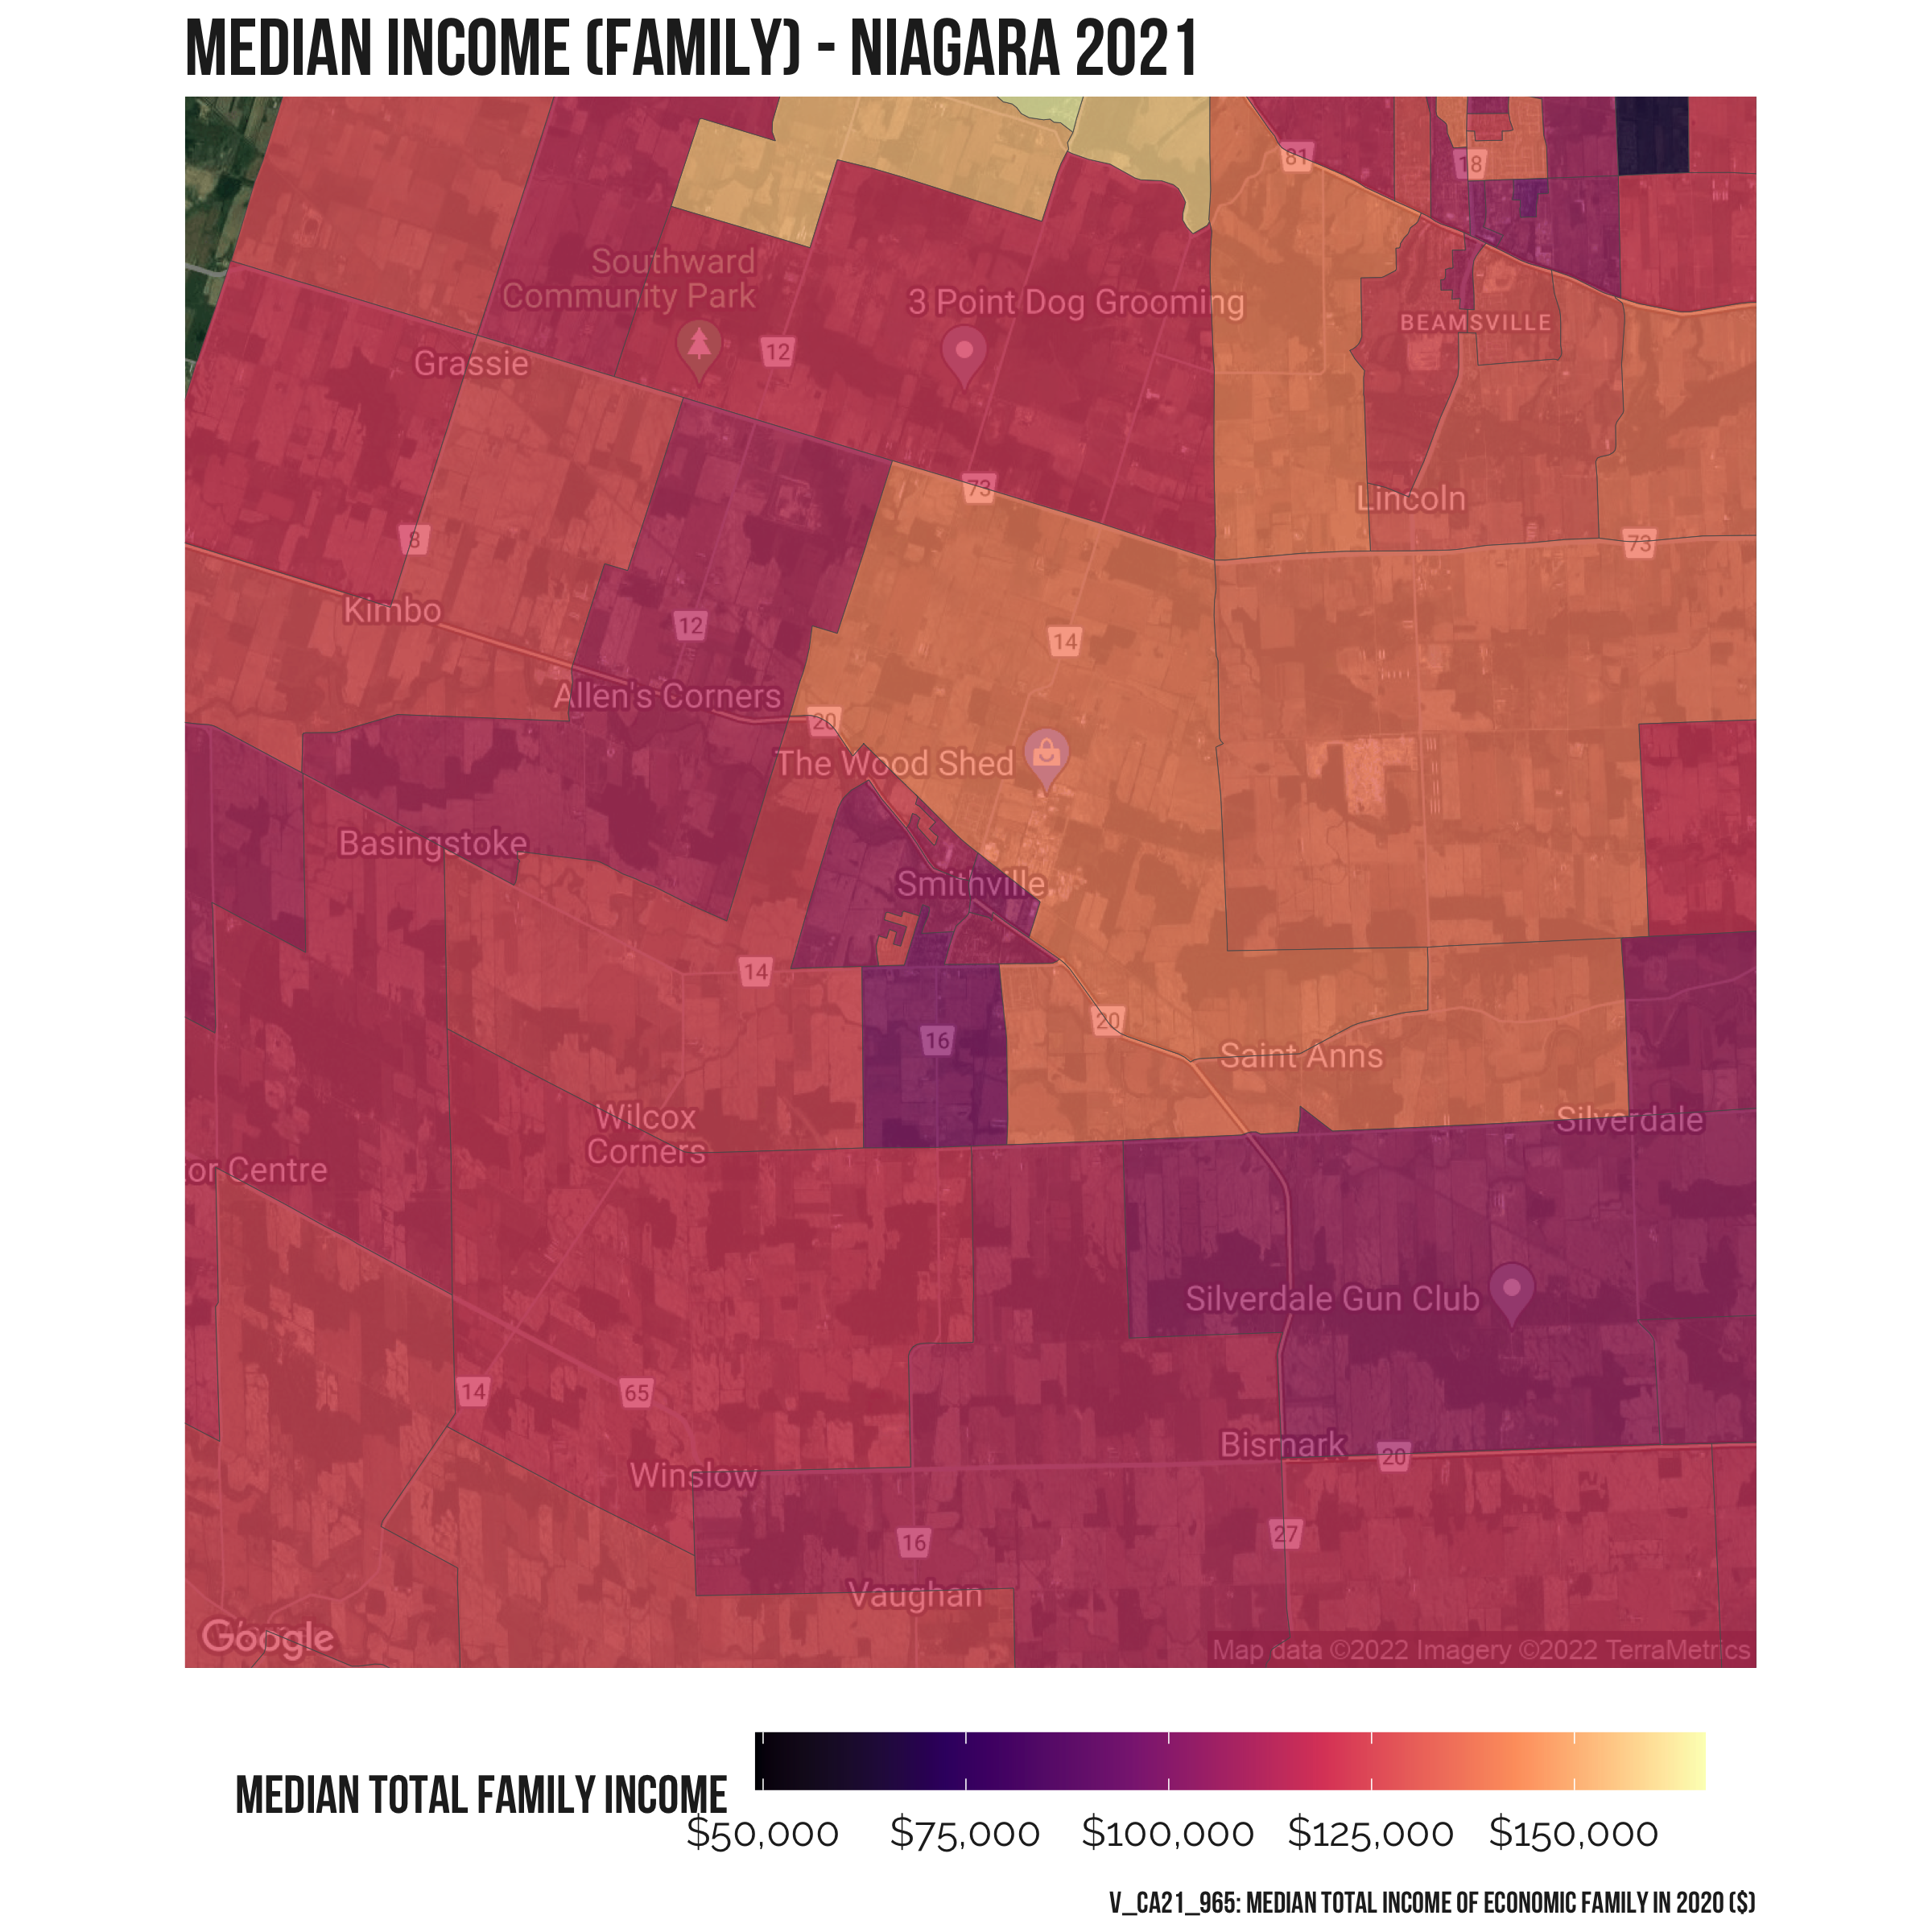
Income by dissemination area
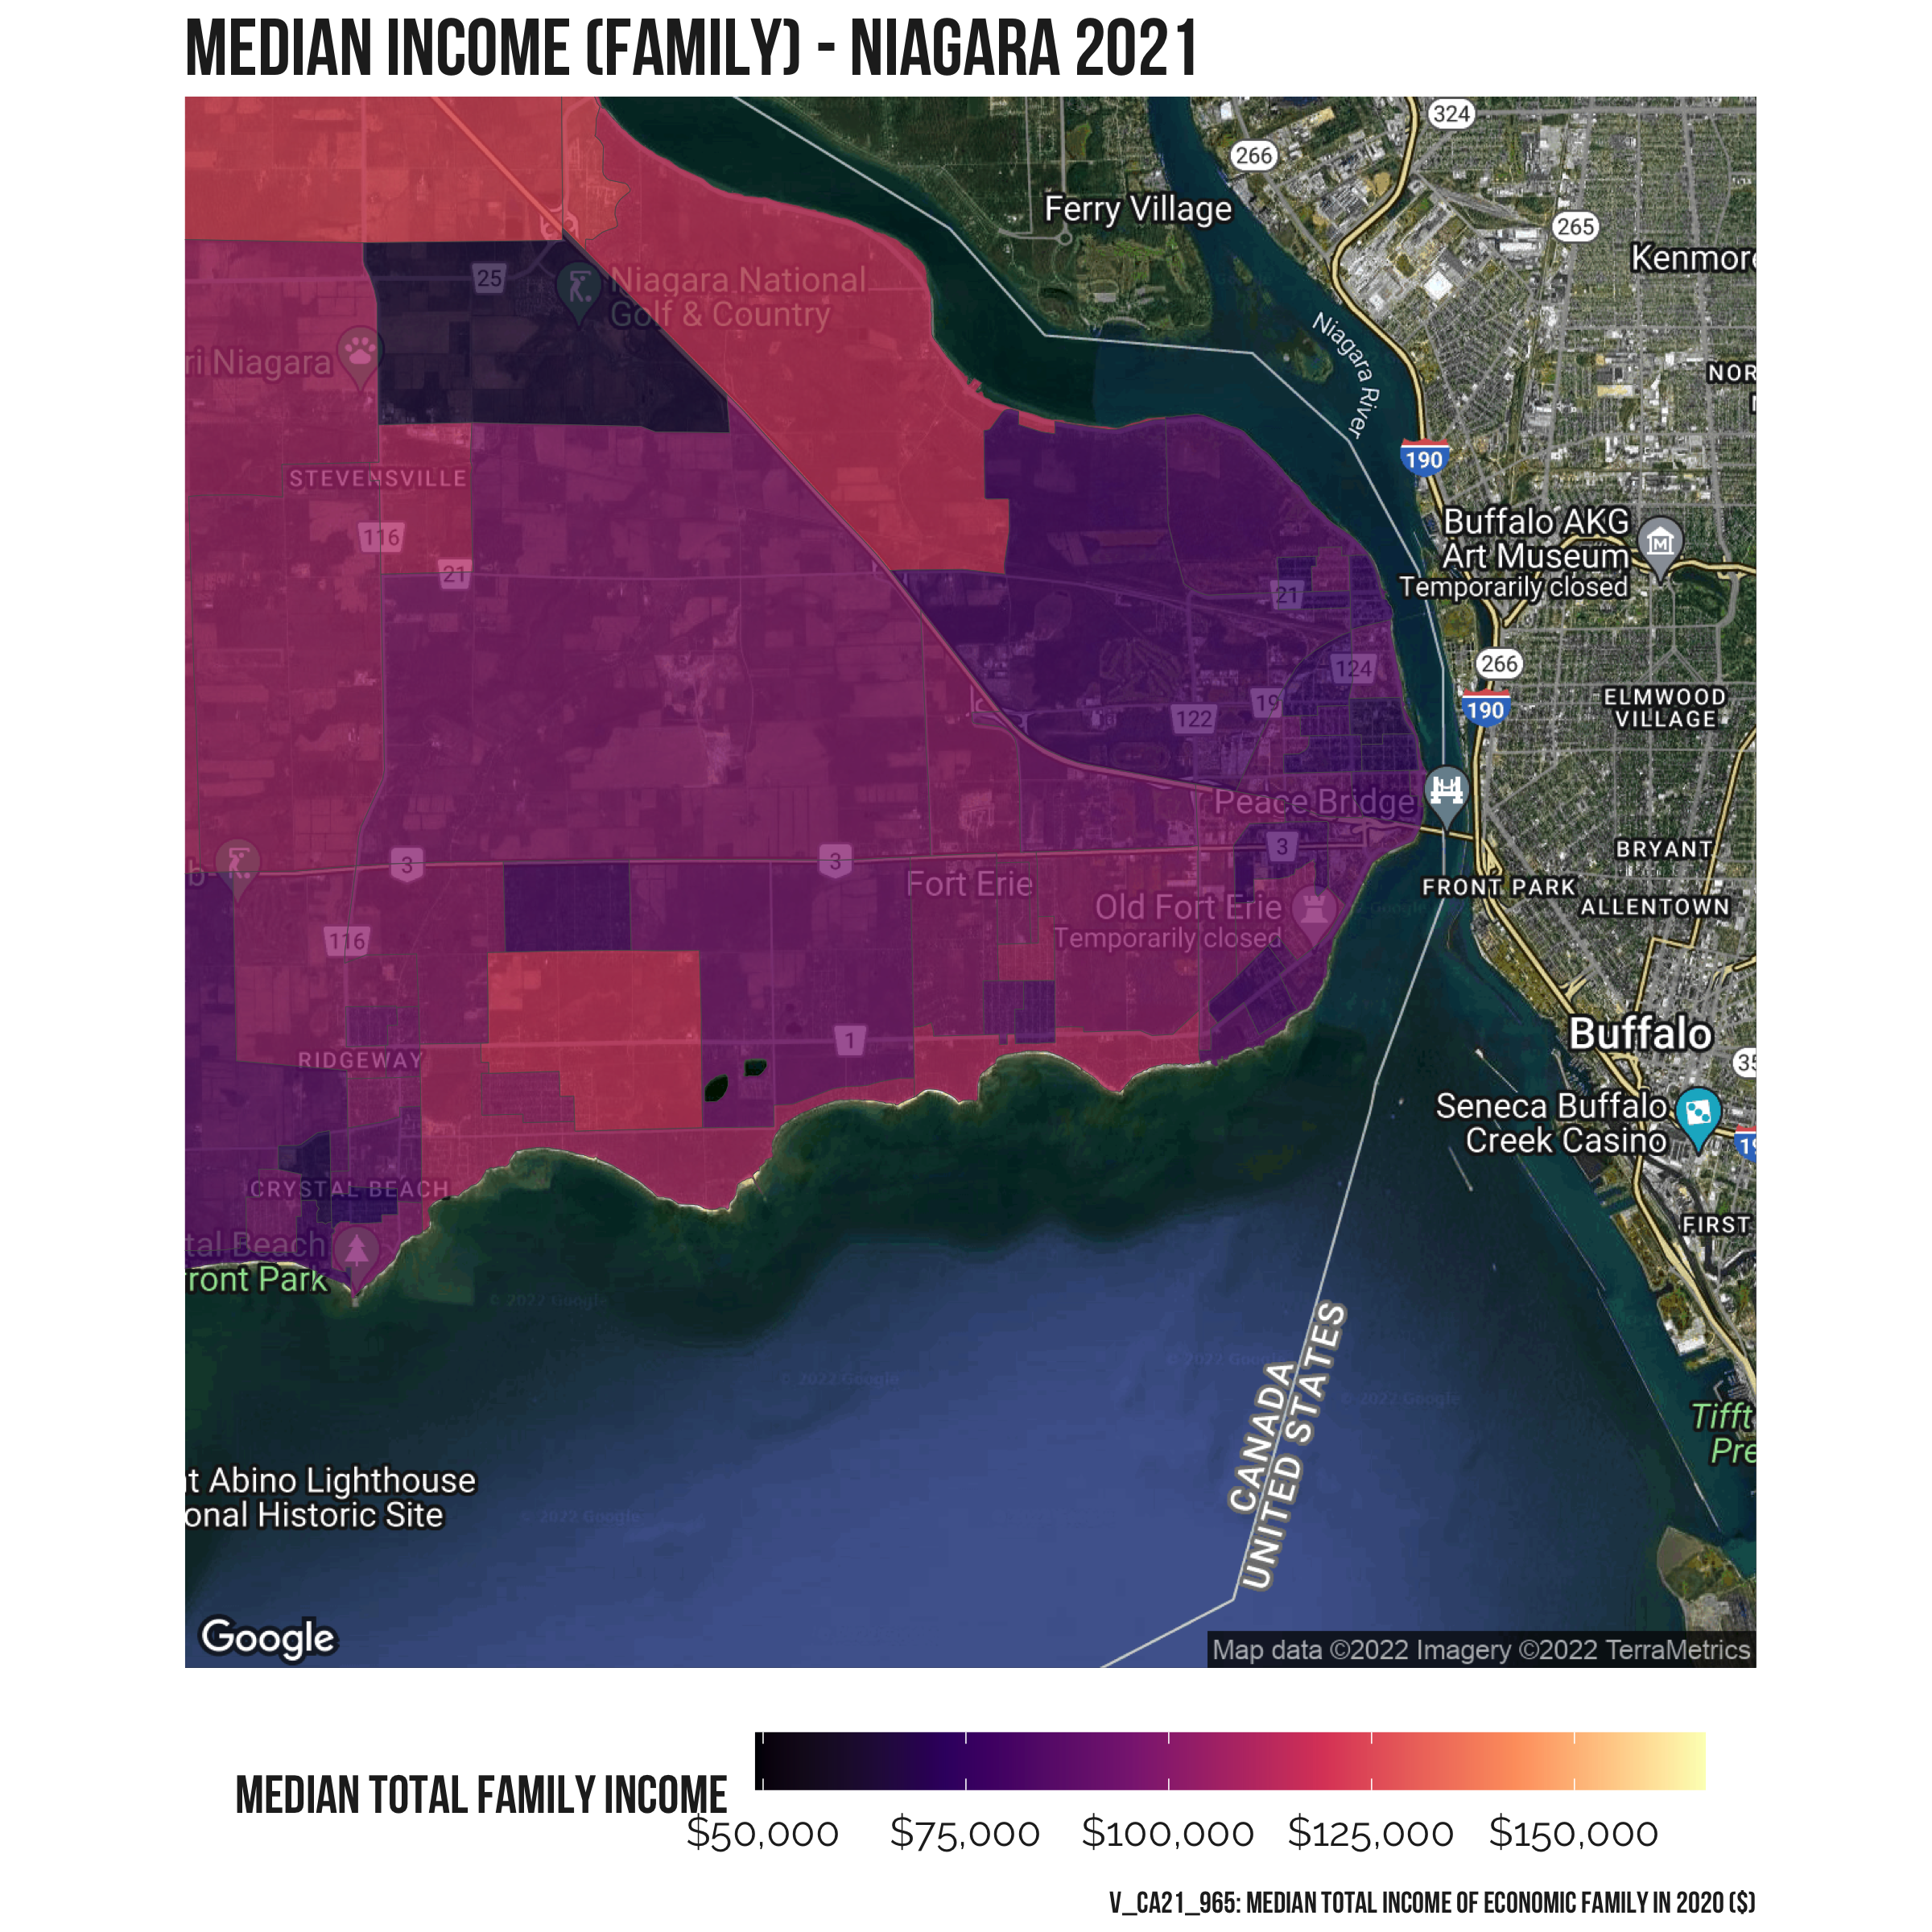
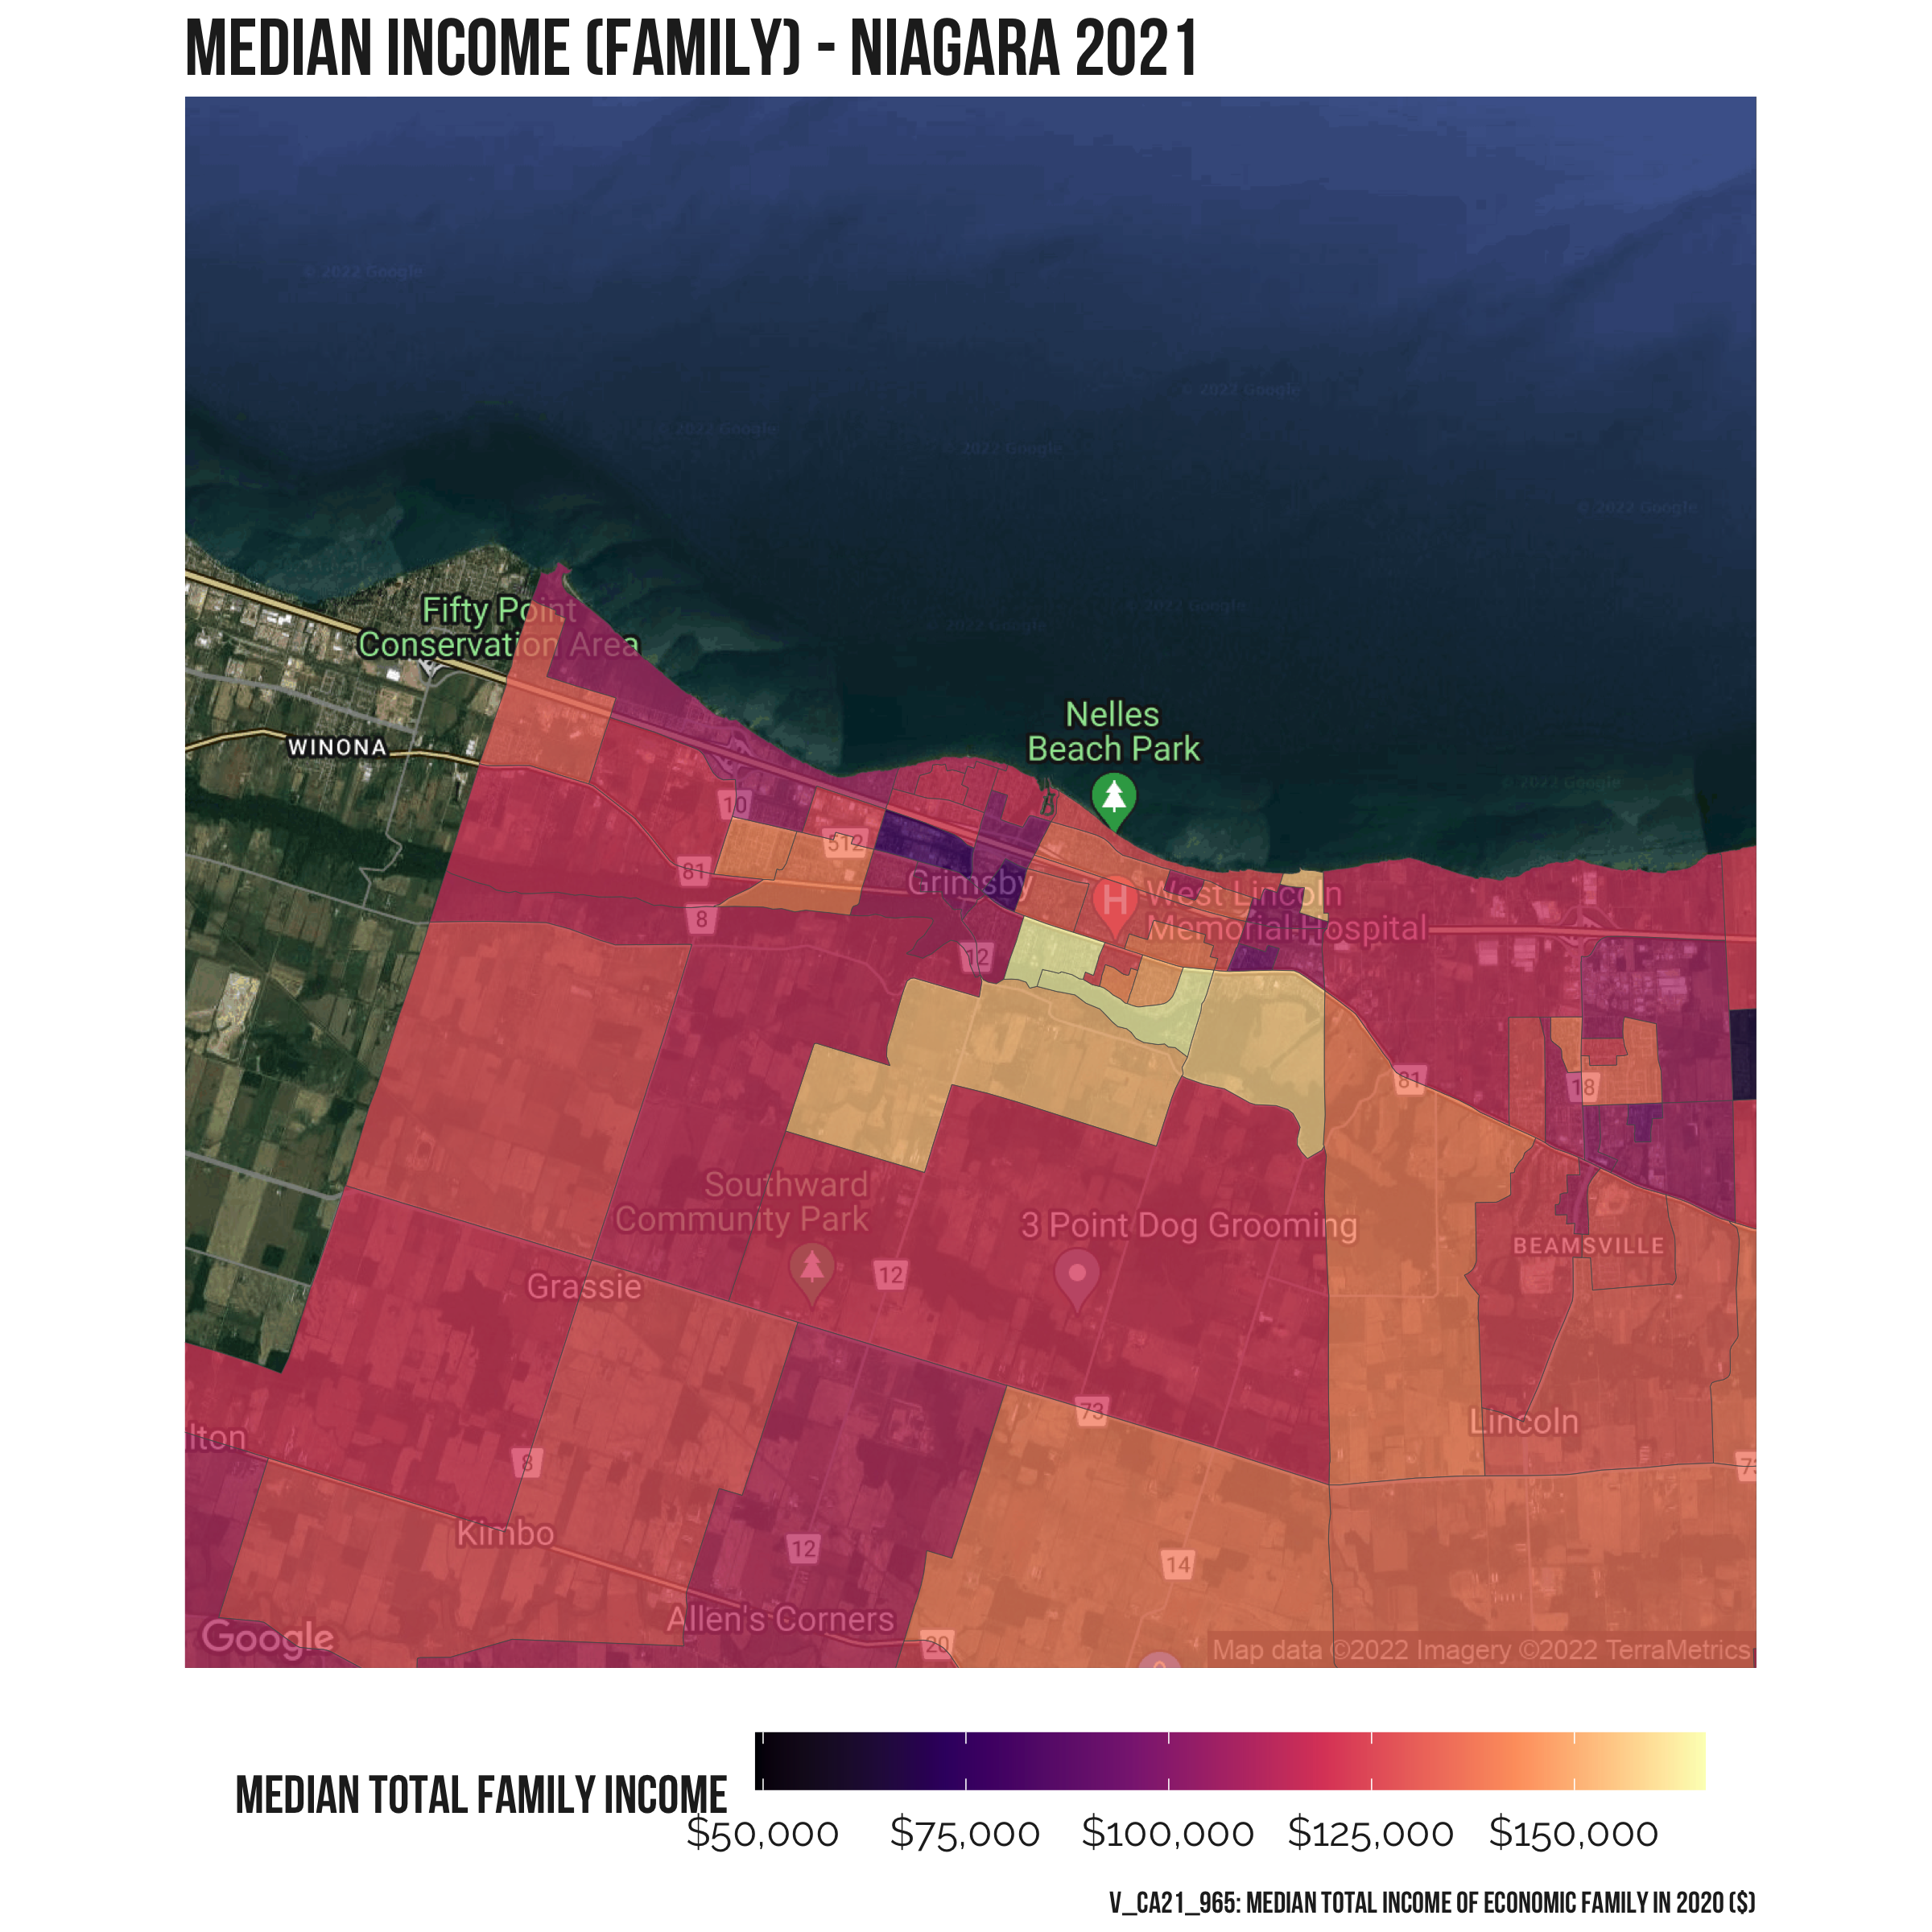
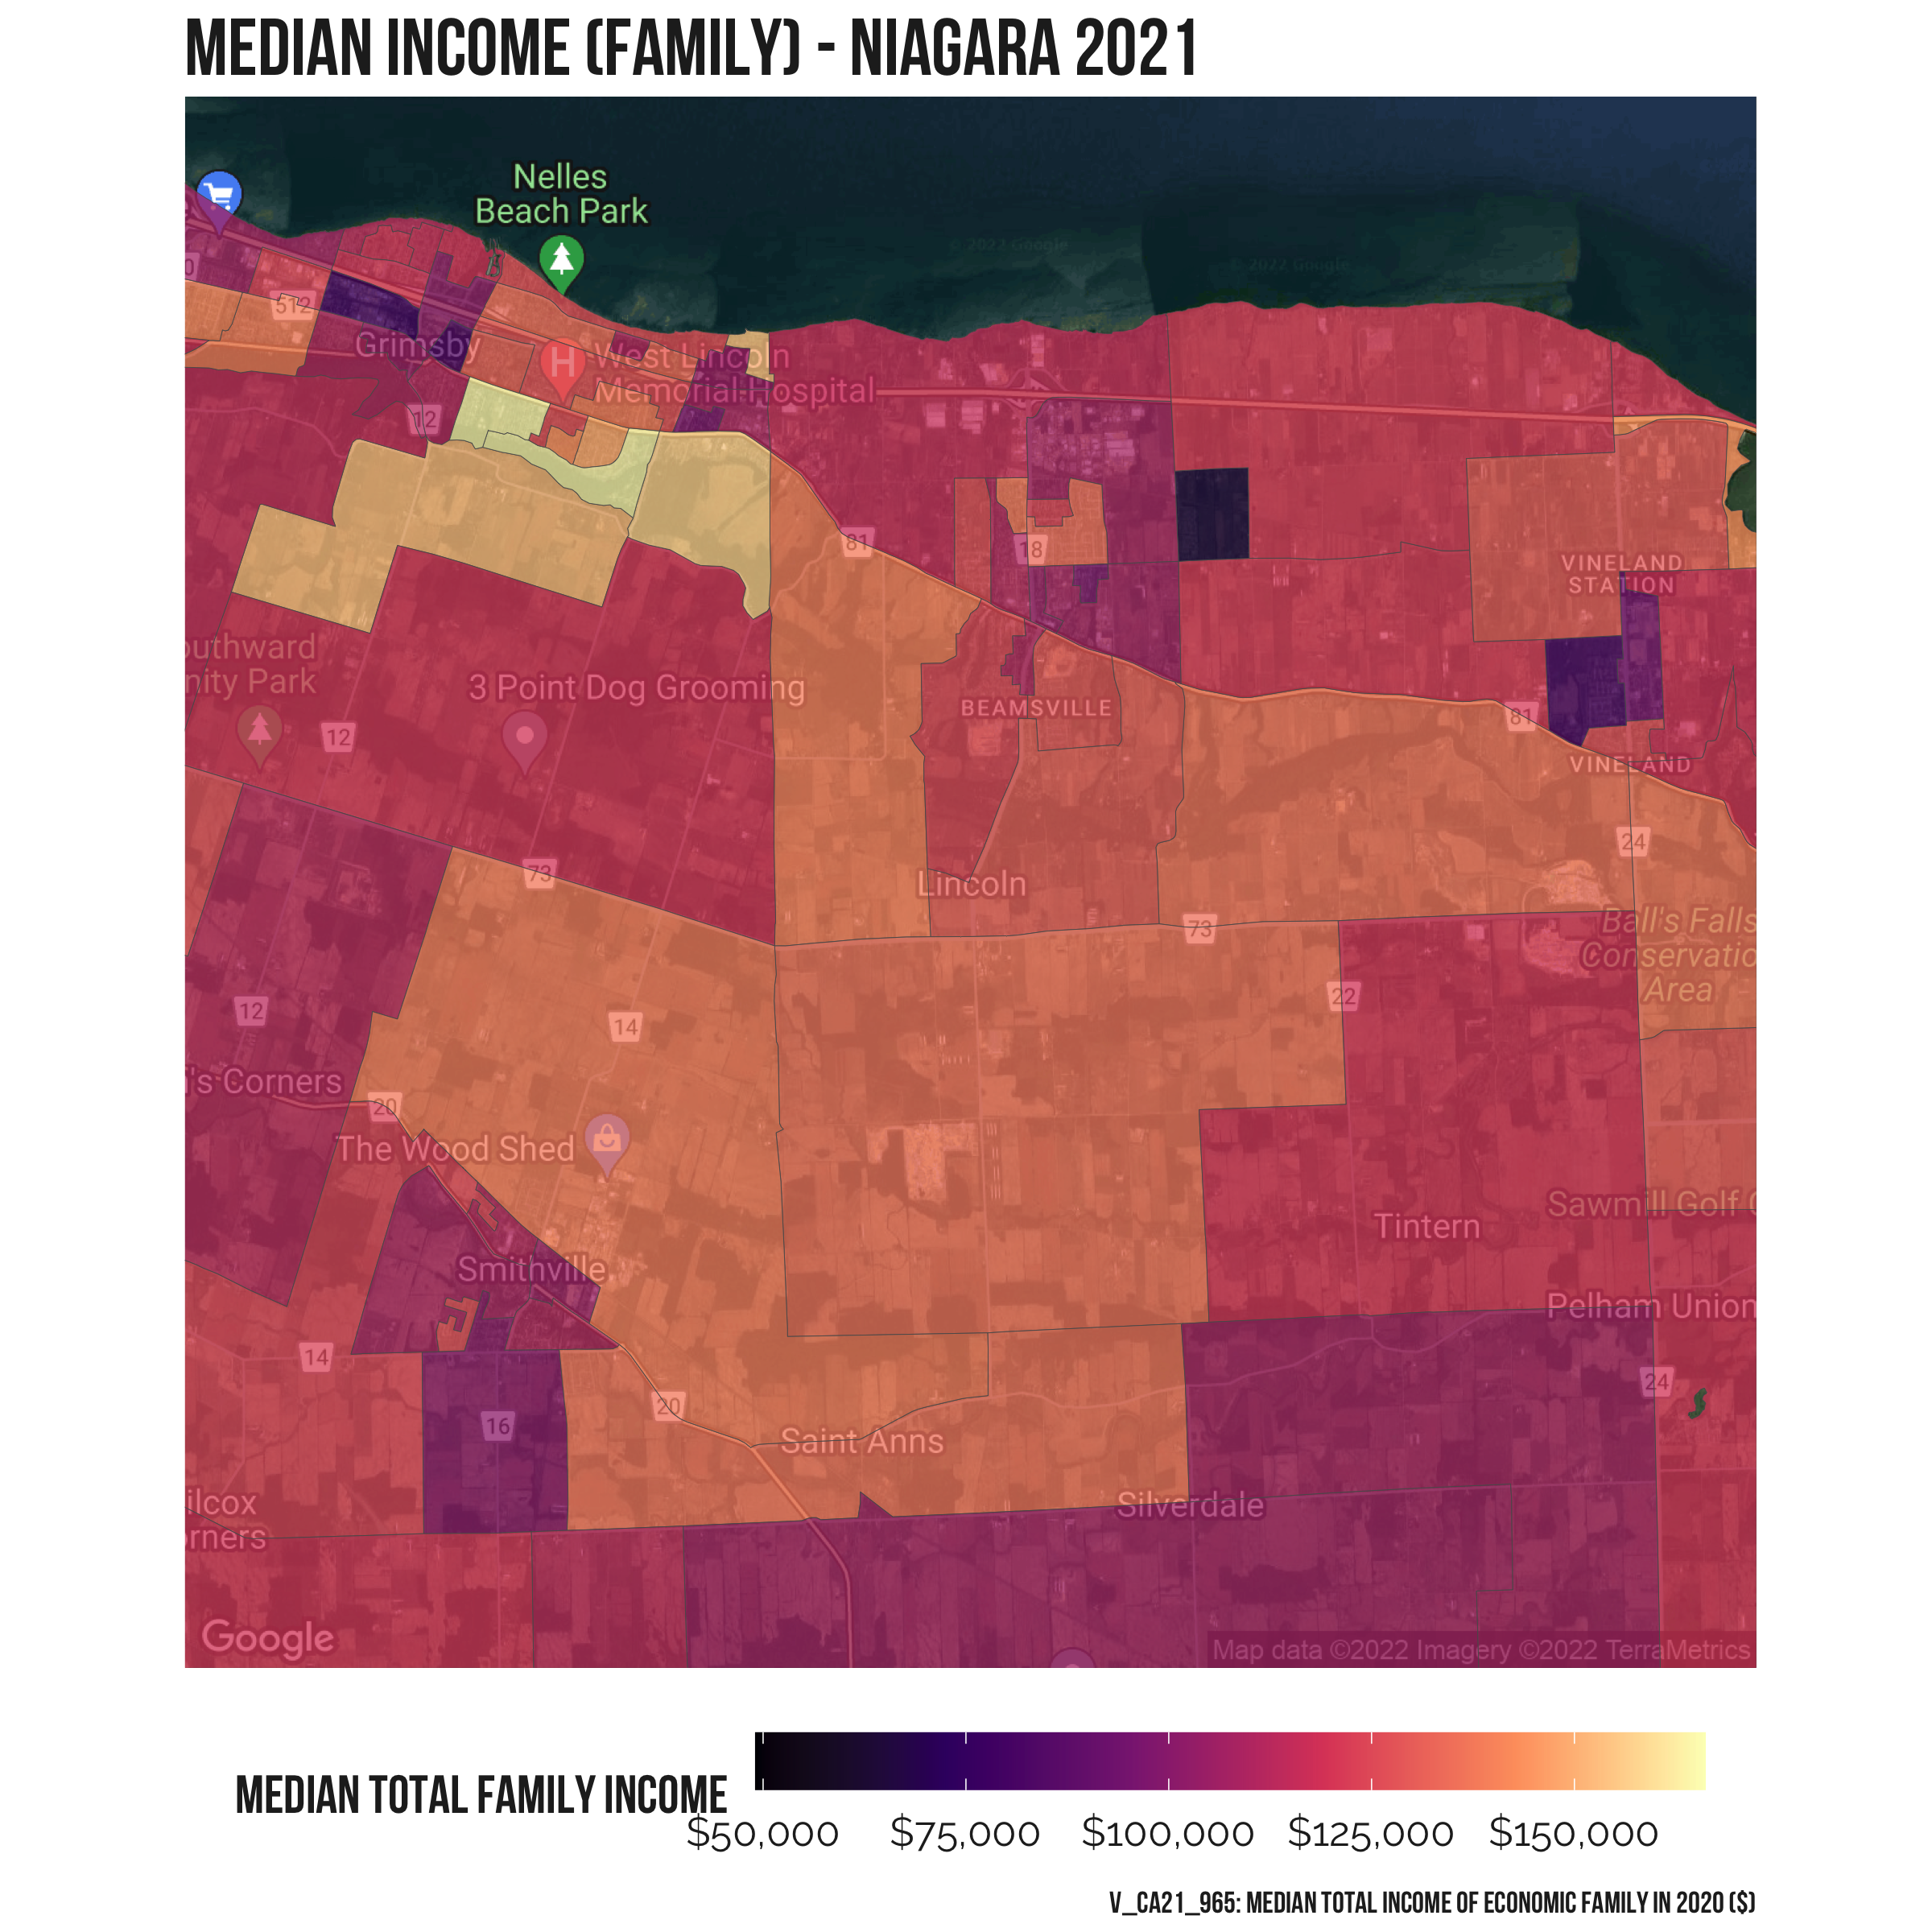
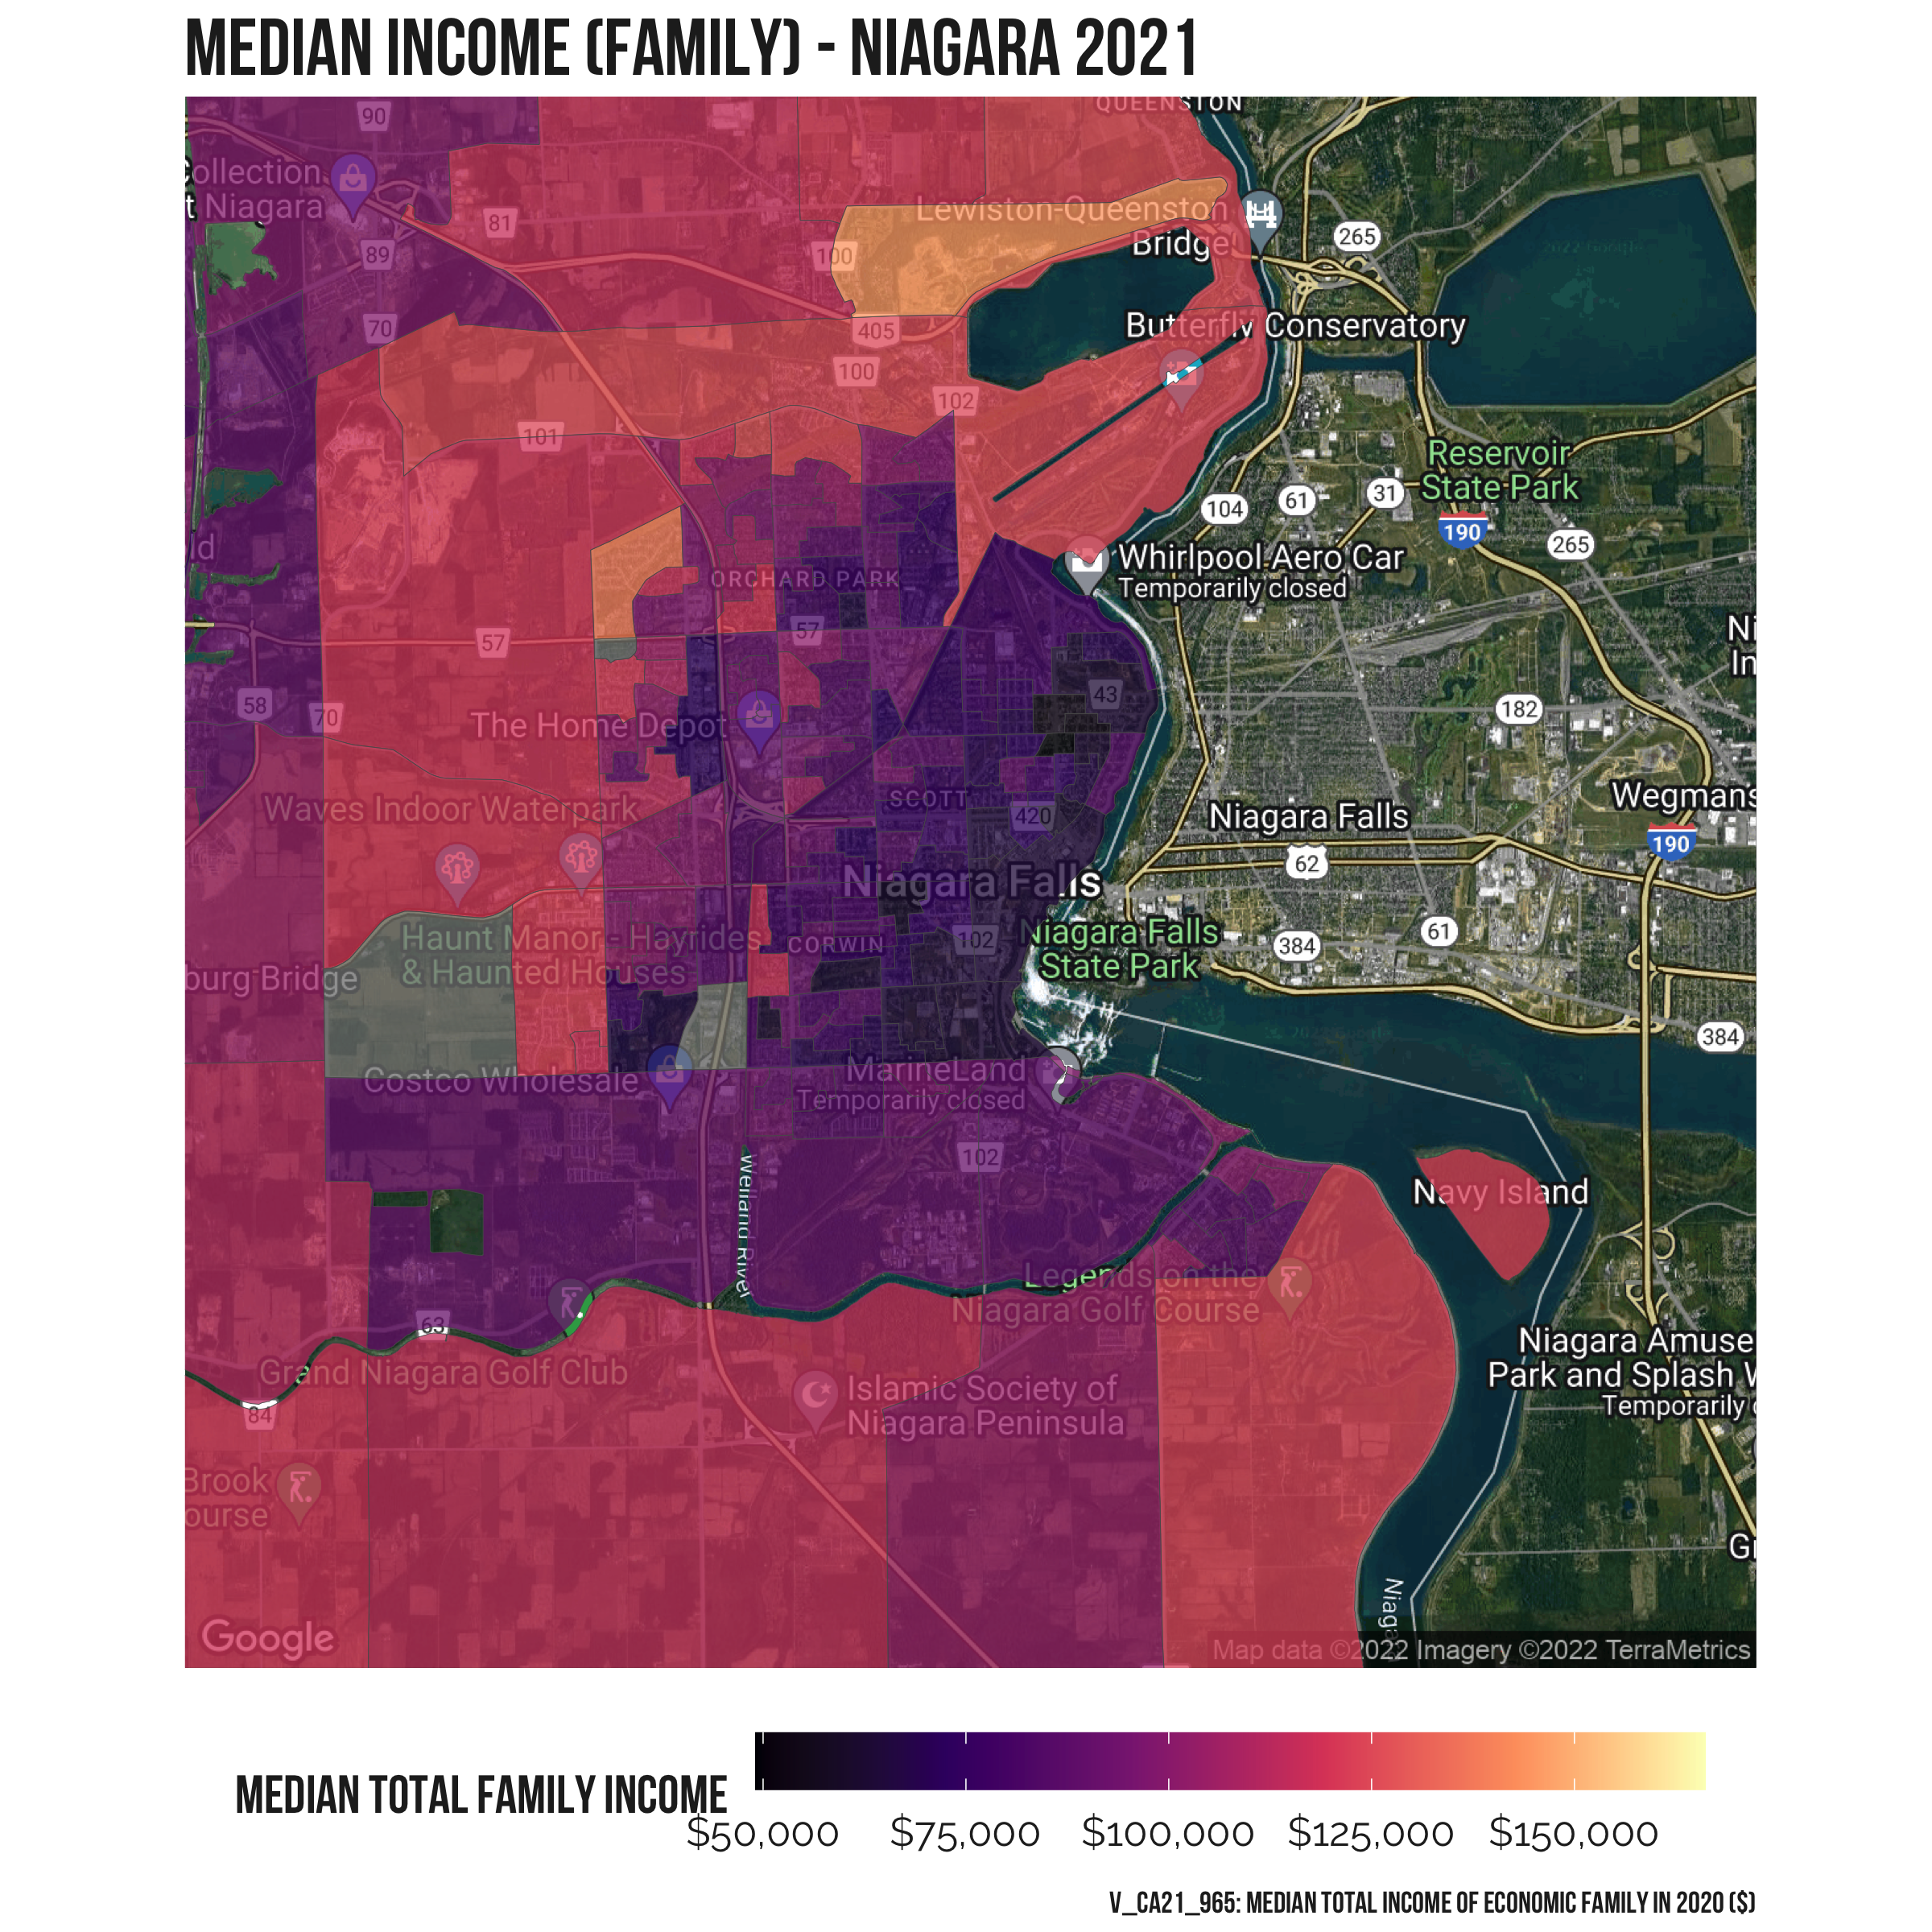
“Dissemination Areas” or DAs, are small geographic areas which normally have approximately 400 to 700 residents. Viewing the income data at the DA level shows a much richer picture of the different income levels across the region.
Individual Municipalities
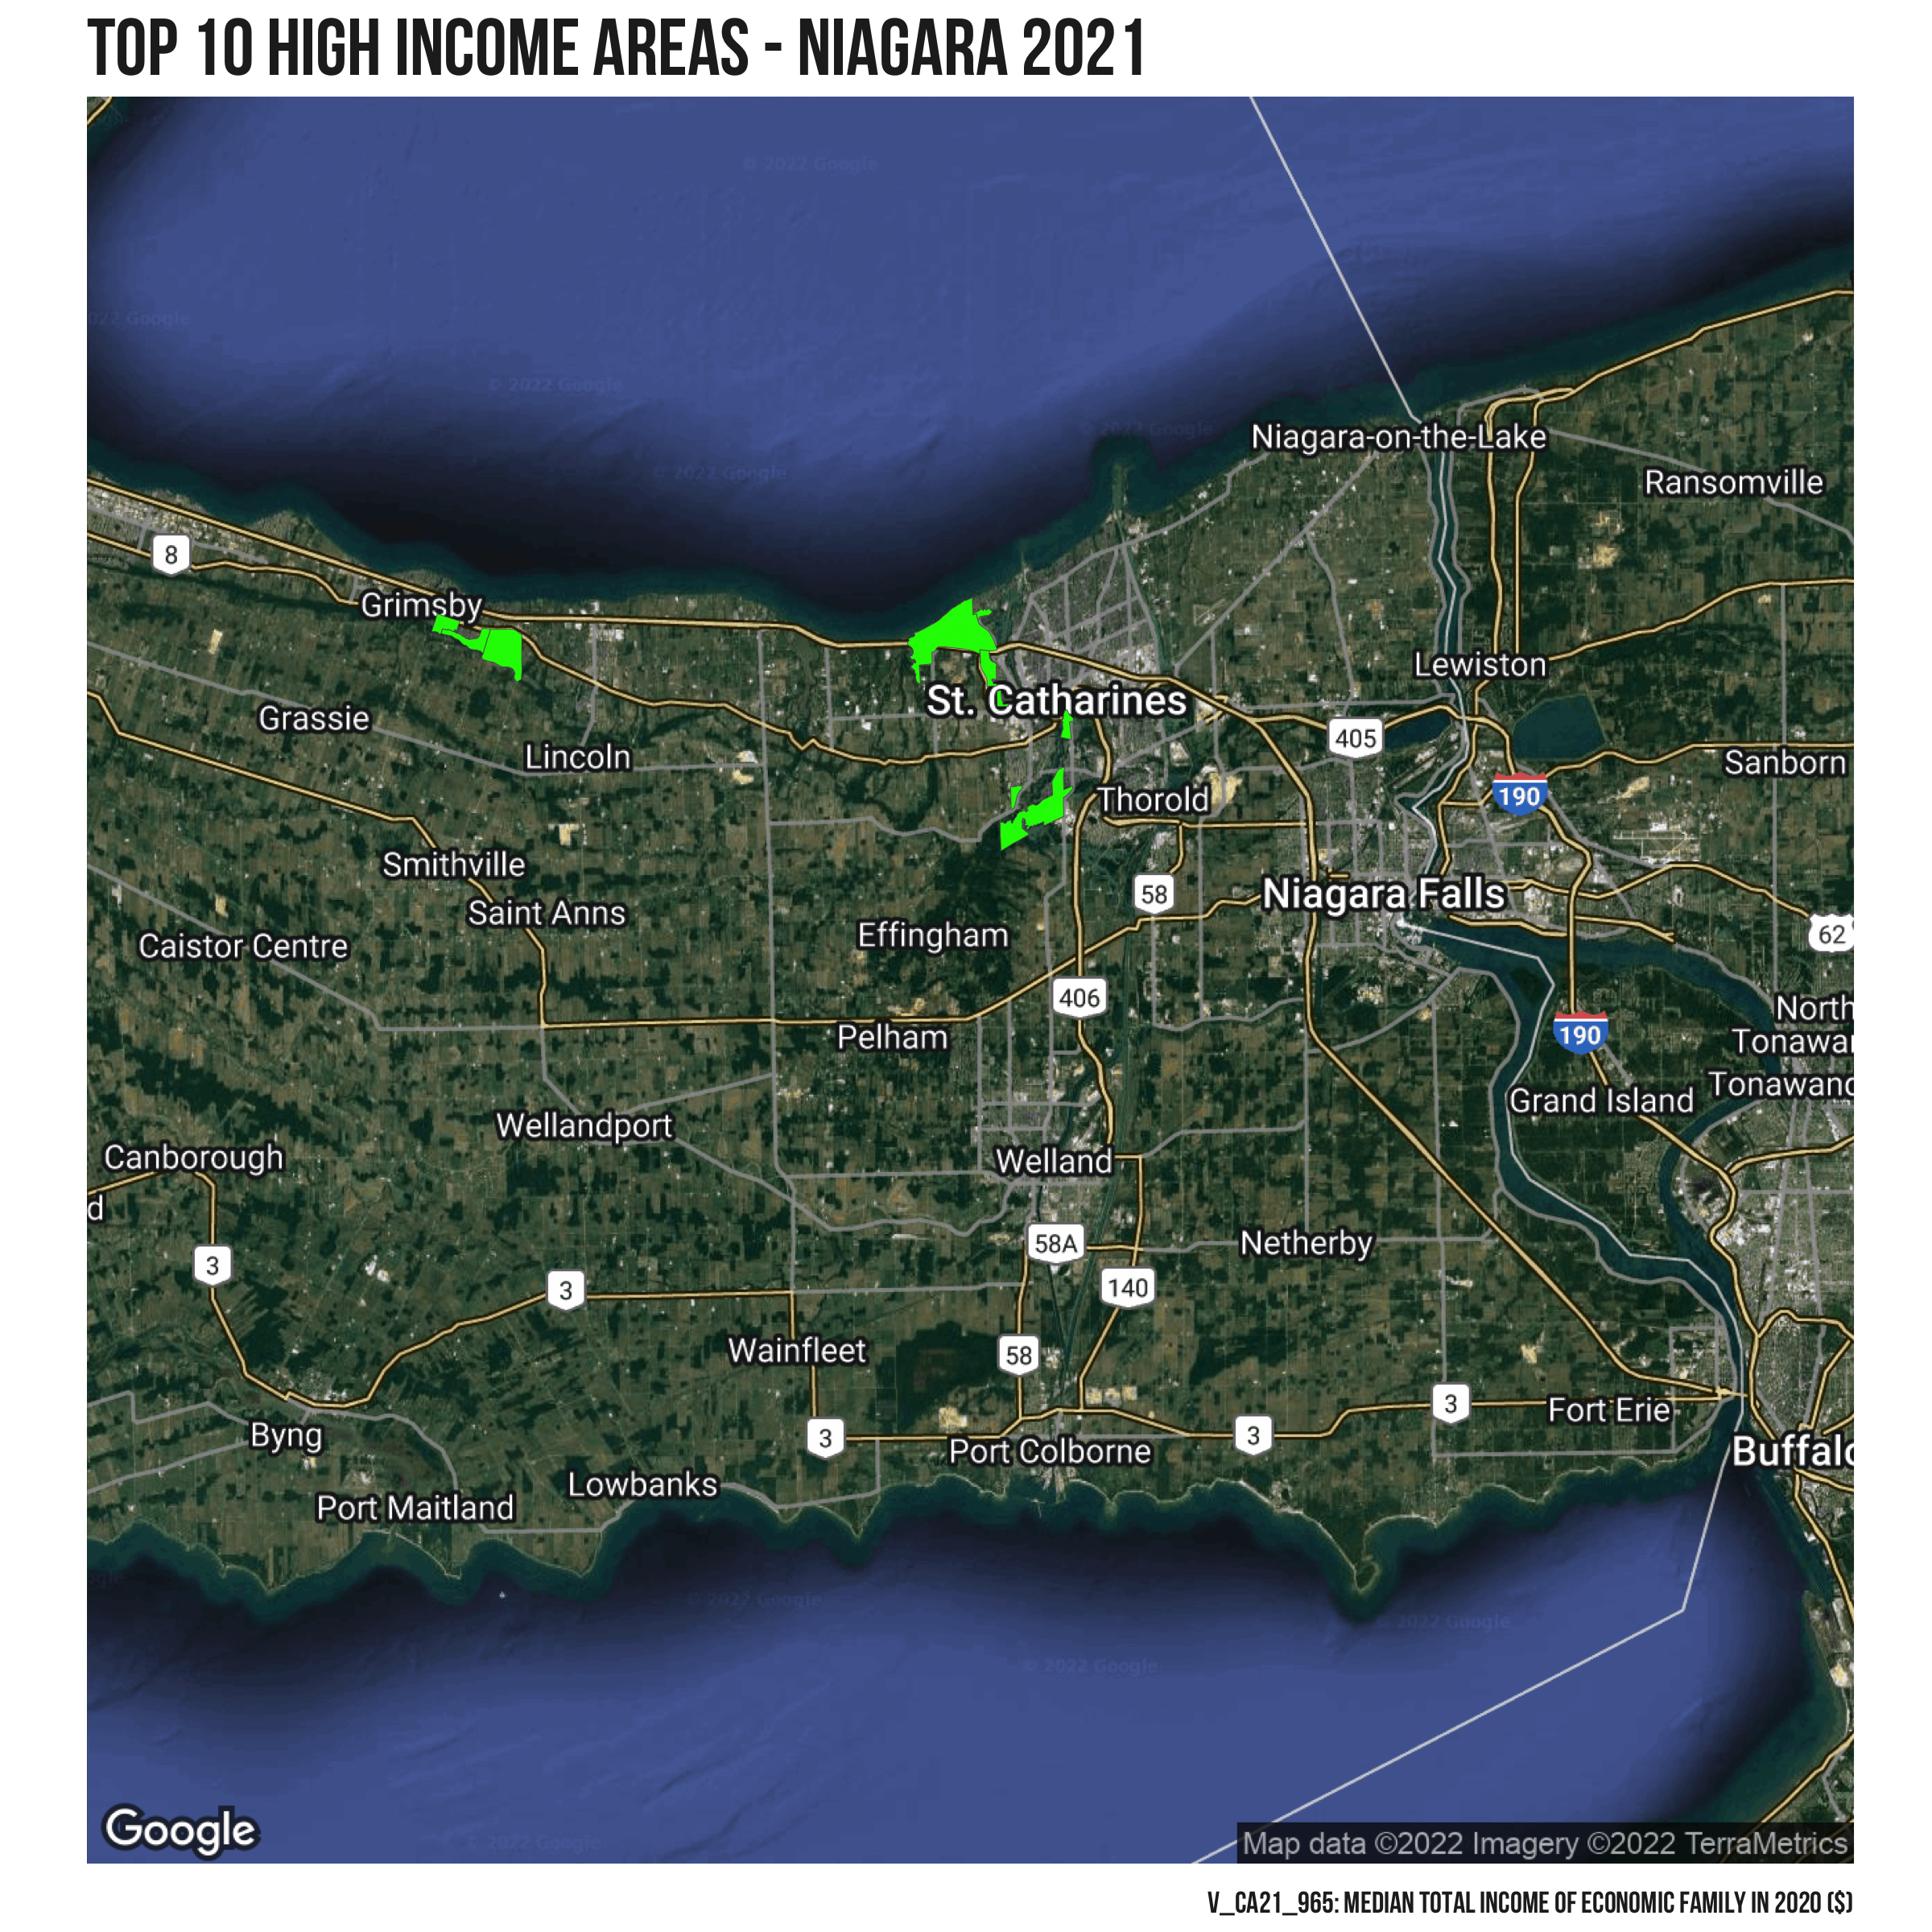
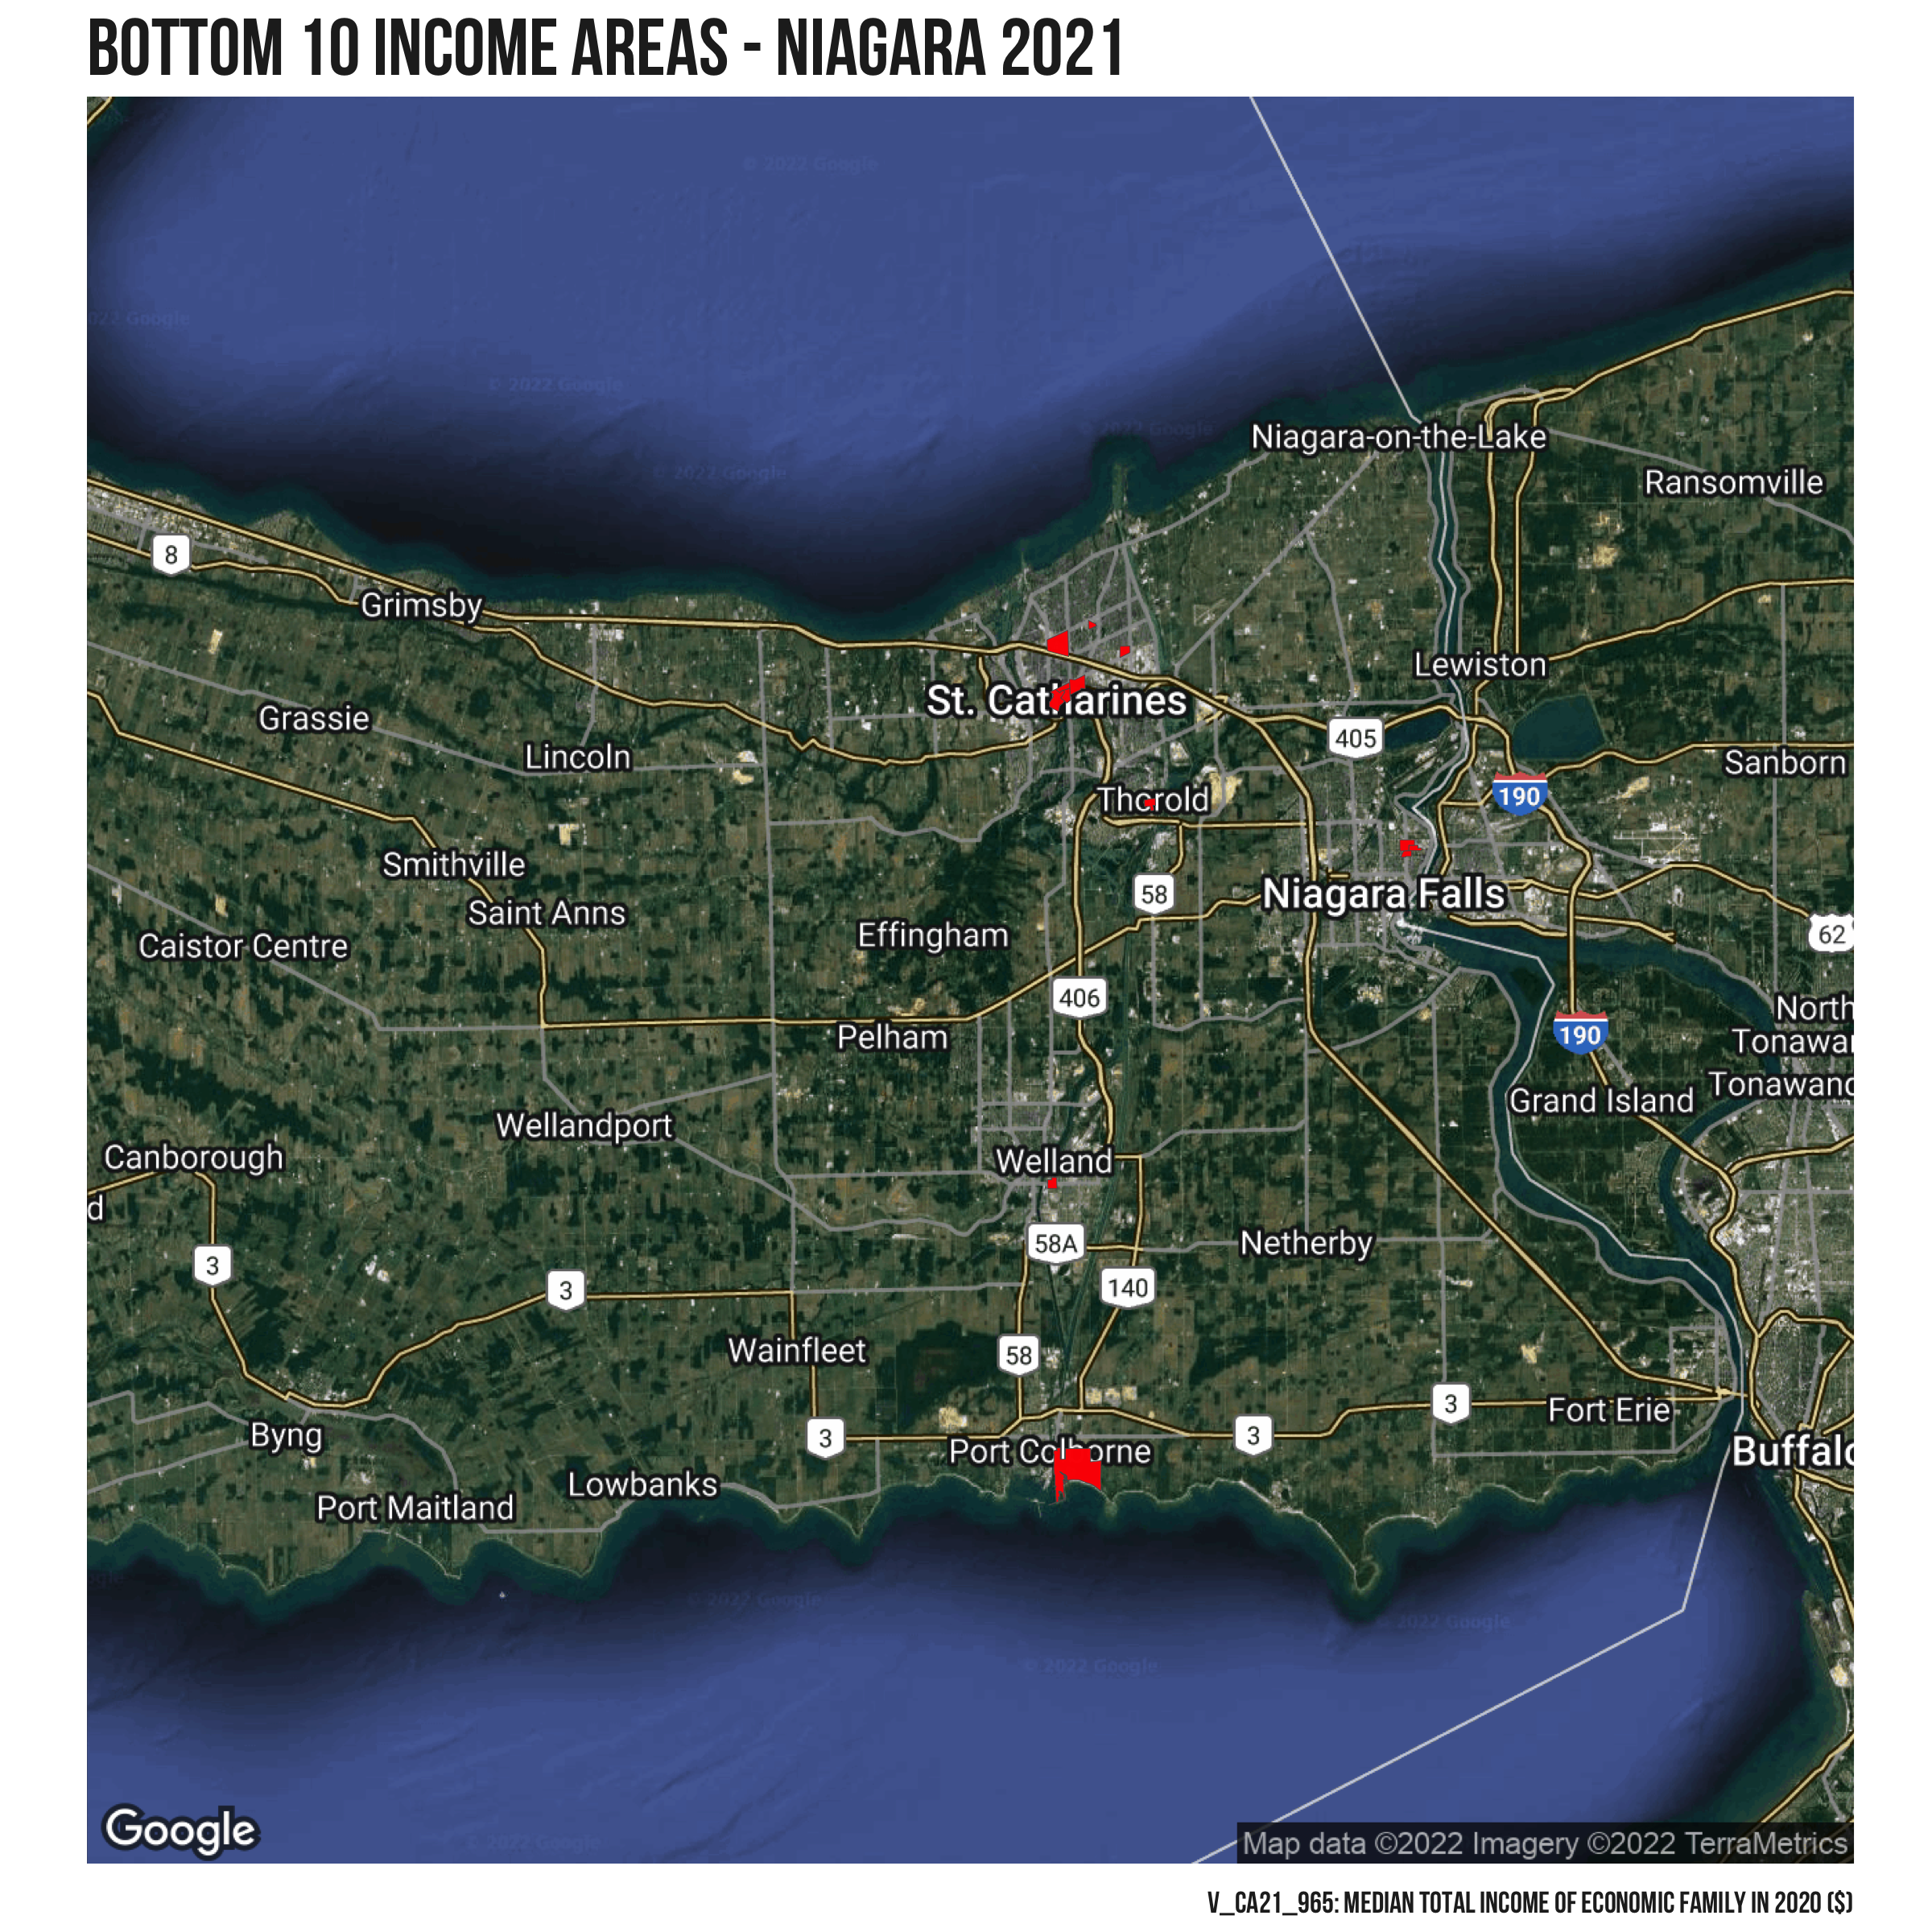
Top and Bottom Income
The following two maps show the top 10 areas for median income and the bottom 10 areas for median income.
What else do you want to see?
Is there other info you want to see? Or other locations? Get in touch – Contact Me
