The 2021 census has been released and that means it is time to dive right into some population trends. Population numbers all across Canada have changed substantially between 2016 and 2021 – you can read more about changes across Ontario and other provinces here – News.
At a local level, it is interesting to see how population and density has changed within cities. This post will go into more detail about the changes in Hamilton between 2016 and 2021.
This post specifically looks at the CMA of Hamilton, which might be different than what you think of as “Hamilton”, especially if you were a resident before the 2001 amalgamation. Statistics Canada defines a census metropolitan area (CMA) as “…one or more adjacent municipalities centred on a population centre (known as the core). A CMA must have a total population of at least 100,000 of which 50,000 or more must live in the core.”
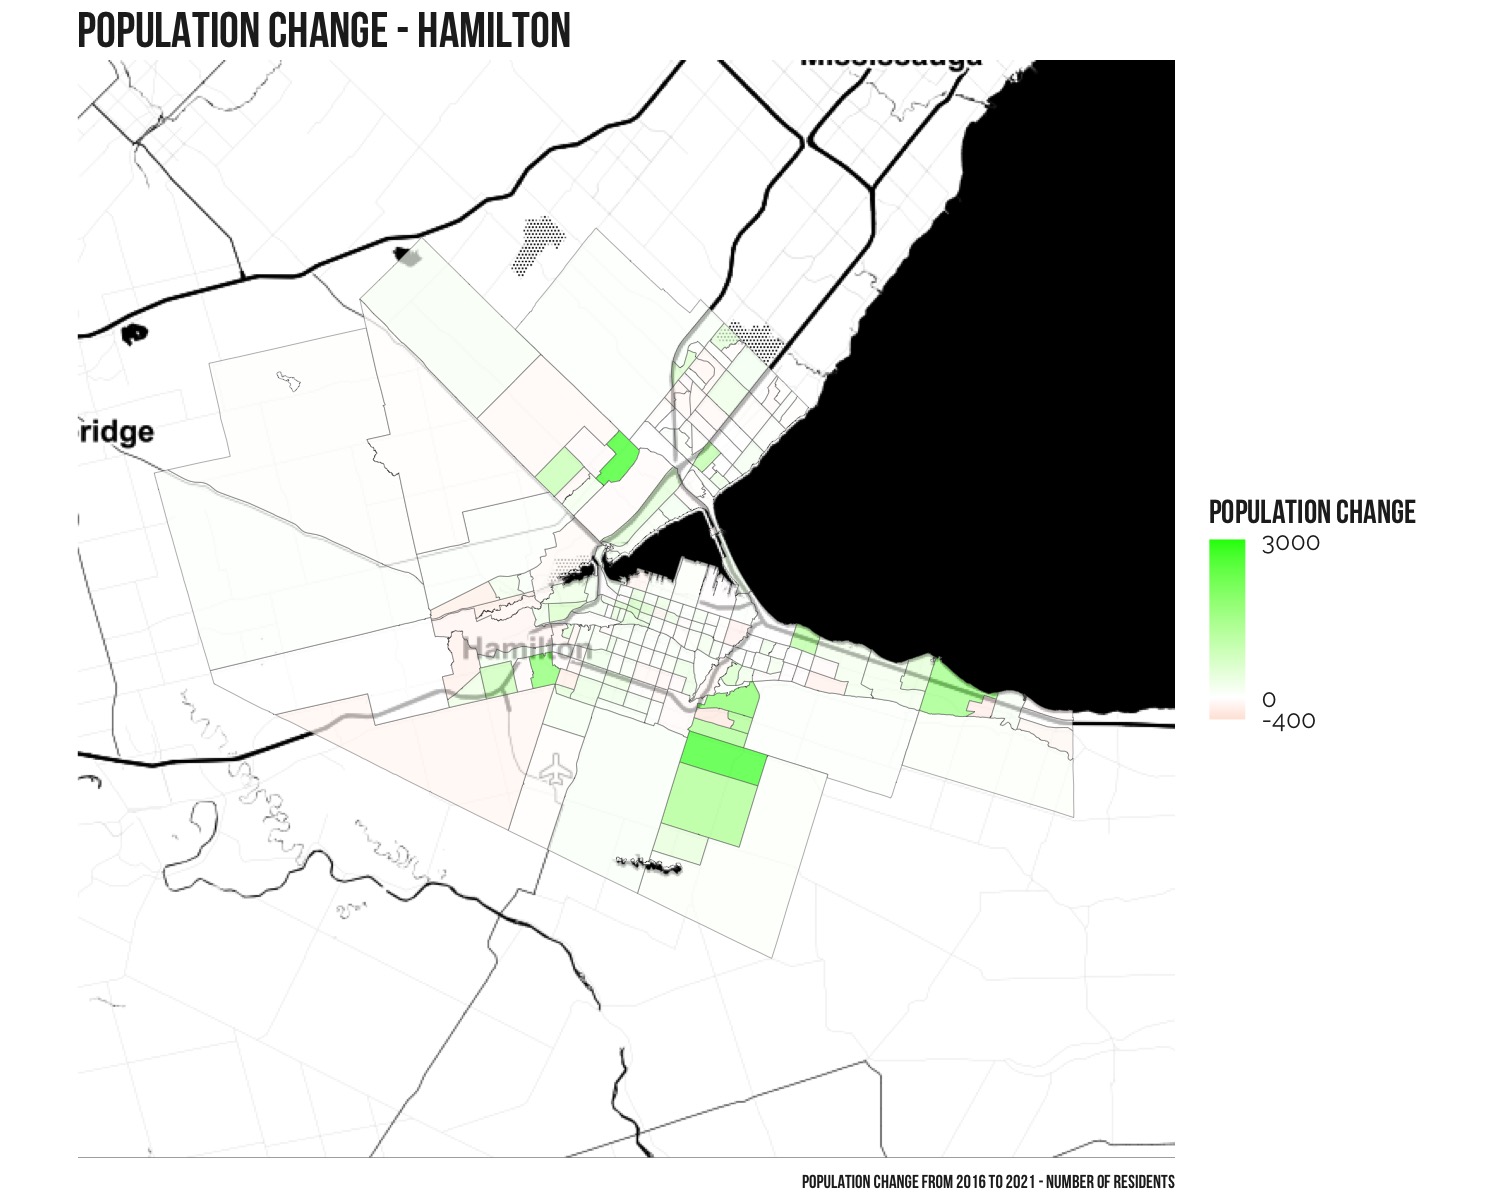
Overall this area has seen an increase of 37,639 residents, from 747,545 in 2016 to 785,184 in 2021. The map below shows how population has changed across the 205 different Census Tracts across Hamilton with green an increase, white no change, and red a decrease.
Highest Growth Areas
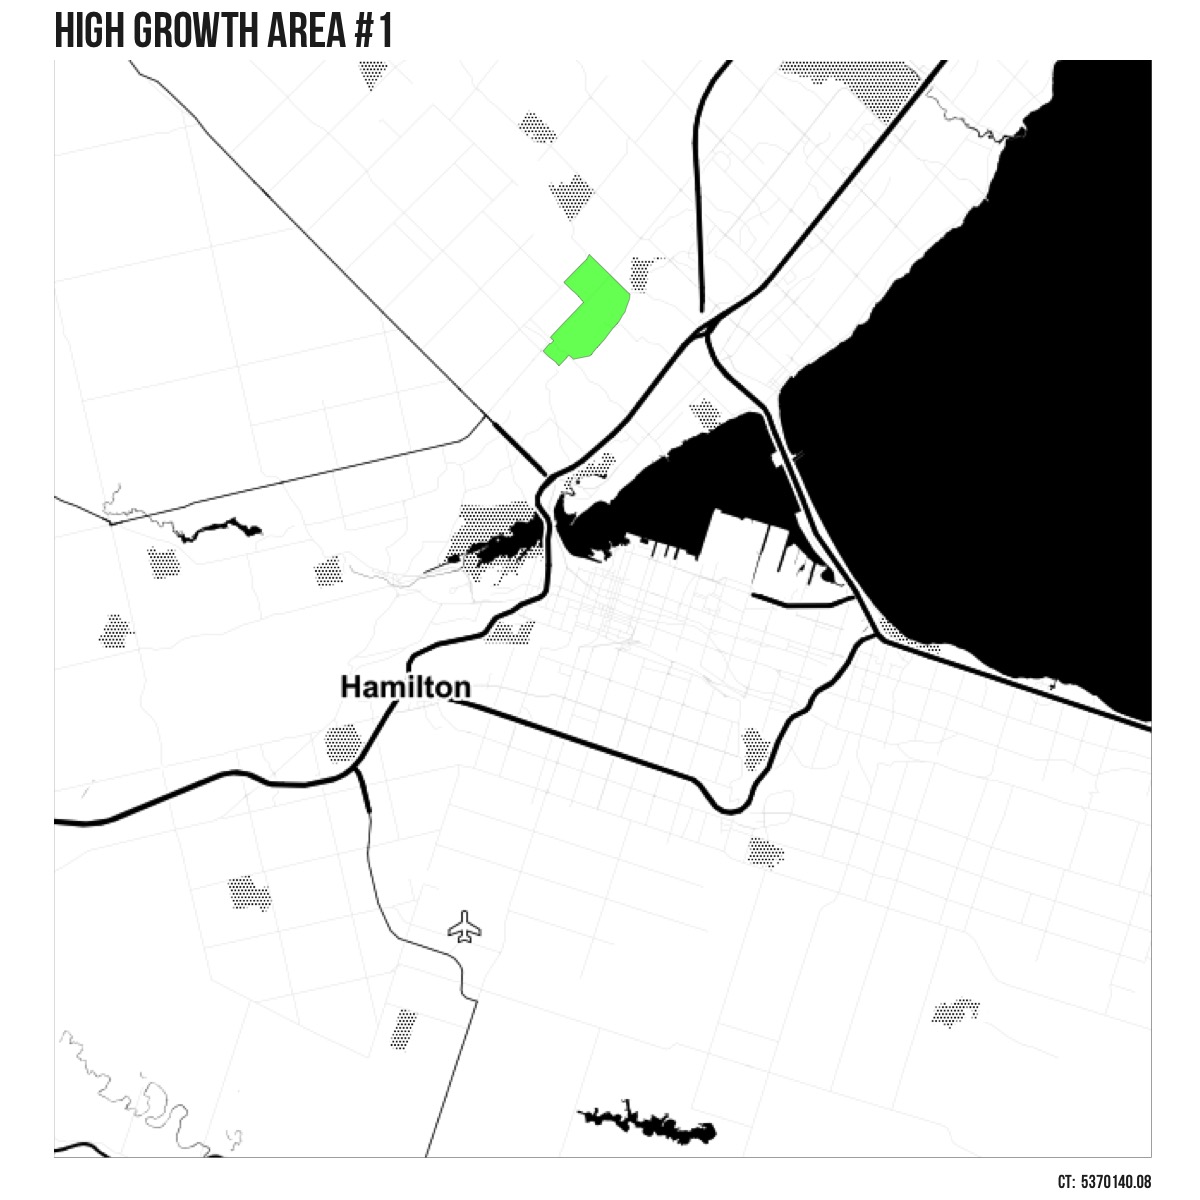
High Growth Area #1
Waterdown has seen the largest amount of growth.
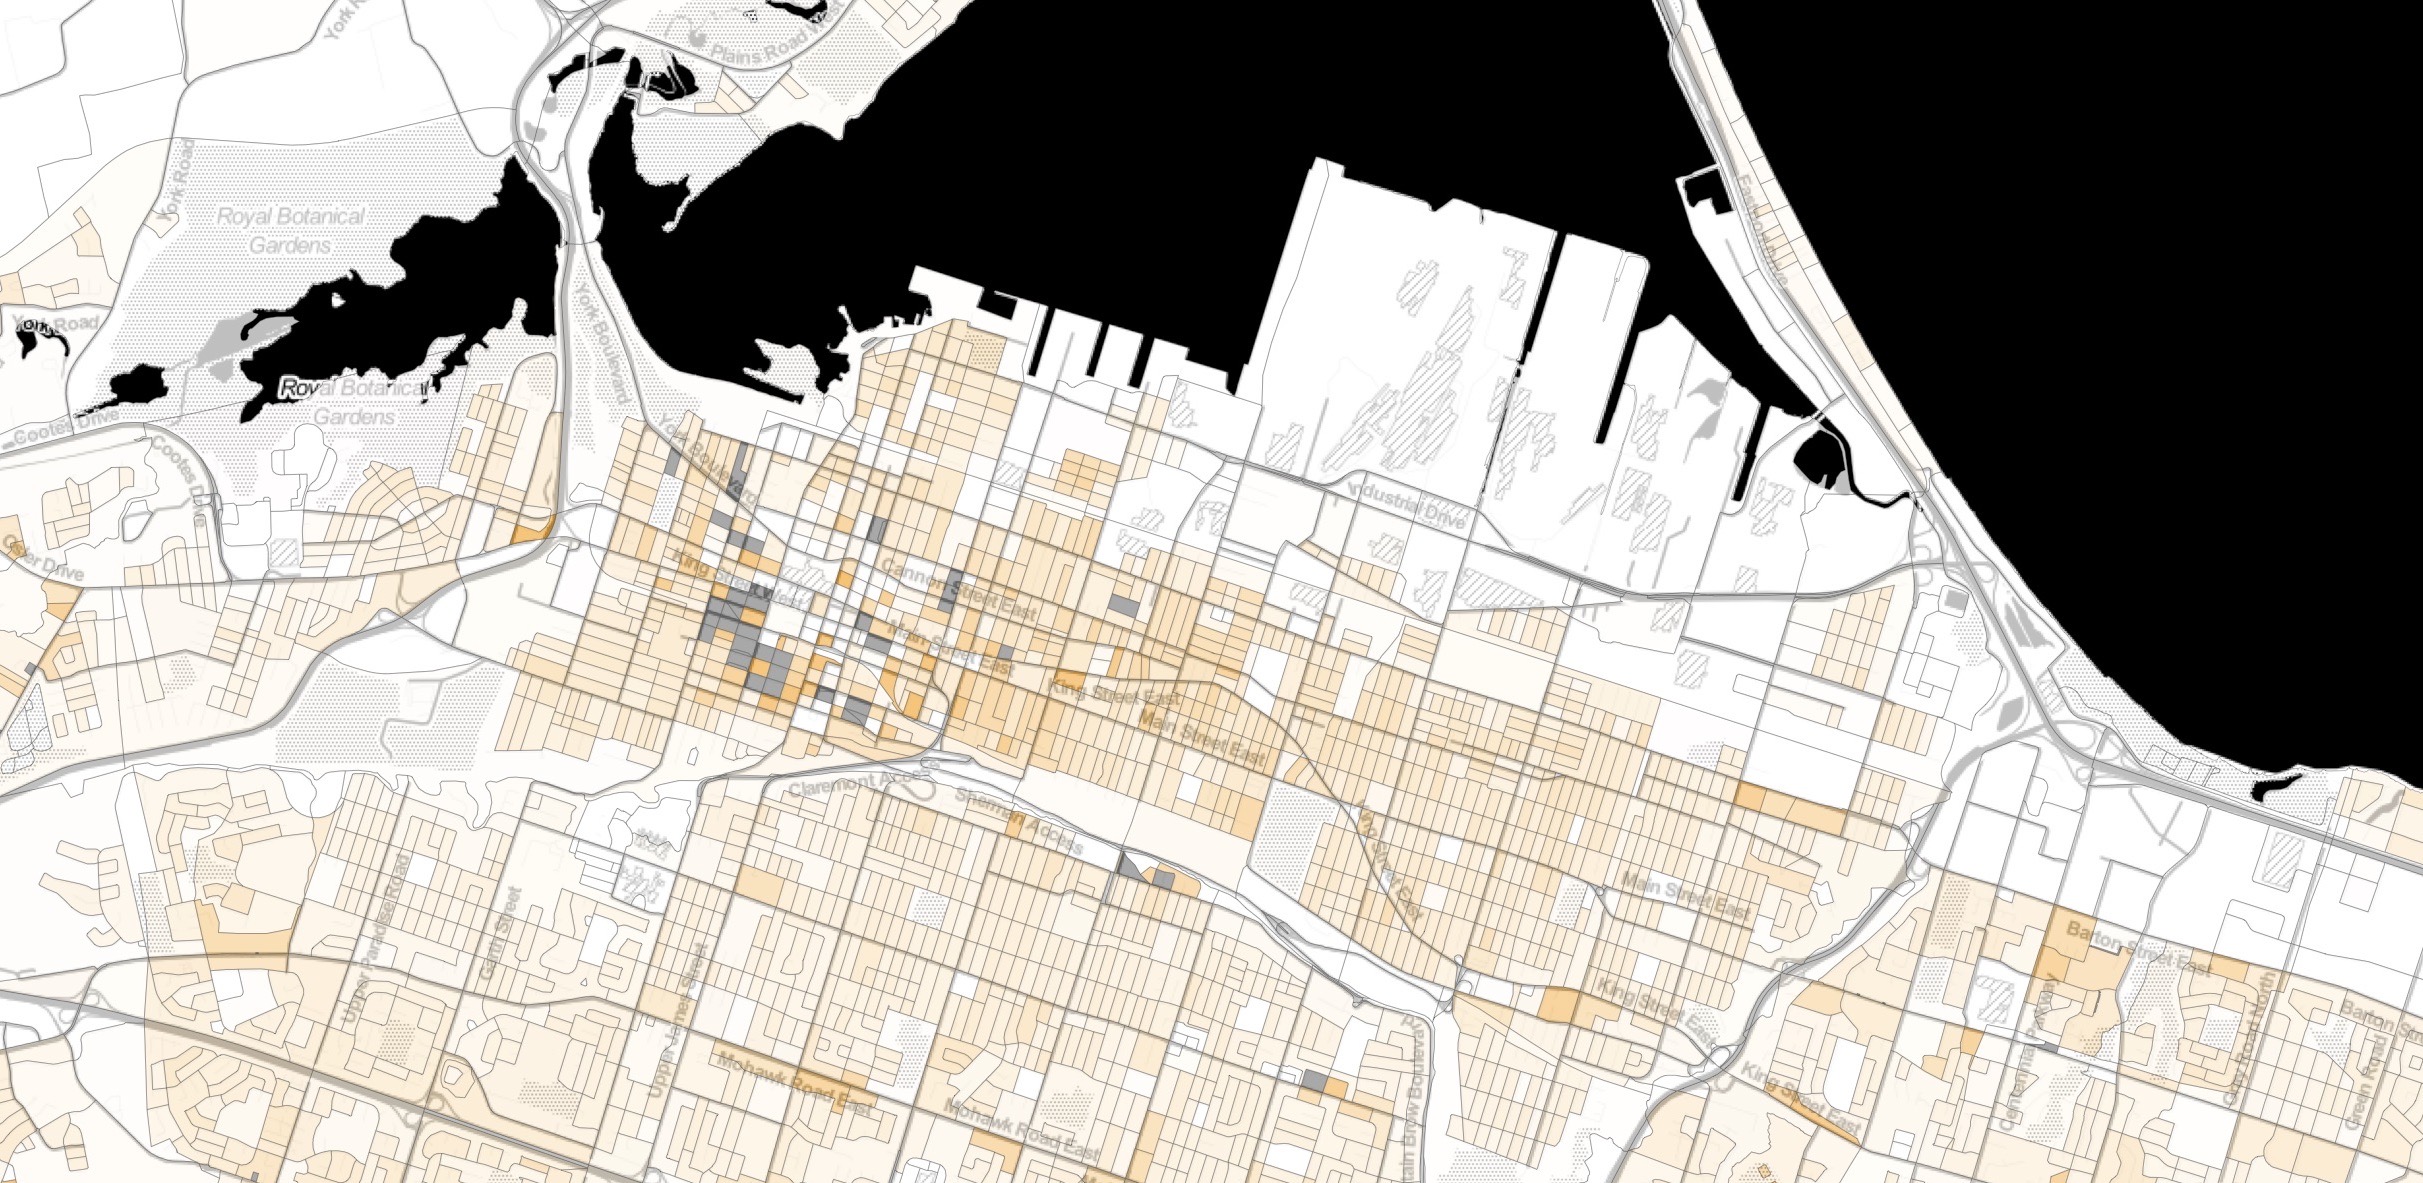
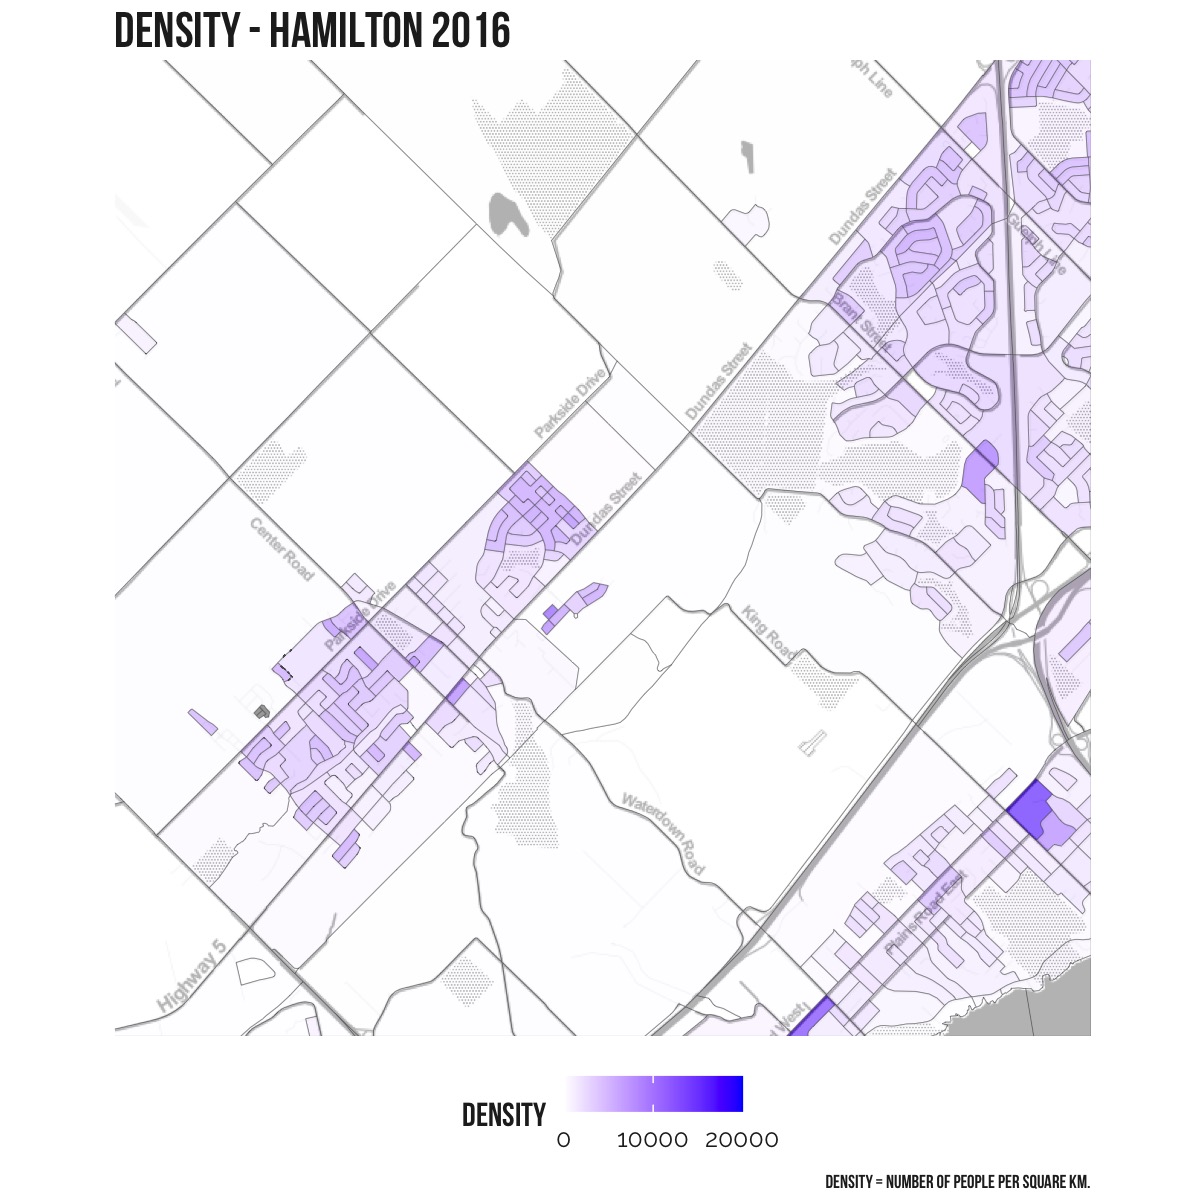
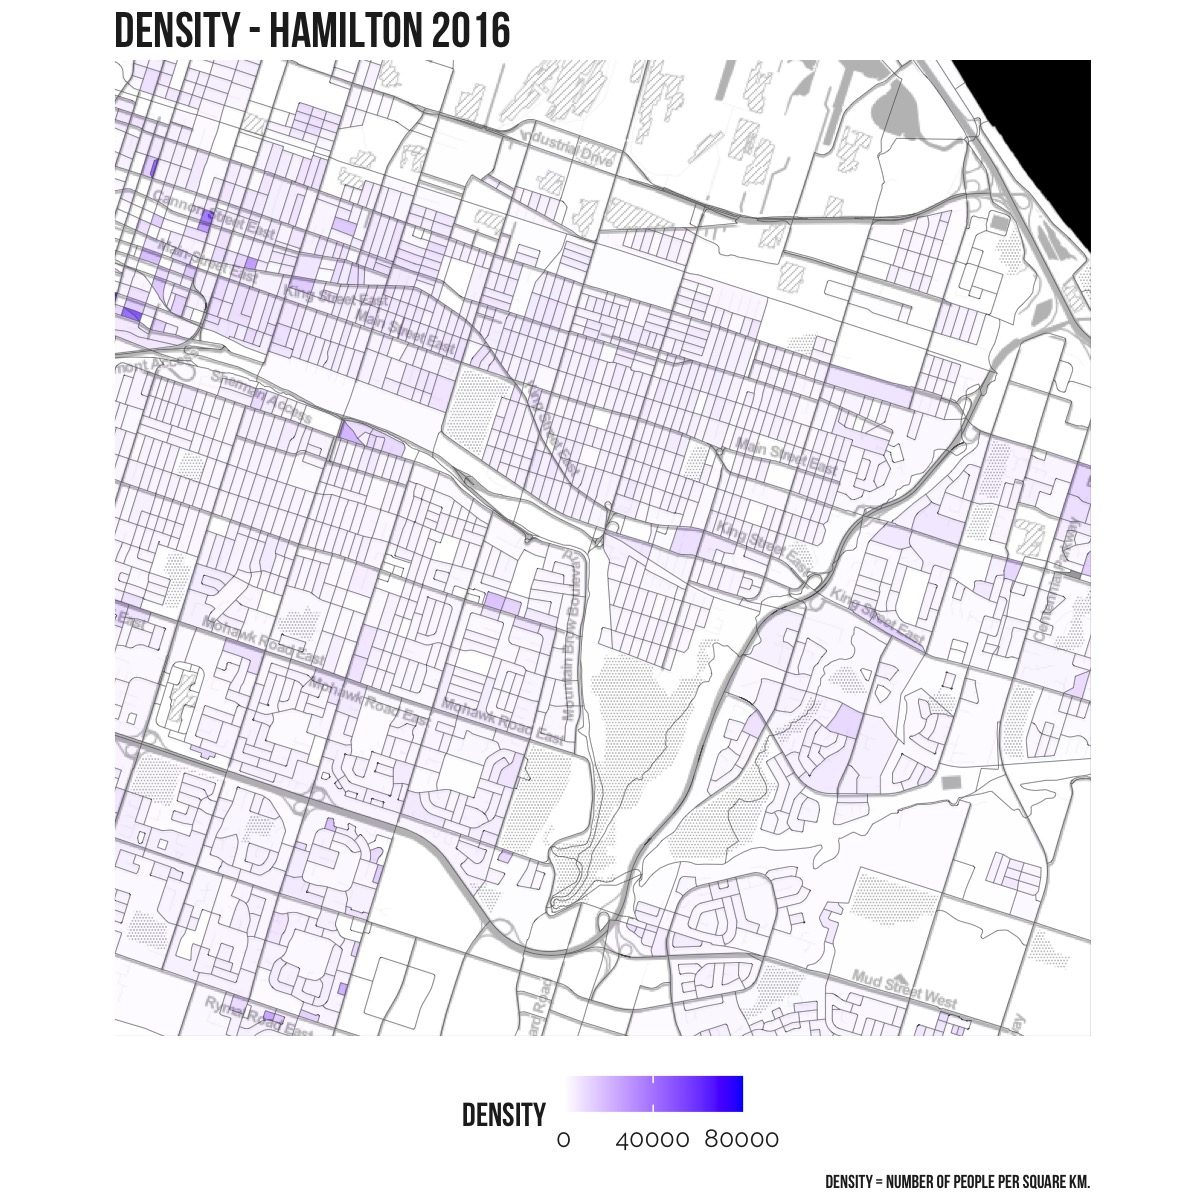
Drag the slider on the map below to see how population density has changed in this area between 2016 and 2021.
High Growth Area #2
Stoney Creek mountain (near the new Bishop Ryan high school) has seen the second largest amount of growth.
Drag the slider on the map below to see how population density has changed in this area between 2016 and 2021.

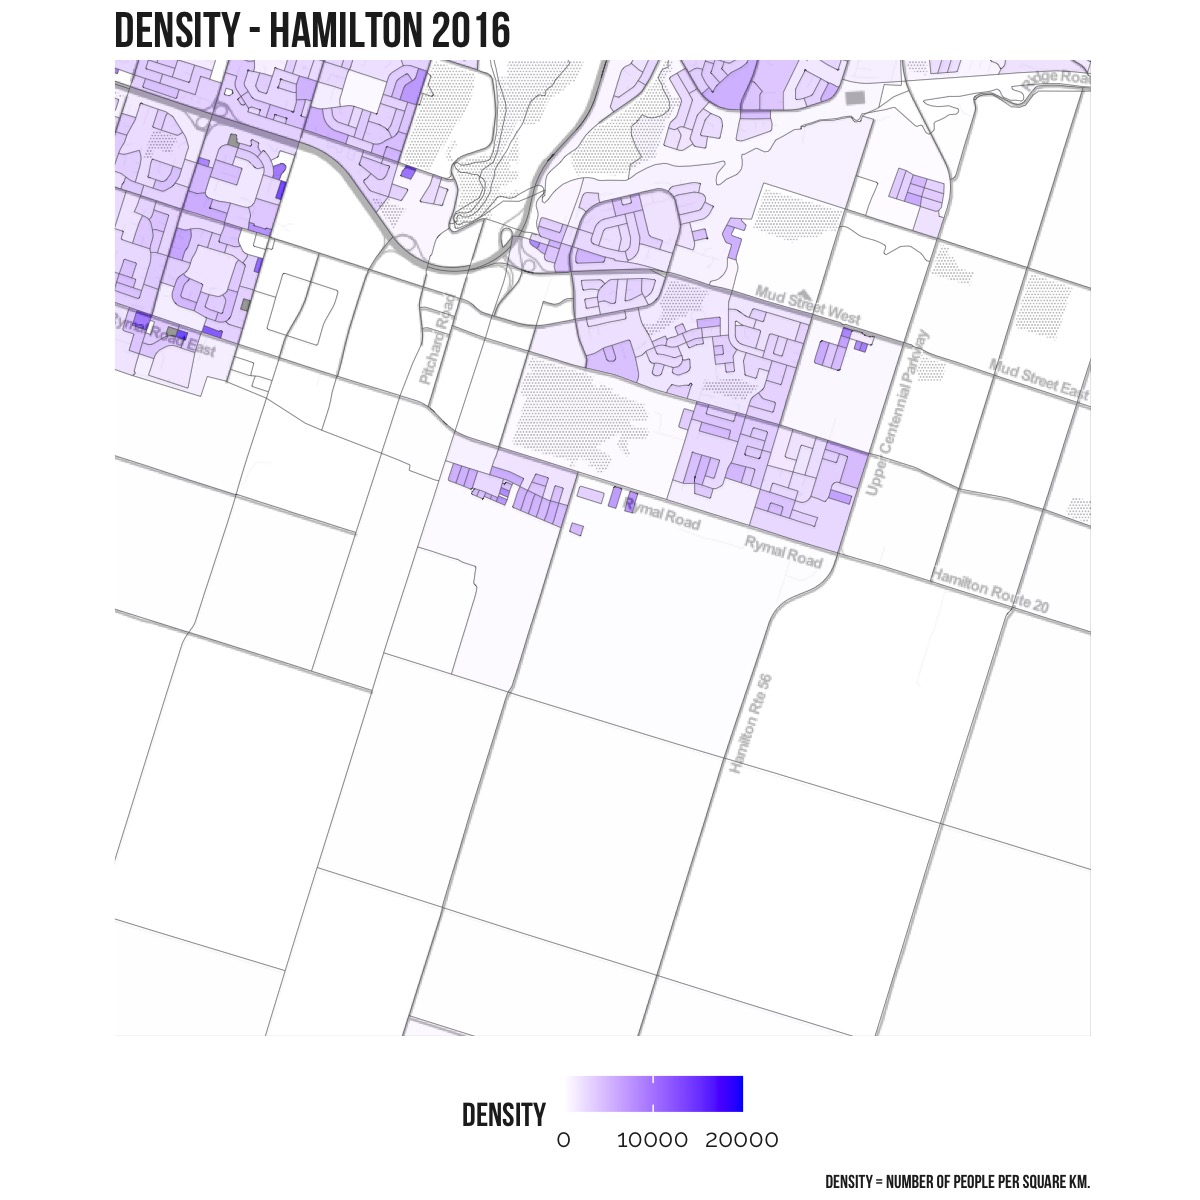
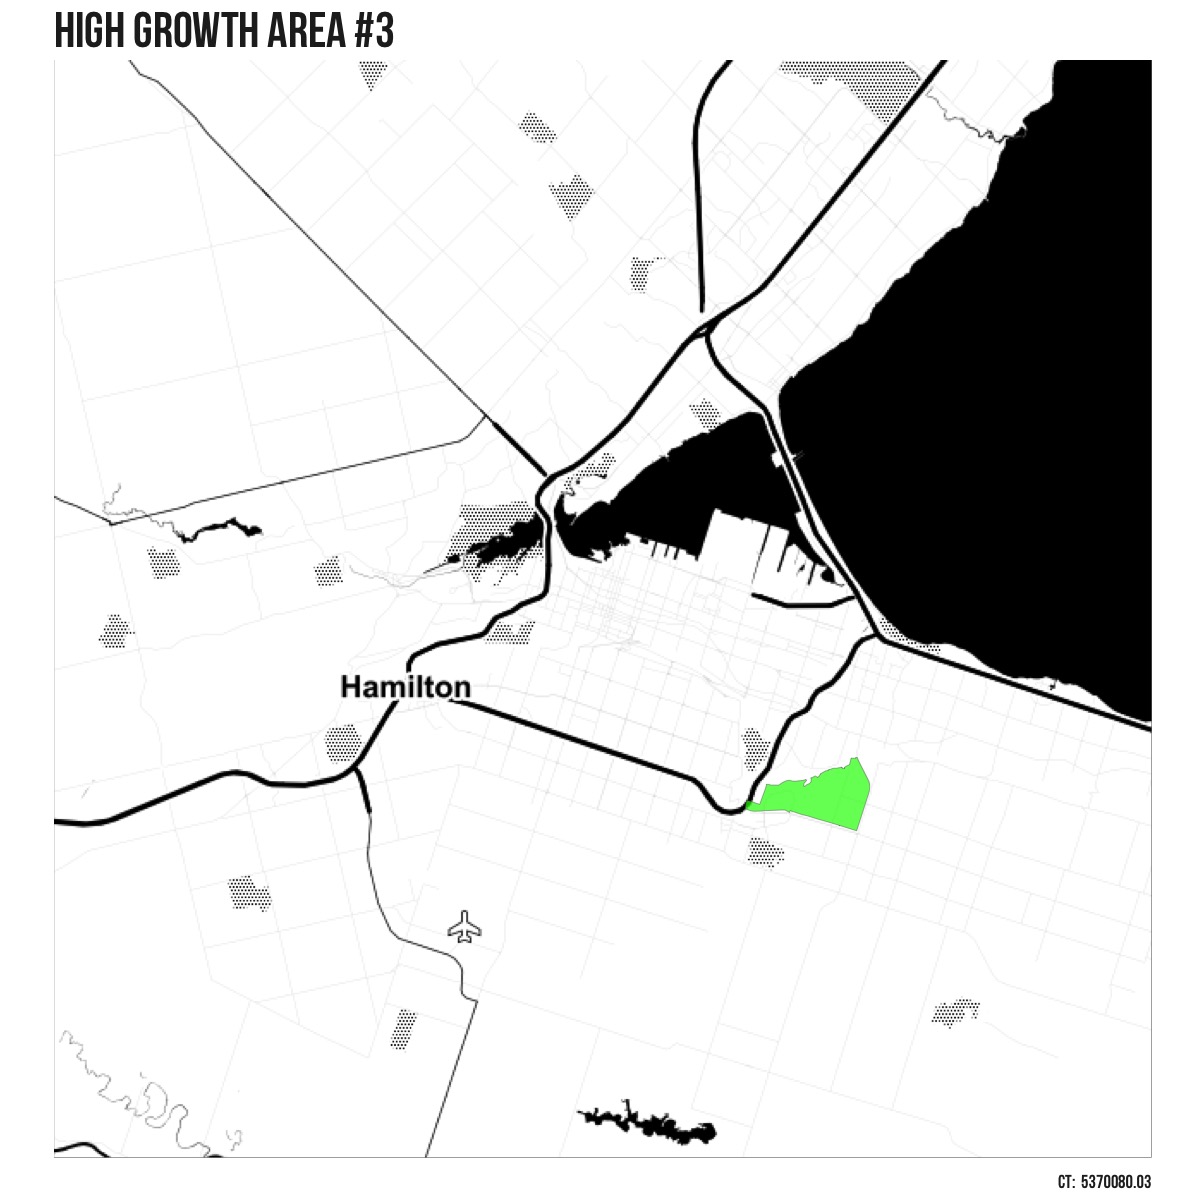
High Growth Area #3
Another part of Stoney Creek mountain (Felker’s Falls) has seen the third largest amount of growth.
Drag the slider on the map below to see how population density has changed in this area between 2016 and 2021.
Low Growth Area
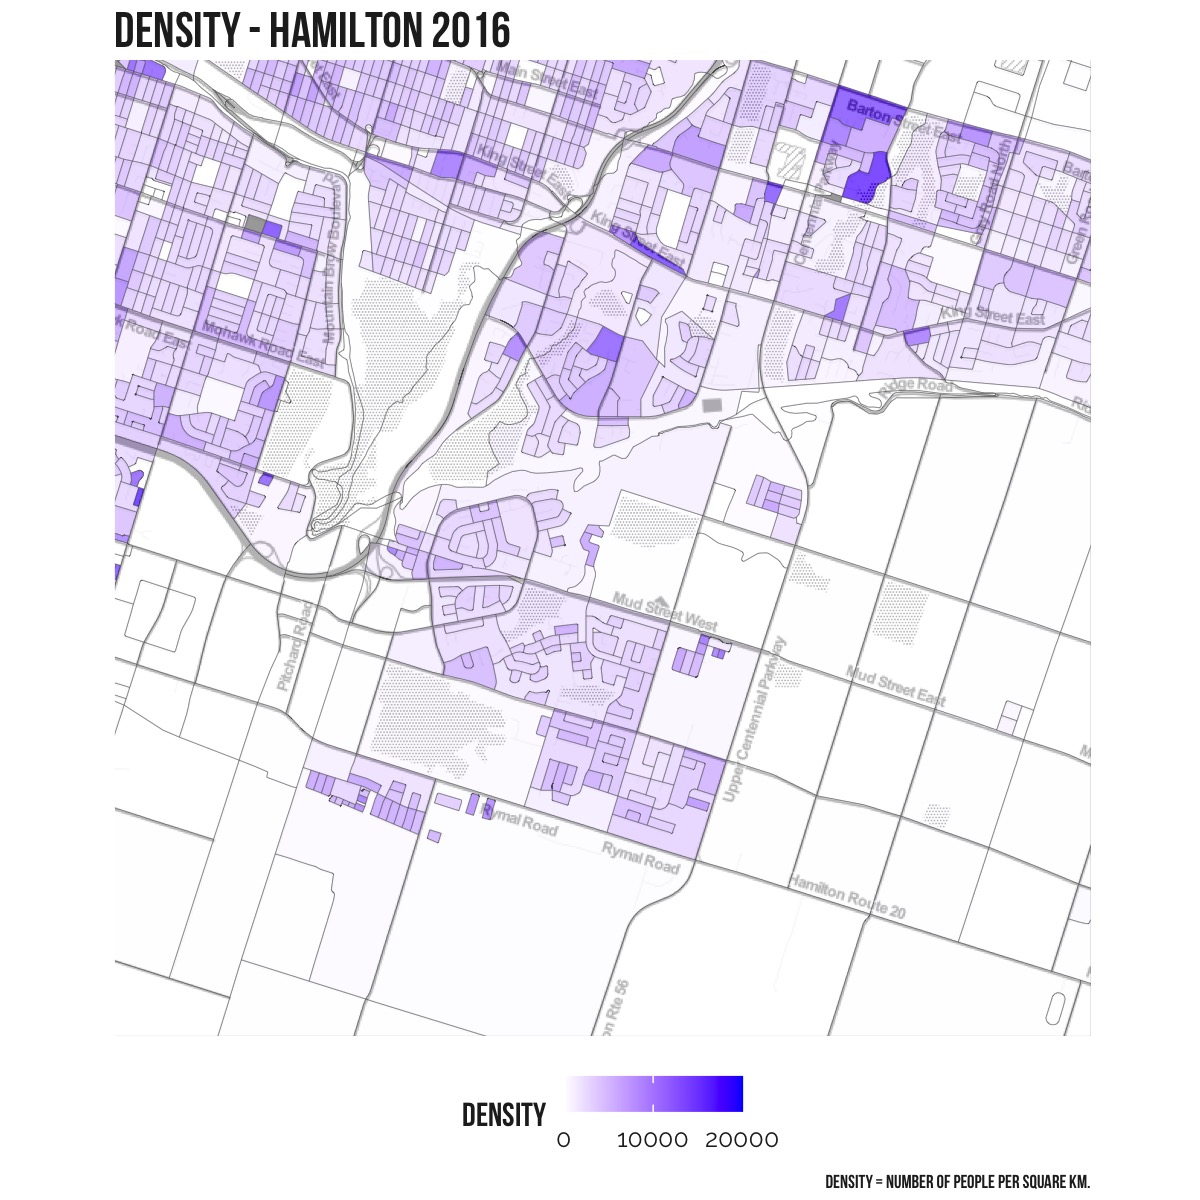
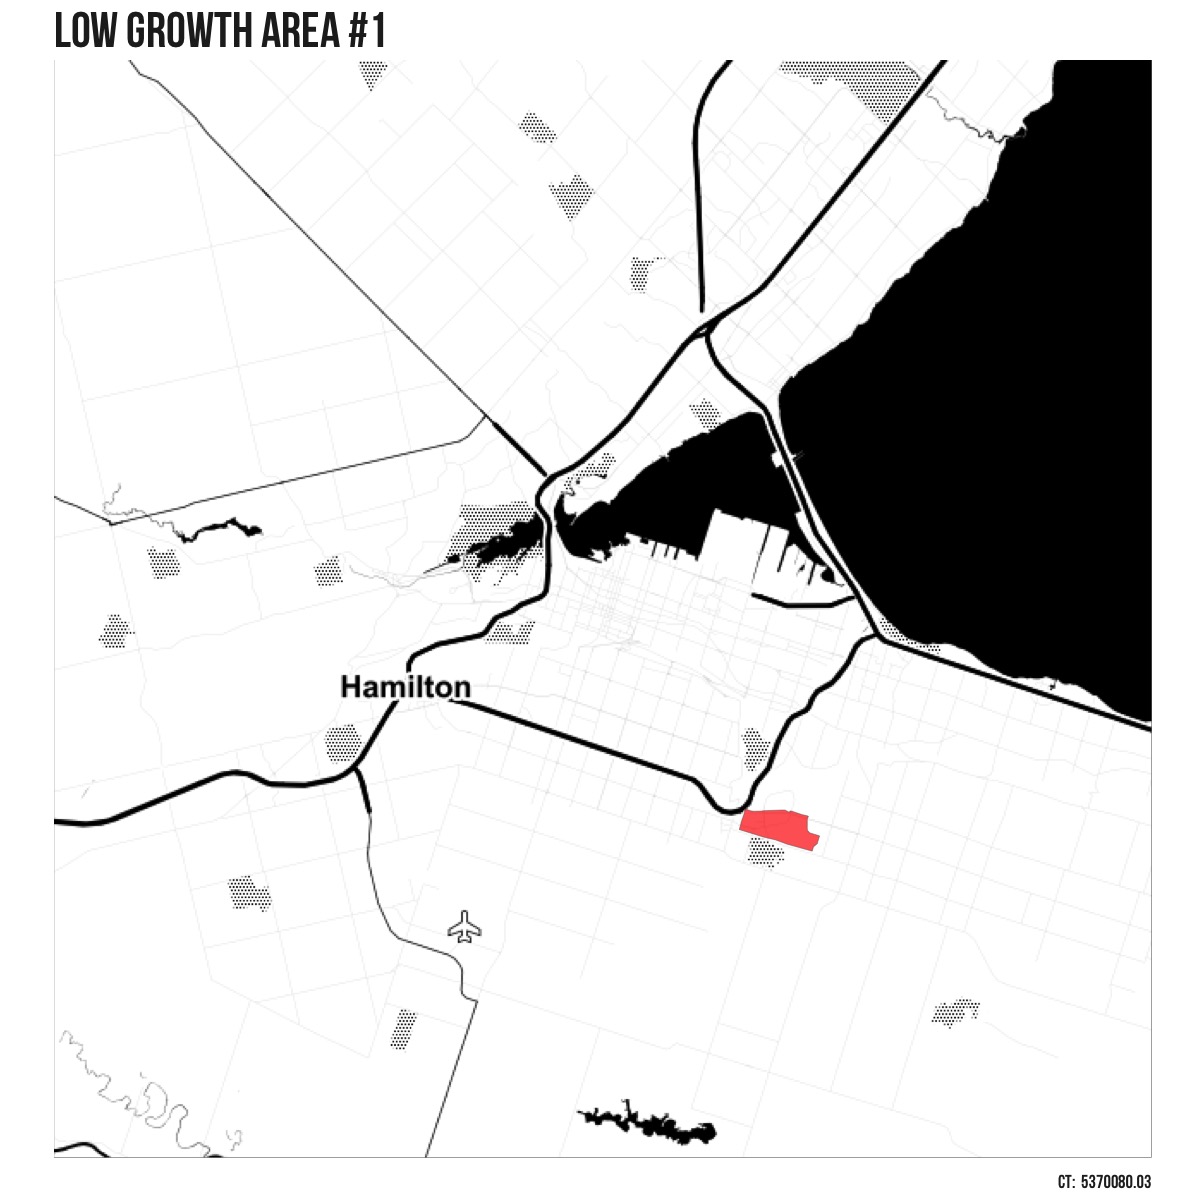
Low Growth Area #1
Surprisingly, the area with the largest decline in population is sandwiched between two areas of high growth – Stoney Creek mountain.
Drag the slider on the map below to see how population density has changed in this area between 2016 and 2021.
Other Areas of Interest
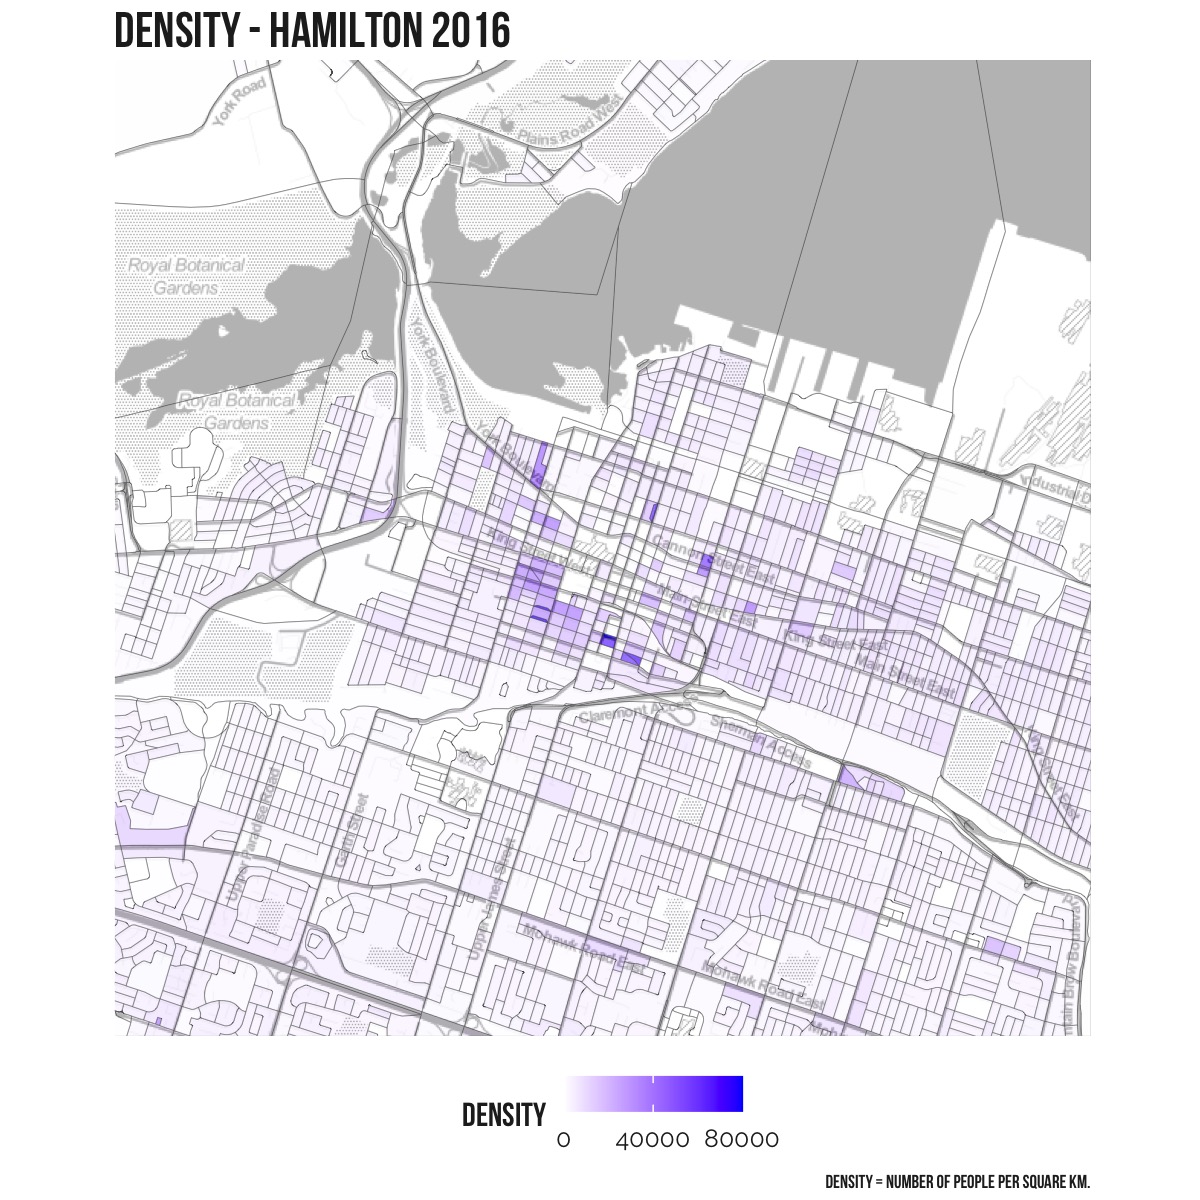
Downtown
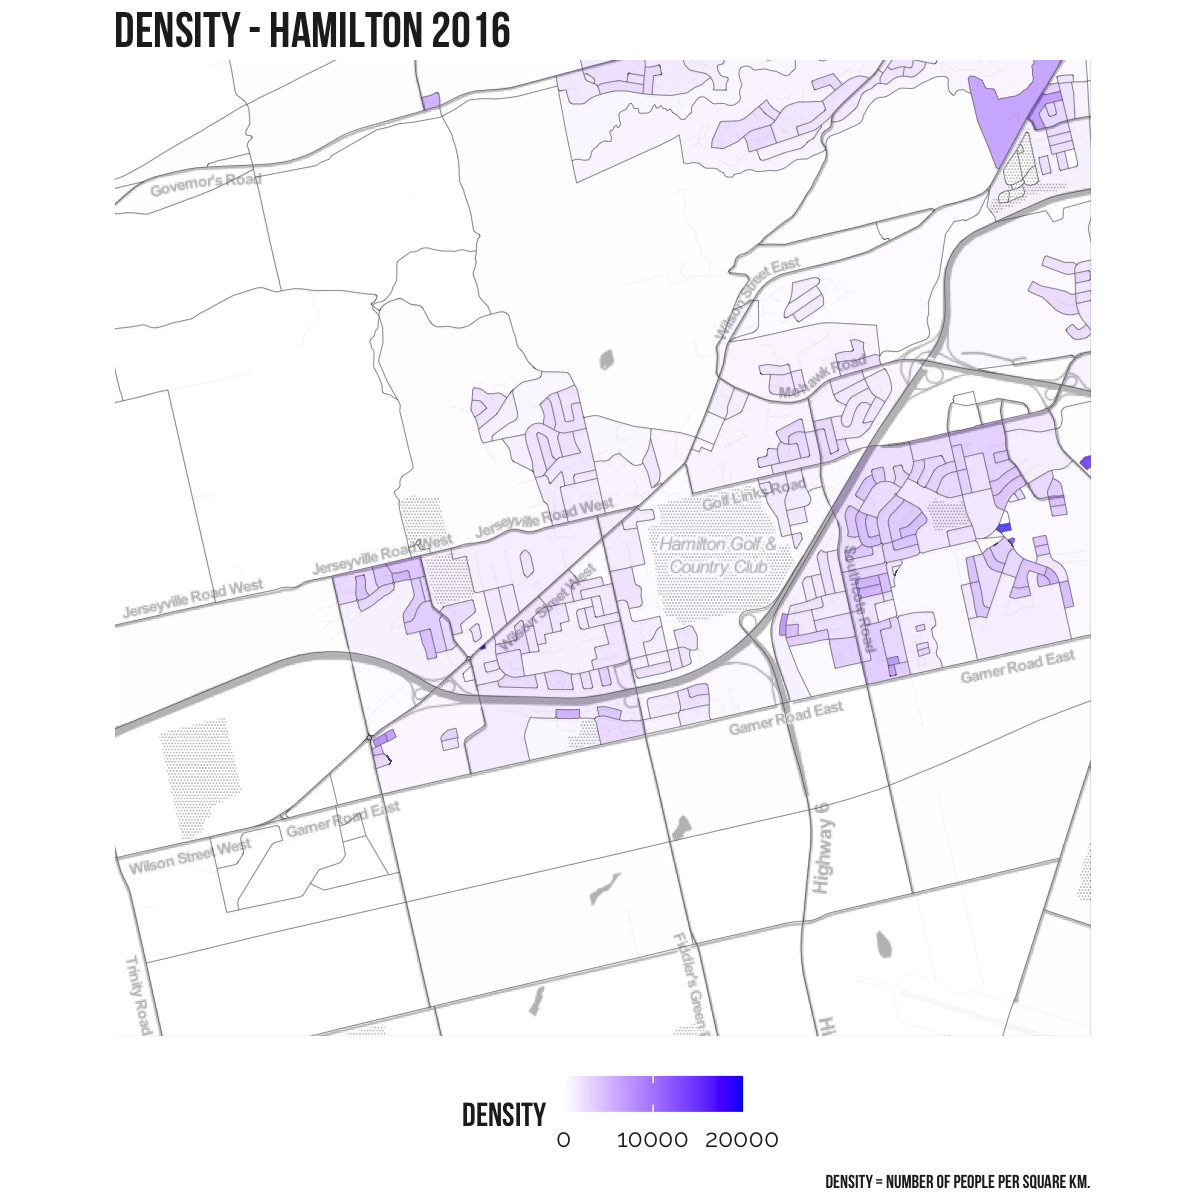
Ancaster
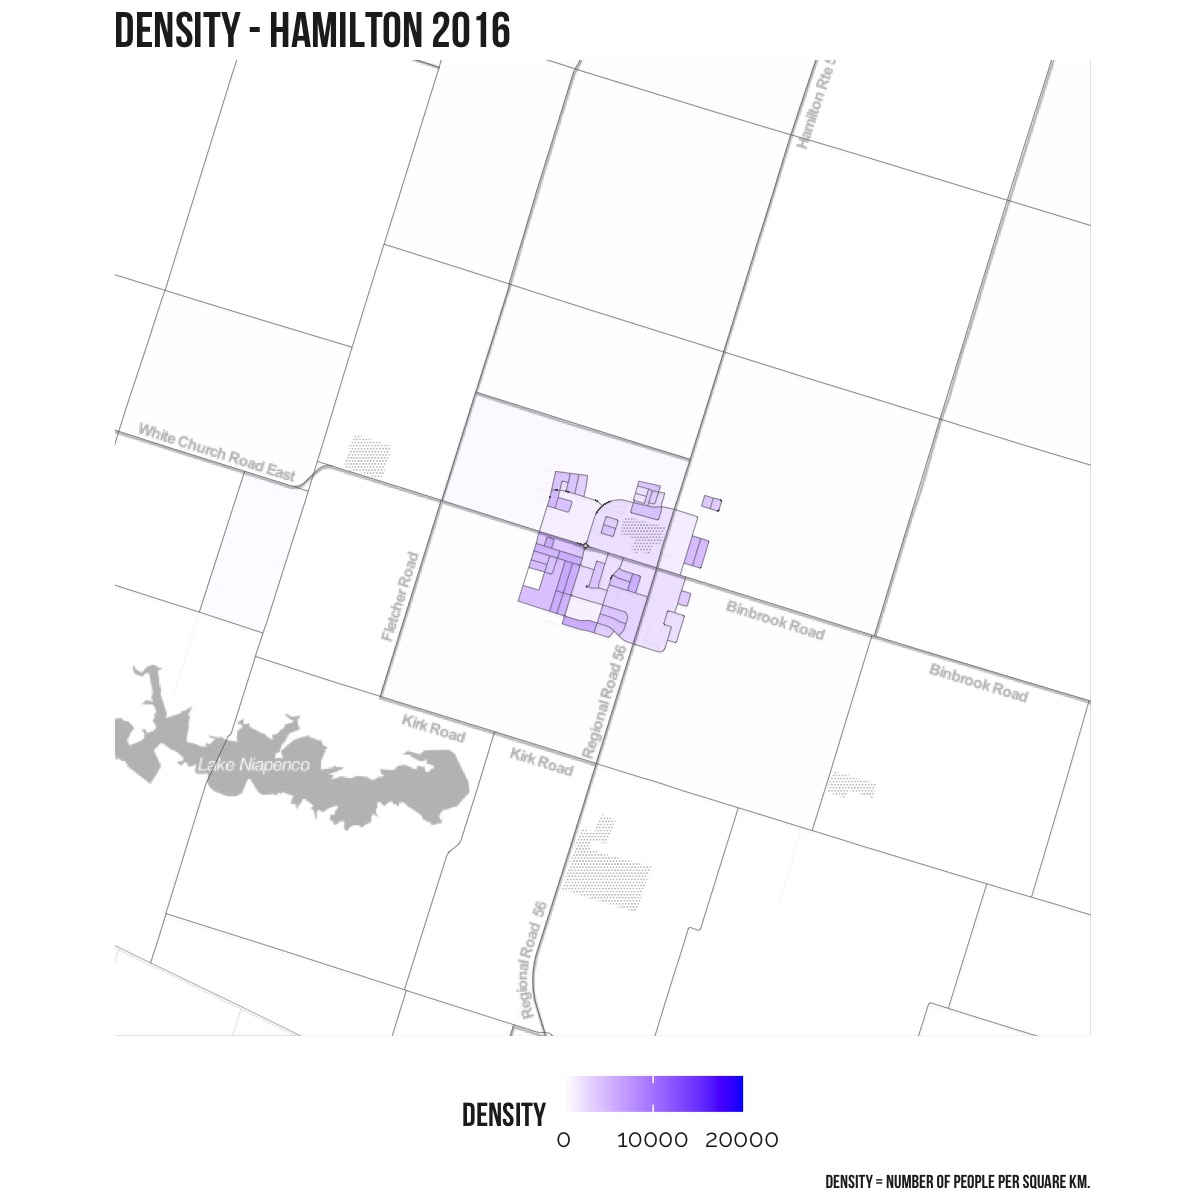
Binbrook
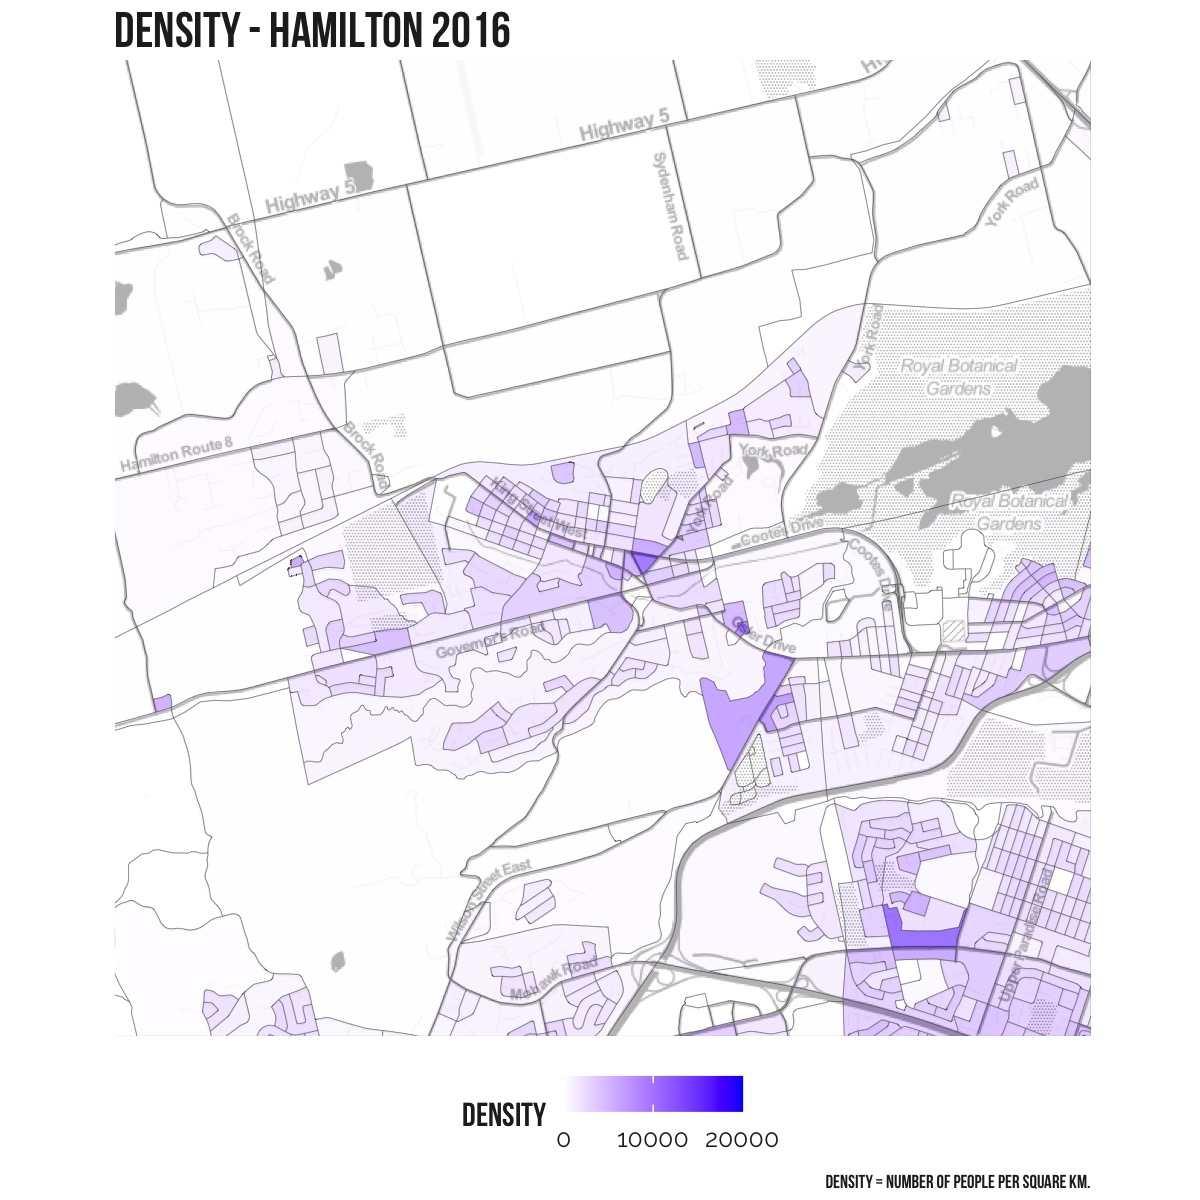
Dundas
Kenilworth
What else do you want to see?
Is there other info you want to see? Or other locations? Get in touch – Contact Me
